How to Use Google Analytics - CXconversion
←
→
Page content transcription
If your browser does not render page correctly, please read the page content below
How to Use Google Analytics

                              https://www.cxconversion.com/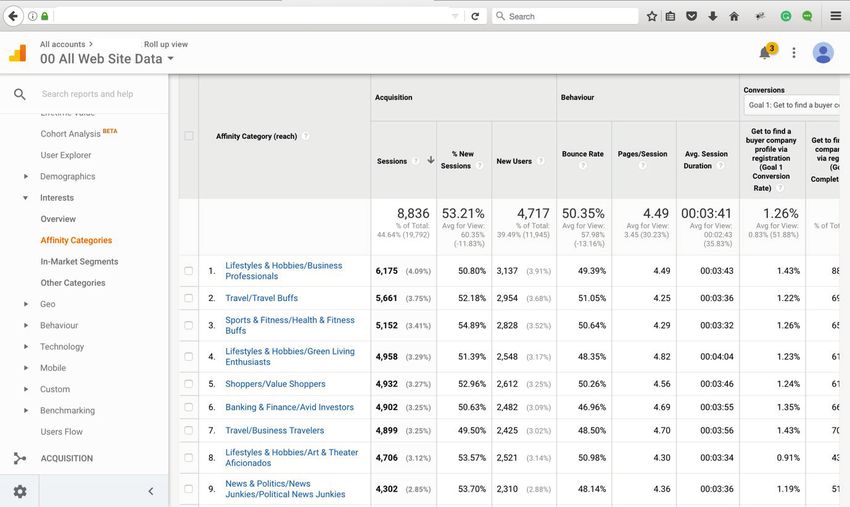
Definition of Google Analytics

 Google analytics is the collection, measurement, analysis and insight report of data from website and mobile apps for the purpose of understand user behaviour

to inform strategic business decisions. Google analytics is not 100% accurate but accurate enough to provide insights to support business decisions. Information

collected by Google Analytics does not always contain personal identifiable information of website users.

 It is a free website and mobile tracking software tool that was launched on 11, November, 2005. The free version of Google analytics is able to record more than

10 million data hots per calendar month which includes page views, goals and events tracking. Website traffic that exceeds this threshold will require upgrading to

Google Analytics Premium which is a paid version of GA.

                           Understanding Key Components and Terms in Google Analytics

 At this stage it is important that you are familiar with the terminologies and key terms in Google Analytics. Listed below are a short summary of terms and their

definition. A more complete list can be found via this link

        https://support.google.com/analytics/topic/6083659?hl=en&ref_topic=3544906

 Bounced visitor: Users who view only a single page on your website and had no further interactions. This is generally considered a bad experience and a sign that

something is wrong with pages with high bounce rates, especially when this happens on Homepages and other important pages.

                                                                                                                                                      https://www.cxconversion.com/
Google Analytics/Tag Manager Tracking Code: This JavaScript snippet code must be added to every page on your websites to enable Google analytics collect

and report on user data. Also generally referred to as GTM or GA tags.

 Goal Conversion: This is the desired action on your websites that is defined as being more valuable that ordinary page views. For example, a “PDF download” on

any of your website is considered a goal conversion. Other types of conversion are:

              Purchase form completion

              Contact form completion

              Video Views

              Click on request call back on the mobile version of your website

 Landing Page: This is the entrance page where user first enter your website.

 Cookies: These are small text files used to store non-personal information in the browsers. They are created when a website is visited, on which Google Analytics

                                                                                                                                                     https://www.cxconversion.com/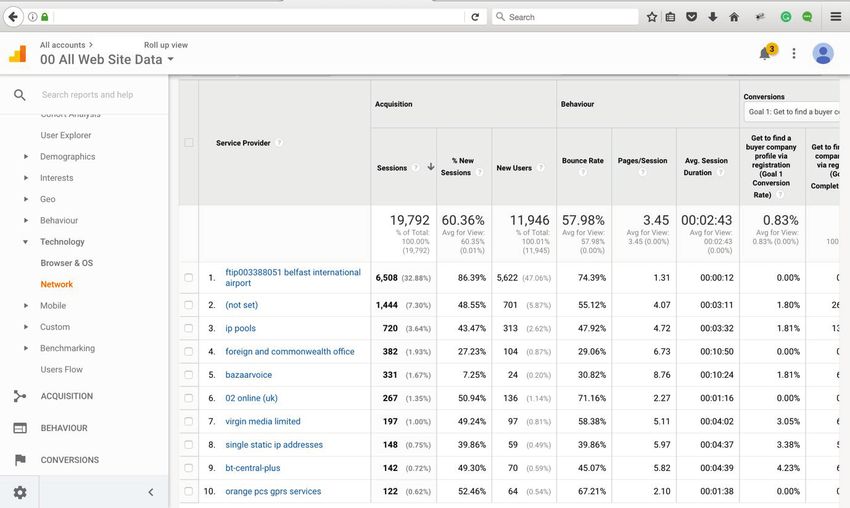
tracking code is installed. Cookers can be reference at a later stage and have few purposes:

               Improve website user experience

               Understand online user behaviour

               Save visitors preferences

 Google Universal Analytics uses only 1 cookie and does not allow this cookie to collect data, as there are other ways data collection occur, such as the measurement

protocol. The user’s browser stores cookie information on their local computer hard drives. Cookies are still available when the browser is closed and later reopened.

Session cookies las only for the duration of the visitor’s session (visit) on your website. The main purpose of cookies is to identify users. Cookies is used to determine

how many first-time or repeat visitors your website have received, how many times a visitor returns each period of time and how much time passes between each visit.

 Metrics: To view how many times something occurred on a website. For example, page views.

 Dimensions: Something you would like to measure within Google Analytics. For example, which browser did visitors use? Which region did we get the most web

traffic?

                                                                                                                                                            https://www.cxconversion.com/

https://support.google.com/analytics/answer/1033861?hl=en

                                                                 https://www.cxconversion.com/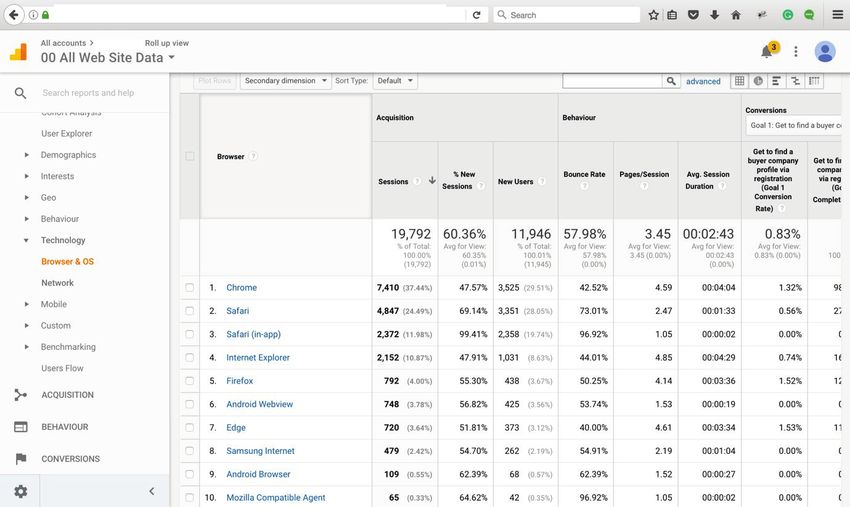
Google Analytics Account, Properties and Views

 If you are using analytics to track a single website, the way to organise your Account is simple - you would have one account for your website. For setting up

Analytics accounts to manage multiple website, keep the following in mind:

               You may have up to 50 properties in any given Google Analytics account.

               If you want to provide administrative access to other users of an Account, this user will be able to see and modify all property data for all

     websites being tracked in the account.

                           What is a web property?

 In Google Analytics, a web property is the cumulative set of pages on which a particular tracking code is installed. In the Analytics tracking code, the web property

for a view has a unique ID, which is a combination of the account ID and additional digits. e.g.

        The X’s (UA-XXXXX-YY) represent the Account number

        The Y’s (UA-XXXXX-YY) represent the property number within your account.

                                                                                                                                                         https://www.cxconversion.com/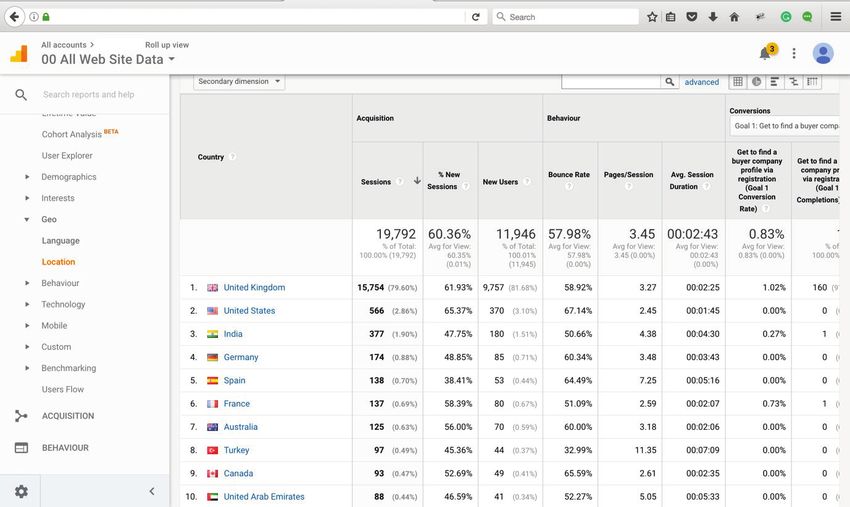
Each Analytics Account will have at least one view by default. The view for an Analytics Account is the gateway to the website reports: it determines which data

from your website appears in the report. When considering views and how they work, first remember that an Analytics Account can track a single web property, or

tract many web independent properties, many sites or a rollup web property.

                          Best Practice for Analytics Properties and Views

 Each website should have a main, internal and “Raw” Profile:

              Main - This will exclude internal traffic from your employees within the office so you can see true customer journeys and information

              Internal - This will include internal employees only

              Raw- This will be unfiltered data that combines all the raw data from Google Analytics by default.

                                                                                                                                                    https://www.cxconversion.com/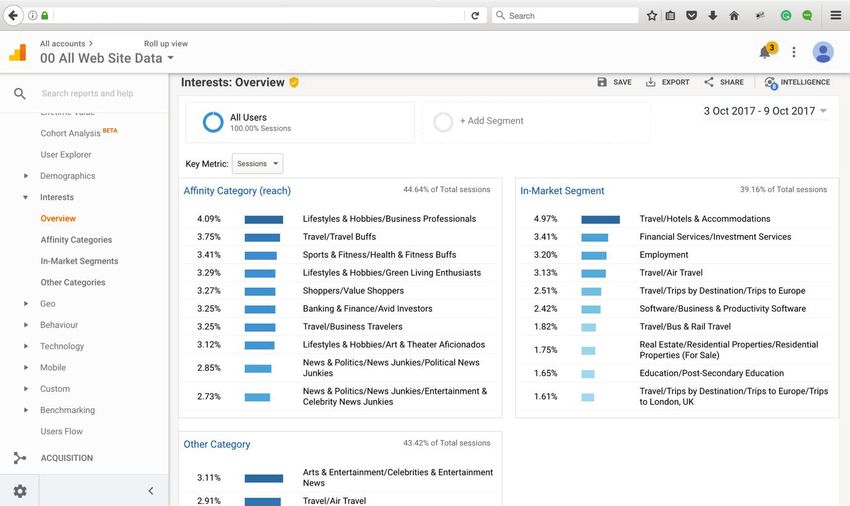
Google Analytics Views and Historical Data

 When you setup a view in GA for your website, data tracking begins as soon as the GTM or GA tracking code is installed on the website. This will start firing as

soon as a user browser loads (visits) a page on your website. When you already have a functioning view for an existing website, and you add an additional view later

on in time, the additional view will not contain the historical data that you see in the first view you created originally.

                            User Management

 The users that have access to your GA account, properties and views can be managed through the GA and GTM admin interface via the user management section.

There are 3 level of access available:

               Account Access level: When giving access here, the access will apply to all levels, Account, Property and View level.

               Property Access Level: This level of access applies to Property and View levels.

               View Access Level: This will apply on to the View level within GA.

 Permission cannot be removed at a lower level if they have been given at a higher level. For example, by giving full “edit permission” at an account level, it is not

                                                                                                                                                         https://www.cxconversion.com/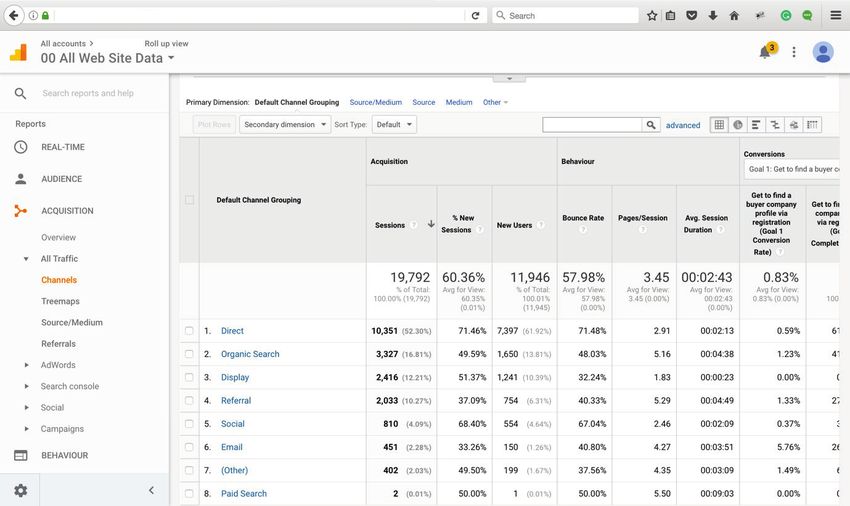
possible to then revoke this at a view level and only give “Read” and “Analyse”” permissions.

 4 different permissions can be granted to users

              Manage Users: This gives a user the permission to Add, Delete and assign permission to other users within GA

              Edit: This does not include access to manage other users but gives a user the permission Add, Delete, edit Account, Properties, Views, Filters

    and Goals.

              Collaborate: Able to create and share personal assets. This also includes “Read and Analyse”. Can also collaborate on shared      assets, E.G

    Edit an annotation within GA reports dashboard

              Read and Analyse: Able to view reports, manipulate data, create and share personal asset and see other shared assets.

                                                                                                                                                 https://www.cxconversion.com/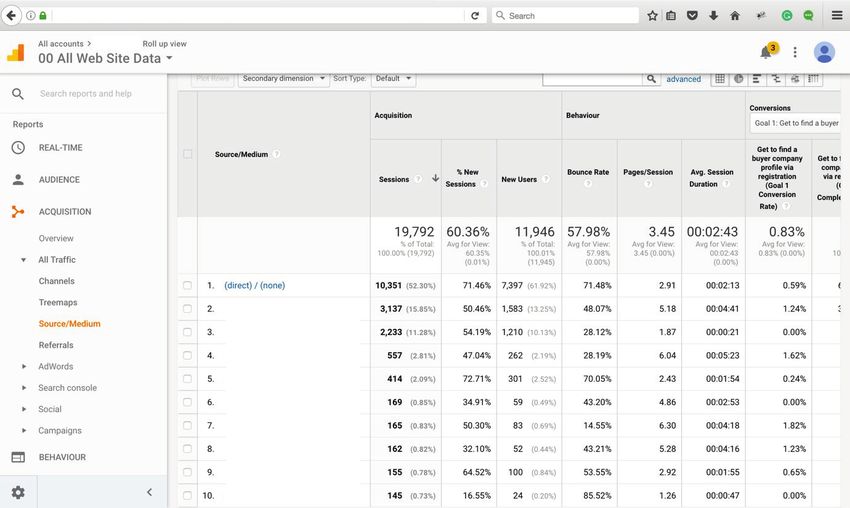
Setting UP Google Analytics

Listed below are the instructions on how to setup Google Analytics.

             First step is to access Google Analytics Via

             It is important that you create a Google account if you don’t already have an email account with Google and also make sure your account is

   configured correctly

             Clicking on the admin button at the bottom will allow you access how to setup new Accounts, Properties and Views as well as access the

   tracking code required for each page of the website for Universal Analytics.

                                                                                                                                              https://www.cxconversion.com/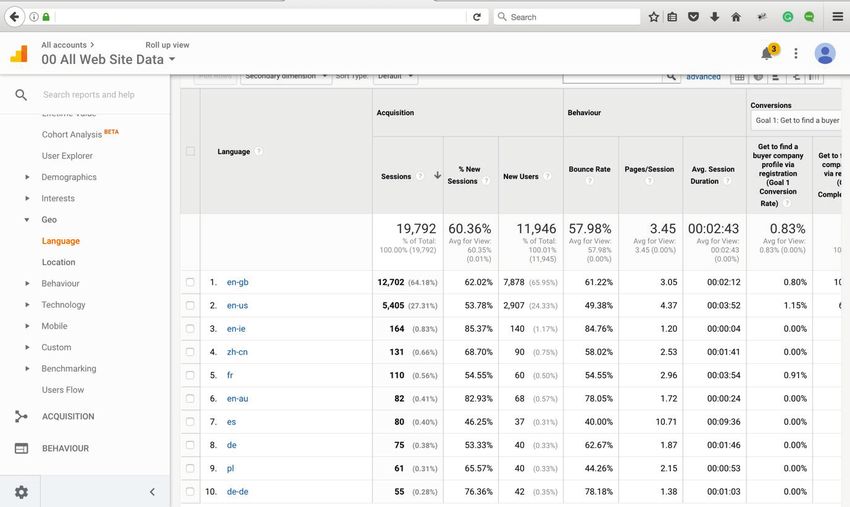
You will be able to choose whether you want to setup Google Analytics for a website or mobile app.

Each individual Google Analytics Account is assigned a unique Property ID under which you are able to obtain your tracking code as well associated website URL.

                                                                                                                                                  https://www.cxconversion.com/
The below code must be pasted on each page of your website.
Filters
Filter can be applied to your Views through the Admin interface. These will include or exclude data based on IP address, hostname or campaign source. For example,
filter that excludes all internal your staff traffic.
https://www.cxconversion.com/Lookup your internal IP address using free IP lookup tools like http://www.whatsmyip.org/ or just type the phrase on Google search “what’s my ip address”
Finding out if a website has GA implemented
Listed below are a few ways to confirm if a website has GA or GTM installed and if the tracking is configured properly and working to expected standard.
Install Chrome plugin that like “WASP”
https://chrome.google.com/webstore/detail/waspinspector-analytics-s/niaoghengfohplclhbjnjheodgkejpih?hl=en
https://www.cxconversion.com/Another option is to “right click” and select “view page source” on a website homepage. Then search for “Google Analytics” or “GTM” within
the page HTML code
Understanding Universal Analytics
Universal Analytics is the current version of GA that is an update of the “Classic Analytics”. This include new features like
User ID: Universal Analytics connects the dots between multiple user sessions, and joins them up to one specific user. Each user can be
assigned its own unique ID, allowing for data in reports to be attributed and specified to one unique user. This allows for more accurate count of users
and also creates the missing link between cross device usage. User using various devices can be linked to one whole user journey instead of separate,
multiple journeys. This great insight to user behaviour can only help foster better business decisions.
Measurement Protocol: There are now various version if the universal analytics code that can send data to Google analytics. This includes
code suited for websites, Google analytics SDK’s, Mobile apps and other digital devices such as games consoles or even digital coffee machines. These
other devices can be measured via the measurement protocol, which is a way to send data to Google analytics from offline sources.
https://www.cxconversion.com/Cookie Reduction: Instead of using several cookies to store information in browser, Universal Analytics now use only one cookie to store
non-personal information about users and their visits. This drastically reduces the numbers of cookers sent.
Understanding Your Website Objectives
Listed below are different website objective based on different needs.
Increase content consumptions and readership. Encourage people to take further action on the website after reading a piece of content. i.e.
register a company profile of signup for your website newsletter.
Stickiness - Time spent on the website. Measure content page views and session length across content pages.
Contact form submission.
https://www.cxconversion.com/How to define website objectives
The first step is to think about your website product, services or section of a website with a direct link to sales and revenue. What are the 3 top goals
for each product or service you sell on your website?
Understanding Key Metrics in Google Analytics
Users: Think of website users as people that visit your pages and each individual is identified through cookies installed on their computer. It’s
also important to understand that one user can visit a website multiple times within a given timespan while other visit less which might impact on the
number of sessions recorded within GA. Beware when calculating users and avoid summing up monthly reports to produce quarterly or annual reports.
Every time a new date range is selected above the report interface of GA, the number of users within that date range is calculated.
Sessions: Every time a user goes to a website, after more than 30 minutes from their last interaction, a session starts. This is possible because
the browser cookie has information about whether or not the user has been on the website before, how many times they stayed on the website and
https://www.cxconversion.com/the number of times they visited the website. It is important to understand that sessions end after 30 minutes of inactivity, at midnight and even after
“12 hours” of continuous activity on a website.
Page View: This is recorded every single time a user views a website page and subject to the tracking code on the page firing. If a user visits a
web page and the analytics tracking code does not fire, the page vie will not be recorded. i.e. no tracking code means not page view is calculated. The
next question that comes to mind is, what is a unique page view? Page views calculate all the views if a page even if some of the pages were viewed
more than once in the same session. Unique page views only count one view of each page viewed, even if some of them were viewed more than once
in the same session. One important fact to be aware is that unique page views will never be more than total page views
Page/Session Metric: The average number of page views divided by total sessions. On average, how many pages were viewed during each
user session. This maybe something you would look to increase overtime to signify increased user engagement.
Percentage of New Session: This is the first time session to a website and is also the same as number of new users to the website.
https://www.cxconversion.com/Understanding Bounce Rate: It is generally believed that a low bounce rate is a good thing, but in what context? Before making a decision about what constitutes
a good bounce rate, check the bounce rate of the following pages:
Blog Post
Contact Us Pages
Newsletter registration and other signup pages
It is possible that all this pages will have a very high bounce rate but does that make them bad pages? There are times when users will engage with your website by
viewing only a single page because the user may possible, click to an external website or arrived to download a PDF and then leave.
https://www.cxconversion.com/Website Conversion: This is defined as the completion of a specific task in your website by users. It can be “number of pages’ views”, “Contact Form Completion”,
or “purchase of an item”. This leads to the next commonly ask question, what is conversion rate? In simple terms, this is the percentage of total session which ends
up achieving a goal defined as a conversion.
Google Analytics Reporting Features
Date Range Feature: Click on the top right tab showing dates and you can change the range by selecting dates. This feature allows you compare 3,6 and 12 months’
periods to understand trends.
https://www.cxconversion.com/You can also select the date view to show, Hourly, Day, Week or Month. Be aware that not all reports will have this choice of granularity.
Annotation: This allows you to highlight the cause of any variation in the trending line in GA reports. This can be shared with the rest of your team and also serve
as a reminder in future of what actions have taken place and when. Annotations can be public, visible for all users with access to your GA account of private to the
individual that created the annotation. To add annotations to a GA report, click on the small arrow at the bottom of the trend report and click “create annotation”
https://www.cxconversion.com/There are different table views available within GA
Data View: This is the normal default view in GA
Pie Chat View: As the name suggest, this view represents data in a pie chart view. Metrics can be change via the drop-down menus
https://www.cxconversion.com/Performance Chart: This reports shows the proportion of a whole, as percentage, that a given dimension represents.
Comparison Chart View: Shows the percentage, higher or lower, that the measurement of a dimension is compared to the site average.
https://www.cxconversion.com/Pivot Table: Allows you to compare Groups of different dimensions to each other. This table view works when there are two or more dimensions to compare.
Advanced Search Feature: You can narrow down your search quickly by using the search box at the top of a report table. You can search for specific keywords,
URLs or language use the search tool.
https://www.cxconversion.com/Another option is to click the “Advanced button” and selecting one of the advanced options.
You can add more than one value into the same report. The “|” creates a OR statement and shows values that match multiple entries. It is recommended that you try
to be more specific with your search. For example, in PPC keywords report. You can specifically view branded traffic with bounce rate of over 70%
https://www.cxconversion.com/Metrics comparison in graphs: In GA reports you can compare different metrics overtime by click on the metric options above the trend report.
Ordering data within GA: Reports within GA can be ordered from top to bottom or bottom to top, just by clicking on the metric to be sorted. The arrow indicated
the current order of the report and click on the arrow will change the ordering.
Change metrics in the report: GA metrics can be changes in the predefined reports with the superior panel. The create new group section allows you create a new
https://www.cxconversion.com/set of metrics, customised.
Note: this feature is not available in the Overview reports sections.
Primary and Secondary Dimensions: Whenever you view a report, the default dimension is the primary dimension. For example, in the Landing page report, the
most visited landing pages is the default primary dimension. There are other dimensions that can be displayed by clicking on the secondary dimension button.
Creating Analytics report directly from Google Analytics
Email: Google Analytics allows reports to be emailed immediately or scheduled in various formats - any day or anytime. They can also be configured to be delivered
periodically with options like Daily, weekly and monthly. To email reports, click on the share button above the GA report.
https://www.cxconversion.com/Exporting reports: Google Analytics allows users to exports Analytics reports as PDF, Excel Files and CSV documents.
Adding Google Analytics Reports to Dashboard: Each report can be easily added to one of your dashboards by clicking on the “Save” button as shown in the
image below. This report will then be added to the “Customisation”.
https://www.cxconversion.com/Segments: These feature allows you to view your report, considering only a portion of the users, based on set of conditions that you are able to configure. You can
create advanced customer segments to be more specific to your own analytics requirements. You have the flexibility to include and exclude dimensions according to
attributes like names and metrics.
https://www.cxconversion.com/https://www.cxconversion.com/
Default Google Analytics Report Interface.

 Real Time Report: This report reveals what’s happing on your website in real-time and can be informative because it allows you see:

              Pages users are currently on

              Geo Location and traffic source

              Goal conversions and current events on your website.

 These report lets you visualise immediate impact of paid advertising and social media campaigns and it is also useful for checking Google tracking code installations

and setup (GA and GTM debugging).

                                                                                                                                                         https://www.cxconversion.com/
Audience Report
Overview: The overview section of the audience report highlights the website traffic trends and metrics such as sessions, Users, Page views, Average session
duration, Bounce rate and New sessions.
https://www.cxconversion.com/Demographic Report: To enable this report you have to turn it on within the Admin section of Google Analytics. Also the website privacy policy must inform website
visitors that an additional cookie will be collecting demographic information. If this report is enabled, you will be able to see an overview audience demographics.
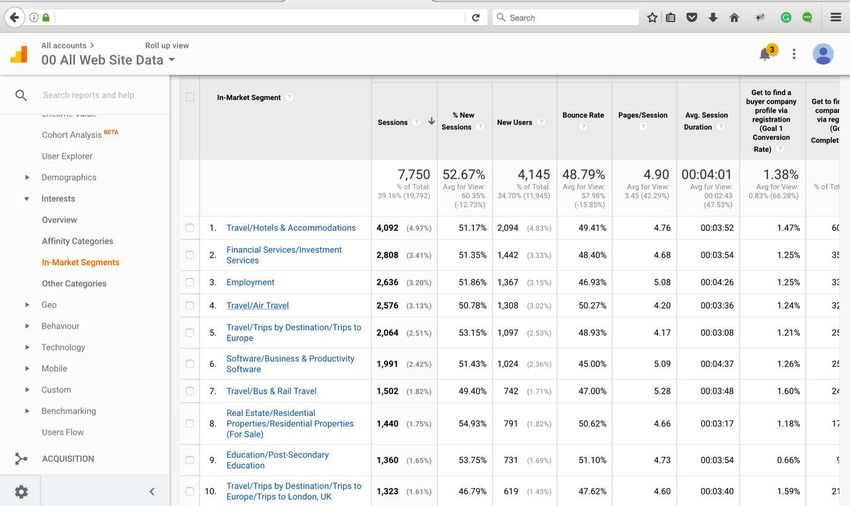
https://www.cxconversion.com/Interest Report: Affinity Category Report and in-Market segments. According to Google via https://support.google.com/analytics/answer/2819950?hl=en
“Understanding your audience composition in terms of gender, age, and interest.” “This reports lets you understand the kinds of creative content you need to develop,
the kinds of media buys you should make, and the kinds of audience you need to develop for marketing and remarketing campaigns”
https://www.cxconversion.com/Geo Report: Language and Location reports is based on user’s browser setting and IP information which highlights website performance by Country, City, Continent,
Sub-Continent and Regions. Location reports is useful when considering creating location based marketing campaigns to target regional users. It can help determine
Facebook and Google, AdWords and other offline advertising activities.
https://www.cxconversion.com/https://www.cxconversion.com/
Behaviour Report: Under this section of Google Analytics, you can access information about “New vs. Returning” website users, “Frequency and Recency” of

visits, and “Engagement” metrics which highlights the session durations of users.

                                                                                                                                             https://www.cxconversion.com/
Technology Report: This reveals information about users “Browsers & OS” as well as “Network” information.
Mobile: “Overview” and “Device” reports: The number of users accessing website through their smart phone devices is increasing which has resulted in more
mobile optimized websites. Google analytics reveals how many and the type of mobile devices used to access your website. This data can help create mobile friendly
website with particular emphasis on goal conversions and user experience.
https://www.cxconversion.com/User Flow Report allows you visualize website user journey across pages of your website.
https://www.cxconversion.com/Acquisition
Overview section highlights where your website traffic is coming from. Click on “All Traffic > Channels Report” to view details about Organic, Paid Search, Direct,
Social Media traffic and Referral traffic from external websites. It is important to understand where visitors traffic to your website is coming from because this will
allow you assign your marketing campaign budgets to the highest converting traffic source. You can also narrow the report further to show sources and medium.
https://www.cxconversion.com/https://www.cxconversion.com/
Search Engine Optimization

 Google Console is a free website optimization product that provides data to help improve website performance in Google search. Connecting your website Analytics

with Search console will make SEO reports visible with Google analytics. This report provides data about what users see in Google search results pages before they

decide to click on your website. Using this data to identify and prioritize opportunities to increase the number of website visitors to your website from Google search.

This section also contain countries reports that show daily search engine impressions, click and all search queries that contain your website URL within Google results

pages.

                           Behaviour

 Overview: This section of Google analytics reports highlights the site content pages, site speed, site search, events and Experiments. The site speed section reveals

the average page load time across individual pages of your website which has become an important requirement to rank on Google and it also has a direct impact on

website conversions. The Site search section provides an overview of the key search terms that users are searching for on your website. This needs to be configured

with the “Admin” section of Google Analytics and your website must have a internal search functionality.

                                                                                                                                                           https://www.cxconversion.com/
Conversion Reporting
This section of Google analytics report contains all your website conversion data which is not configured by defaults because you need to determine what actions
on your website constitutes conversions. There are two ways to track conversion with Google analytics, first is through “Goals” and the second way is through
“ecommerce” tracking. For ecommerce tracking you will require additional tracking code implemented.
Website goals are valuable ways of measure success on your website and how that relates to your business objectives. You can setup goals based on goal funnels
path. This is a series of pages through which a website visitor is expected to journey through before completing a final conversion such as form completion or profile
registration.
You create goal funnels by adding specific URLs of your website into the funnel goal configuration and ending with the final URL on which the conversion takes
place. This will allow you analyse the traffic that enters and exits the funnel you have specified along the way. It is important to understand the following in goal
funnels:
The moment you configure a funnel in Google analytics, it will start to collect the data. However, goals do not collect historic data prior to its
configuration. It all starts when from the moment the goal is created with Google Analytics.
Website goals will only fire once per session, for example if a user submits a contact form 30 times within one session, the goal will only be
https://www.cxconversion.com/recorded once.
During goal setup process, be selective about what you define as a goal because you only want to track important KPIs.
Goal is also perfect for helping you visualize user flows across important pages on your website.
Setting up Gaols in Google Analytics
Goal setup are configured within the Admin section of Google analytics as highlighted in the images below.
https://www.cxconversion.com/Listed below are the different type of “Goals” within Google analytics:
Destination Goals: This is a URL destination goal for tracking certain actions that you want website users to undertake. For example, A form fill out. The other types
of goals are events goals duration goals, page screen goals.
Need help with setting up your Google Analytics? Email me at femi@cxconversion.com or visit our website https://www.cxconversion.com
https://www.cxconversion.com/Created by Femi Olajiga – AGILE MARKETING TRAINER AND COACH
https://www.linkedin.com/in/femi-olajiga-msc-9447a923/
https://www.cxconversion.com/
https://twitter.com/femiolajiga
femi@cxconversion.com
Register for Agile Marketing Training: https://www.cxconversion.com/learn-agile-marketing/agile-marketing-training-workshops/
Book Agile Marketing Coaching Sessions: https://www.cxconversion.com/learn-agile-marketing/agile-marketing-coaching-services/
DOCUMENT DESIGN – Antonia Gala Saric
antoniagala.saric@gmail.com
https://www.cxconversion.com/You can also read