ICE HOCKEY NATIONAL TEAM PERFORMANCE MODEL - PWC
←
→
Page content transcription
If your browser does not render page correctly, please read the page content below
www.pwc.com/cz

             Ice Hockey National
             Team Performance
             Model

April 2015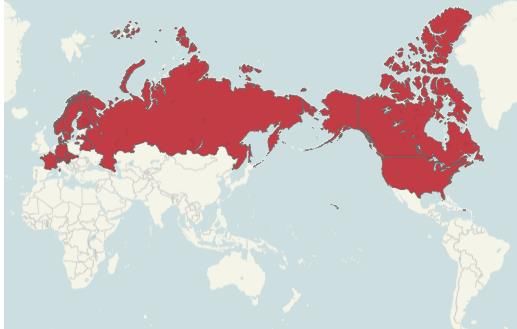
The consulting firm PwC analysed the                     beat Sweden. The dark horse of the
conditions of every country for success                  Championship will be Switzerland
in the Ice Hockey World Championship                     which did not fulfil its potential until
that starts May 1 in Prague. Statistical                 now.
analysis that took into account,
besides other things, historical results                 In this paper we utilized the regression
at championships in the last 20 years,                   analysis for estimating the so-called „PwC
the number of stadiums, the number of                    point index“. This index represents historical
ice hockey players registered,                           performance of national teams during the past
demographic and economic indicators                      20 years (1994 – 2014) of world
or the average annual temperature                        championships. It also takes into account
favours the host - Czech Republic. The                   every place in the final ranking, not just the
silver should go to the Russian team                     first three (medal positions) as seen in the
and bronze to the Canadians that will                    table 1.

Table 1: Historical Performance Calculation

   Rank          Ranking Points            Medal Bonus             Medal Weight             Final Points
        1                         16                       10      4 * silver team points             192
        2                         15                       10    2 * bronze team points                 48
        3                         14                       10                          0                24
        4                         13                        0                          0                13
        5                         12                        0                          0                12
      (…)
       16                          1                        0                          0                   1

The calculation clearly favors teams that were       ago the corresponding championship took
able to win a medal. We use the following            place. A simple reasoning tells us that the older
algorithm to recalculate weights of the              the result is, the less relevant for this analysis it
individual medals – gold is worth 4 silver           must be. Bearing in mind that we possess 20
medals and silver is worth 2 bronze. Unlike          year span of data and we need to distribute the
similar ranking systems we also graded the rest      points evenly, we chose to edit the calculated
of the ranking ladder – that means the teams         points according to appropriate weights. The
from the 4th place onwards are graded as             oldest year was fixated with the weight of 0.33,
follows:                                             so the winner of the 1994 season will be
                                                     awarded only a third of the points the last
      Points = Number of teams in total – final
                                                     year’s winner would be.
                ranking of team + 1
                                                     Between the years 2014 (with 100 percent
                                                     weight) and 1994 (with 33 percent weight) the
In this calculation we also took into
                                                     individual steps were adjusted by 0.0335.
consideration the fact that the world
                                                     Amount of points was multiplied by the
championships in the years 1994 – 1997
                                                     corresponding weight and all of the edited
consisted of only 12 teams taking part in the
                                                     point indices for every national team were
competition and only from the year 1998 the
                                                     summed up.
rules are stable at the amount of 16 teams in the
championship pool.
                                                     This resulted in the base of the future analysis
                                                     – dependent variable – the historical
Another relevant factor is the recency of the
                                                     performance of the national team
achieved result – that means how many years

PwC                                                                                           Page 2 of 8
Table 2: Historical Performance of Countries The next part of this analysis was to identify
Overview (alphabetical order) independent variables that were significant
enough. The first obvious source was the data
Country Historical Performance from the World Economic Outlook published
Austria 32.555 by the International Monetary Fund. Among
the used attributes of above specified countries
Belarus 71.87 we chose GDP, unemployment rate, number of
Canada 748.1645 inhabitants and others. As the analysis showed
later on, none of them was relevant enough to
Czech Republic 846.3045 describe the PwC Point Index variable.
Denmark 50.5765
As the charts 1 & 2 show, the ability of GDP
Finland 532.0255
and number of inhabitants indicators (i.e.
France 43.456 economic and demographic criteria) to
credibly describe the dependent variable is
Germany 81.562
very low (coefficient of determination is almost
Latvia 85.624 zero using the linear function).
Norway 66.962
This finding implicates that economic
Russia 865.8 prosperity of a country does not influence the
Slovakia 286.801 performance of the national teams (given the
data we used it seems that it is almost
Slovenia 10.645 contradictory). We decided to abandon these
Sweden 711.343 indicators and chose a different set of data
where we awaited significantly better
Switzerland 147.3445 performance – statistical data of the
United States 161.3235 International Ice Hockey Federation (IIHF).
Chart 2: Correlation of Historical Performance Chart 1: Correlation of Historical Performance
Score and Number of Inhabitants Score and GDP per capita
PwC Page 3 of 8International Ice Hockey Federation presents As the last input variable we used an attribute
at its website (http://www.iihf.com/iihf- indicating how many times the corresponding
home/countries/) the member countries data country served as a host for the championship
relevant to ice hockey – date of induction to in the past 20 years. This attribute further
the federation, name of the current president supports the hypothesis that well-performing
of local ice hockey organization, IIHF ladder national teams are mostly in countries with
country ranking etc. For creation of the model long hockey tradition and popularity.
we chose numerical attributes we assumed
might describe the PwC Point Index well:
Chart 3: Correlation of Historical Performance
Number of registered male players
Score and Number of Registered Referees
Number of registered female players
Number of registered junior players
Number of registered referees
Number of indoor rinks
Number of outdoor rinks
These attributes possess significantly higher
ability to describe the performance levels of
individual national teams, as shown in the
charts 3 and 4.
These variables were then complemented by
an attribute describing average air
temperature of the countries (data come from
the publicly accessible sites on
Wikipedia.org). We operate under the
assumption that countries with colder climate
have longer tradition of winter sports such as
Chart 4: Correlation of Historical Performance
ice hockey and the sport should be more
Score and Number of Registered Players
popular there than in the southern countries.
This claim is also supported by the map of
current participants of the 2015 world
championship.
Figure 1: IIHF WC 2015 Participants
PwC Page 4 of 8The resulting source data are presented in the table 3.
Table 3: Source Data for Regression Analysis (alphabetical order)
Historical Average Registered Players Indoor Outdoor
Country Count as Host Referees
Performance Temp. Male Junior Female Rinks Rinks
Austria 32.555 7 2 6069 4978 673 265 45 72
Belarus 71.87 5.9 1 3423 4890 42 129 31 3
Canada 748.165 3.6 1 116884 518008 86612 32710 2631 5000
Czech
846.305 6.8 1 85576 22302 2647 4727 158 23
Republic
Denmark 50.577 7.5 0 1678 2174 400 111 25 0
Finland 532.026 2.6 3 28589 39263 5830 1821 260 28
France 43.456 11.2 0 6819 10071 1321 109 135 9
Germany 81.562 7.8 2 8389 18084 2898 223 202 45
Latvia 85.624 6 1 3965 1689 86 187 17 0
Norway 66.962 4.4 1 1818 4179 632 270 45 1
Russia 865.8 -0.6 2 1966 81592 712 1164 419 2450
Slovakia 286.801 6.2 1 2122 8675 511 546 64 17
Slovenia 10.645 7.9 0 145 799 76 38 7 0
Sweden 711.343 4.7 3 11884 41521 3434 4296 355 136
Switzerland 147.345 6 2 11584 13740 1091 1106 158 30
US 161.324 11.6 0 149884 302303 67230 23413 1898 500
Regression analysis was performed on this data set using a linear function. All of the input variables
were significant enough to be used in the model.
Table 4: Regression Outcome of the Historical Performance Model
Independent Variable Coefficient Standard Error t-Stat
Average Temperature -6.0149949 6.5930833 -0.91232
Number of Times as a Host 11.889306 27.556902 0.431446
Male Players 0.0066446 0.0013375 4.96801
Junior Players 0.0168595 0.0065651 2.56803
Female Players -0.1058729 0.019005 -5.57078
Referees 0.0291248 0.0281171 1.035841
Indoor Rinks 0.3514684 0.4023114 0.873623
Outdoor Rinks -0.2968958 0.1587554 -1.87015
PwC Page 5 of 8By applying the result back on the original data set (with blank values of the dependent variable) we
got a model estimation of team performance according to our input variables. These values represent
the performance the teams should accomplish.
Values for Denmark and Slovenia
Table 5: Application of Regression Analysis on Original Dataset
were adjusted due to the negative
with Dependent Variable Removed (ordered by model estimates)
prediction of the model, which is
absent of any sense for this
Historical analysis – even if a country ends up
Country Model Estimates
Performance last in the championship,
Czech Republic 846.3045 821.7345 according to our model it is
awarded with 1 point (minimal
Russia 865.8 794.4395 amount). We manually edited
Canada 748.1645 723.2646 Denmark and Slovenia to the value
of 0.
Sweden 711.343 632.33
Finland 532.0255 390.8101 Another interesting analysis would
Switzerland 147.3445 259.6385 be to use similar attributes on a
timeline – it would be possible that
Slovakia 286.801 114.1999 way to predict the outcome of a
United States 161.3235 105.5135 championship more precisely.
However, the IIHF data source
Germany 81.562 94.80114
does not contain historical data
Belarus 71.87 90.90333 that we could use for this kind of
France 43.456 55.82584 analysis, so we did not focus on
this goal in our work.
Austria 32.555 36.83123
Latvia 85.624 32.93697 The last page contains final
visualization of the national ice
Norway 66.962 24.43011
hockey team performance
Denmark 50.5765 0 estimation by regression model
Slovenia 10.645 0 described in this paper.
PwC Page 6 of 8Figure 2: Ice Hockey Teams Performance Model PwC Page 7 of 8
Contact
                           Pavel Jankech
                           Senior manager
                           PwC Czech Republic
                           pavel.jankech@cz.pwc.com
                           +420 251 151 336

This publication has been prepared for general guidance on matters of interest only, and does not constitute
professional advice. You should not act upon the information contained in this publication without obtaining specific
professional advice. No representation or warranty (express or implied) is given as to the accuracy or completeness
of the information contained in this publication, and, to the extent permitted by law, PricewaterhouseCoopers Česká
republika, s.r.o., its members, employees and agents do not accept or assume any liability, responsibility or duty of
care for any consequences of you or anyone else acting, or refraining to act, in reliance on the information
contained         in      this     publication       or        for     any       decision       based     on       it.

© 2015 PricewaterhouseCoopers Česká republika, s.r.o. All rights reserved. “PwC” is the brand under which
member firms of PricewaterhouseCoopers International Limited (PwCIL) operate and provide services. Together,
these firms form the PwC network. Each firm in the network is a separate legal entity and does not act as agent of
PwCIL or any other member firm. PwCIL does not provide any services to clients. PwCIL is not responsible or liable
for the acts or omissions of any of its member firms nor can it control the exercise of their professional judgment or
bind them in any way.
You can also read