ICES WORKING GROUP ON MACKEREL AND HORSE MACKEREL EGG SURVEYS WGMEGS
←
→
Page content transcription
If your browser does not render page correctly, please read the page content below
ICES WORKING GROUP ON MACKEREL AND
HORSE MACKEREL EGG SURVEYS ( WGMEGS;
outputs from 2020 meeting)

VOLUME 3 | ISSUE 11
ICES SCIENTIFIC REPORTS

RAPPORTS
SCIENTIFIQUES DU CIEM

 IC E S INTERNATIONAL COUNCIL FOR THE EXPLORATION OF THE SEA
 CIEM CONSEIL INTERNATIONAL POUR L’EXPLORATION DE LA MER
International Council for the Exploration of the Sea
Conseil International pour l’Exploration de la Mer
H.C. Andersens Boulevard 44-46
DK-1553 Copenhagen V
Denmark
Telephone (+45) 33 38 67 00
Telefax (+45) 33 93 42 15
www.ices.dk
info@ices.dk

ISSN number: 2618-1371

This document has been produced under the auspices of an ICES Expert Group or Committee. The
contents therein do not necessarily represent the view of the Council.

© 2021 International Council for the Exploration of the Sea.

This work is licensed under the Creative Commons Attribution 4.0 International License (CC BY 4.0).
For citation of datasets or conditions for use of data to be included in other databases, please refer to
ICES data policy.

ICES Scientific Reports

Volume 3 | Issue 11

ICES WORKING GROUP ON MACKEREL AND HORSE MACKEREL EGG SUR-
VEYS (WGMEGS; outputs from 2020 meeting)

Recommended format for purpose of citation:
ICES. 2021. ICES Working Group on Mackerel and Horse Mackerel Egg Surveys (WGMEGS: outputs from
2020 meeting)
ICES Scientific Reports. 3:11. 88pp. https://doi.org/10.17895/ices.pub.7899

Editors
Gersom Costas • Matthias Kloppmann

Authors
Paula Alvarez • Maria Manuel Angelico • Finlay Burns • Gersom Costas • Thassya dos Santos Schmidt
Dolores Garabana • Matthias Kloppmann • Maria Korta • Cristina Nunes • Brendan O'Hea
Isabel Riveiro • Paz Sampedro • Antonio Solla • Anders Thorsen • Jens Ulleweit • Cindy van Damme

ICES | WGMEGS 2020 | i

 Contents
 i Executive summary .......................................................................................................................iii
 ii Expert group information ..............................................................................................................iv
 1 Summary of Work plan .................................................................................................................. 1
 2 Summary of Achievements of the Work Group during 3-year term ............................................. 2
 3 Final report on ToRs, workplan and Science Implementation Plan............................................... 3
 3.1 Activities in 2018, 2019 and 2020 .................................................................................... 3
 3.2 Western and Southern egg survey in 2019 ...................................................................... 4
 3.2.1 Countries and Ship Participating ...................................................................................... 4
 3.2.2 Sampling Areas and Sampling Effort in the Western and Southern Areas ...................... 5
 3.2.3 Sampling and Data Analysis ............................................................................................. 9
 3.2.4 Sampling Strategy for Southern Horse Mackerel in ICES division 9a ............................... 9
 3.3 Hydrography 2019 report .............................................................................................. 10
 3.3.1 Southern Horse Mackerel DEPM Survey ........................................................................ 10
 3.3.2 Mackerel and Western Horse Mackerel Egg Survey ...................................................... 11
 3.4 Mackerel in the western and southern spawning areas: 2019 egg survey results ........ 12
 3.4.1 Spatial distribution of stage 1 mackerel eggs ................................................................ 12
 3.4.2 Egg production in Northeast Atlantic mackerel ............................................................. 21
 3.4.2.1 Stage I egg production in the western area ................................................................... 21
 3.4.2.2 Stage I egg production in the southern area ................................................................. 23
 3.4.2.3 Total Egg production ...................................................................................................... 25
 3.4.3 Fecundity of Northeast Atlantic mackerel ..................................................................... 26
 3.4.3.1 Adult sampling ............................................................................................................... 26
 3.4.3.2 Histological screening .................................................................................................... 27
 3.4.3.3 Potential Fecundity in the Western and Southern combined components .................. 28
 3.4.3.4 Atresia and realized fecundity ....................................................................................... 32
 3.4.4 Biomass estimation of Northeast Atlantic mackerel ..................................................... 33
 3.5 Horse mackerel in the western spawning area.............................................................. 35
 3.5.1 Spatial Distribution of Stage I Horse Mackerel Eggs ...................................................... 35
 3.5.2 Egg Production in Western Horse Mackerel .................................................................. 42
 3.5.3 Horse mackerel fecundity sampling ................................................................................... 44
 3.6 Horse mackerel in the southern spawning area ............................................................ 45
 3.6.2. Daily fecundity ................................................................................................................... 46
 3.7 Daily Egg Production Method analyses in the western and North Sea spawning
 areas and Southern? spawning areas ............................................................................ 49
 3.7.1 Western Mackerel ......................................................................................................... 49
 3.7.2 Western Horse mackerel ............................................................................................... 60
 3.8 Quality aspects of the 2019 survey (ToR c, d, e, h) ........................................................ 60
 3.8.1 Spatial and temporal coverage during the 2019 egg survey ......................................... 60
 3.8.2 Fecundity and atresia sampling ..................................................................................... 61
 3.8.3 Egg diameter measurements ......................................................................................... 67
 3.8.4 Mackerel egg development experiments ...................................................................... 68
 3.8.5 Gonad development of female mackerel ...................................................................... 68
 3.9 North Sea mackerel egg survey in 2020 (ToR f, j) .......................................................... 69
 3.10 Planning for the 2022 survey (ToR a) ............................................................................. 70
 3.11 Database (ToR k) ............................................................................................................ 70
 4 References ................................................................................................................................... 72
 Annex 1: List of participants.......................................................................................................... 73
 2020 Participants ......................................................................................................................... 73
 2019 Participants ......................................................................................................................... 74
 2018 Participants ......................................................................................................................... 75

ii | ICES SCIENTIFIC REPORTS 3: 11 | ICES

 Annex 2: Agendas of the 2020 meetings ...................................................................................... 76
 Agenda WGMEGS April 2020, by WebEx..................................................................................... 76
 ToRs ............................................................................................................................................. 76
 Draft agenda WGMEGS November 2020, by WebEx .................................................................. 77
 Relevant ToRs (year 3) ................................................................................................................. 77
 Annex 3: Abstracts of presentations given during the second WebEx meeting in November
 2020 ............................................................................................................................... 79

ICES | WGMEGS 2020 | iii

 i Executive summary

 The ICES Working Group on Mackerel and Horse Mackerel Egg Surveys (WGMEGS) coordinates the
 mackerel and horse mackerel egg survey in the Northeast Atlantic (NEA) and the mackerel egg survey in
 the North Sea. The working group plans and reports on these surveys, with recent attention focused on
 the execution of the surveys given the increasing demands related to covering the expanding survey
 area as well as balanced fecundity sampling. WGMEGS also addresses data quality assurance in macke-
 rel fecundity and total annual egg production estimation.

 Currently, there are 3 surveys in place which are carried out triennially and deliver standing stock bio-
 mass (SSB) indices: (1) the survey for the western and southern stock components of the NEA mackerel
 stock, as well as for the western horse mackerel stock, (2) the survey for the NEA mackerel North Sea
 stock component, and (3) the survey for the southern horse mackerel stock.

 For the North Sea component, the egg survey in 2017 revealed an estimated egg production of
 201*1012, resulting in an SSB of 287*103 tons. This is a strong increase of more than 100*103 tons com-
 pared to 2015 (SSB = 170*103 tons). While peak spawning in the North Sea was covered, the coverage
 of the complete spawning season and area was insufficient to produce a reliable estimate of survey in-
 dices.

 In 2019, the application of an alternate transect survey design made it possible to survey the persis-
 tently expanding mackerel spawning area and season. Northern and northwestern spawning bounda-
 ries for mackerel during survey periods 5 (weeks 19 – 22) and 6 (weeks 23 – 26) were not fully deline-
 ated. Peak spawning was observed in period 4 (weeks 16 – 18). Subsequent analyses of survey results in
 conjunction with results from exploratory surveys in the inter-survey-years showed that the mackerel
 core spawning area was covered and a reliable estimate of mackerel annual egg production was deliv-
 ered. The estimate of total mackerel egg production was 1.64*1015, which is a decrease of 7.6% com-
 pared to that of 2016 (rev. 1.77*1015).

 Realized fecundity was estimated at 1147 per g female, revealing the SSB for the NEA mackerel stock in
 2019 at 3.09 million tons indicating at 12 % decrease since the 2016 survey (SSB = 3.52 million tons). At
 only 1.78*1014 , total annual egg production (TAEP) in western horse mackerel was found to be lowest
 production reported in the time series since 1992. The spawning maximum was detected in the last pe-
 riod 7 (weeks 27 – 29). It can, thus, not be concluded that peak spawning and the entire temporal ex-
 tent of horse mackerel spawning had been sufficiently covered.

 To further improve the quality of the index time series, WGMEGS will continue to dedicate much of its
 work to survey design and quality assurance in mackerel egg production and fecundity estimation.

iv | ICES SCIENTIFIC REPORTS 3:11 | ICES

 ii Expert group information

 Expert group name Working Group on Mackerel and Horse Mackerel Egg Surveys (WGMEGS)

 Expert group cycle Annual

 Year cycle started 2018

 Reporting year in cycle 3/3

 Chair(s) Matthias Kloppmann, Germany

 Gersom Costas, Spain

 Meeting venue(s) and dates 9 – 13 April 2018, Dublin, Republic of Ireland, (18 participants)

 26 – 27 August 2019, Sta Cruz de Tenerife, Spain, (8 participants)

 28 – 29 April 2020 by video conference (22 participants)

 4 – 6 November 2020 by video conference (24 participants)

ICES | WGMEGS 2020 | 1

 1 Summary of Work plan

 Year WORK PLAN

 Year 1 Planning of the egg survey in 2019 and reporting on the North Sea egg survey of 2017.

 Year 2 Survey year, the Atlantic survey is conducted in 2019, no meeting takes place in year 2. A report, by corre-
 spondence, with the updated planning and manuals and the preliminary results of the 2019 survey, is pub-
 lished.
 Year 3 Reporting and finalizing of the results of the 2019 egg survey. Planning of the 2020 North Sea egg survey.

2 | ICES SCIENTIFIC REPORTS 3:11 | ICES

 2 Summary of Achievements of the Work Group dur-
 ing 3-year term

 • Planning, execution and reporting on the 2019 Atlantic mackerel and horse mackerel
 egg survey.
 • Total Annual Egg Production of western and southern mackerel and western and
 horse mackerel and SSB estimate of western and southern mackerel for the assessment
 of these stocks to WGWIDE.
 • Daily Egg Production and Daily Fecundity estimates of southern horse mackerel.
 • First Daily Egg Production and SSB estimates of NEA mackerel (southern and western
 components) for 2019
 • Planning of the 2021 (postponed from 2020) North Sea mackerel egg survey.
 • Report on the 2017 mackerel eggs survey in the North Sea.
 • Total Annual Egg Production and SSB estimate of North Sea mackerel for the assess-
 ment of this stock to WGWIDE.
 • Review results from egg staging and fecundity workshops as reported in the 2018
 WKFATHOM Report (ICES, 2018b).
 • Finalise historic Atlantic mackerel and horse mackerel egg dataset and uploading to
 the ICES Egg and Larvae database.
 • Publish updated manuals for execution of the mackerel and horse mackerel egg sur-
 veys: 1) Sampling at sea (ICES, 2019c; SISP 6) and 2) AEPM and DEPM fecundity esti-
 mation for mackerel and horse mackerel (ICES, 2019b; SISP 5)
 • Publish two papers on mackerel fecundity and spawning dynamics
 1. K. Ganias, D. Marmara, A. Solla, D. Garabana, R. Dominguez-Petit. 2018. Atlan-
 tic mackerel daily spawning dynamics and implications for batch fecundity es-
 timations. ICES Journal of Marine Science (Q1), 75(5): 1647-1654.
 doi: https://doi.org/10.1093/icesjms/fsy033.
 2. Charitonidou, K., Kjesbu, O.S., Dominguez-Petit, R., Garabana, D., Korta, M.A.,
 Santos, M., Damme, C.J.G. van, Thorsen, A., Gania, K. 2020: Contrasting post-
 ovulatory follicle production in fishes with different spawning dynamics. Fish-
 eries Research 231, https://www.sciencedirect.com/science/arti-
 cle/pii/S0165783620302277?via%3Dihub

ICES | WGMEGS 2020 | 3

 3 Final report on ToRs, workplan and Science Imple-
 mentation Plan

 3.1 Activities in 2018, 2019 and 2020
 WGMEGS met in Dublin, Ireland, in April 2018 to plan the ICES Triennial Mackerel and Horse
 Mackerel Egg Survey in 2019 (ICES 2018a). During the meeting during which Denmark indicated
 that they would participate and with Norway rejoining in the 2019 survey it looked like the sur-
 vey area could be covered without additional resources. Later in 2019, Denmark and Iceland had
 to withdraw their participations. Also, Germany had to charter Danish RV Dana in order to re-
 place their defunct vessel Walther Herwig III, which also truncated their available days at sea.
 Other participants had to fill in the resulting gaps in survey area coverage, and it became clear
 at the end of 2018 that the 2019 survey could not be executed with the preferred transect sam-
 pling, but would have to widely utilise the alternate transect sampling option.
 Two workshops in October and November 2018 on mackerel and horse mackerel egg staging
 and identification, and fecundity and atresia sampling and estimation were held in Bremerha-
 ven, Germany, and IJmuiden, The Netherlands, (ICES 2018b). The workshops standardised
 methods and analyses between survey participants and ensured training of new participants.
 During the workshops the manuals for sampling at sea (ICES, 2019c; SISP 6) and fecundity and
 atresia analyses (ICES, 2019b; SISP 5) were revised and updated.
 Details and results of the North Sea mackerel egg survey in 2017 were published in the 2018
 report (ICES, 2018a). The survey was coordinated by Cindy van Damme. Total annual egg pro-
 duction (TAEP) and SSB estimation were prepared for the attention of WGWIDE for information
 on the contribution of the North Sea stock component to total Northeast Atlantic mackerel.
 In June 2017 and 2018 exploratory mackerel egg surveys were carried out in Nordic waters in
 order to collect information on the northern and north-western extension of mackerel spawning.
 A working document was presented to WGMEGS in 2019 (ICES, 2019a) and was published in
 the 2018 WGWIDE report (ICES, 2018c) reporting on the results of both these surveys.
 The final planning of the egg survey was published in the 2019 WGMEGS report (ICES 2019a).
 The Triennial Mackerel and Horse Mackerel Egg Survey was carried out during February - July
 2019. Details on the survey were provided in the 2019 report. Updates with finalized results on
 mackerel fecundity are also delivered in this report. The survey was coordinated by Brendan
 O’Hea. Preliminary results of the TAEP of western and southern mackerel and western horse
 mackerel and SSB of western and southern mackerel were delivered to WGWIDE in 2019.
 Since 2004 due to requests for up-to-date data for the assessment, WGMEGS aims to provide a
 preliminary estimate of NEA mackerel biomass and western horse mackerel egg production in
 time for the assessment meetings within the same calendar year as the survey. Calculation of the
 preliminary results for WGWIDE necessitated a comprehensive work up of the data from the
 egg survey as well as the mackerel fecundity and atresia samples. Due to the very short
 timeframe between the survey completion and the submission of preliminary results only sam-
 ples from period 2 and 3 were available to calculate the potential fecundity. The same time con-
 straints meant that there was no current data available on the prevalence and intensity of atresia
 and the average of the historical atresia estimates between 2001 – 2016 was used to provide a
 preliminary estimate of realized fecundity. The subsequent comprehensive and full analysis of
 the fecundity samples from all periods has therefore resulted in a revised estimate and these
 finalised results are reported within this report.
4 | ICES SCIENTIFIC REPORTS 3:11 | ICES

 Methods for daily egg production adult parameters and SSB estimates were further developed
 during this term for Northeast Atlantic mackerel and horse mackerel and North Sea mackerel.
 Development of the methods was finalised through successful cooperation of members of this
 WG with the Working Group on Atlantic Fish Larvae and Egg Surveys (WGALES). The cooper-
 ation resulted in a publication on POF assessment (Charitonidou et al. 2020), which provides
 evidence that mackerel can have up to four different batches of POFs in the ovary, showing that
 the traditional way of POF ageing and spawning fraction estimation in mackerel is not appro-
 priate. WGMEGS will investigate the new method of spawning fraction estimation and assess
 the difference between the traditional (utilised for the DEPM results in this report and showing
 huge variability) and new way of spawning fraction estimation for mackerel.
 The increasing discrepancies between WGMEGS survey based estimation of mackerel SSB to
 results from the assessment but also other survey based mackerel stock indices lead the group to
 dedicate extensive work to challenge and investigate major assumptions and methods on which
 the estimation of the SSB index for mackerel are based. The work includes investigation on rep-
 resentativeness of spatial and temporal coverage of spawning activity, methods of daily and total
 egg production estimation, and on methods and assumptions for potential fecundity and atresia
 estimation. Part of this work is done in cooperation with the ICES Working Group on Improving
 the use of Survey Data for Assessment and Advice (WGISDAA, see their corresponding reports
 e.g. ICES 2018, ICES 2020). This work is still in progress and will carry on during the next
 WGMEGS term 2021-23.
 In 2020 the planning for the North Sea mackerel egg survey was conducted prior to and dis-
 cussed and finalized during the WGMEGS meeting. The survey was due to be executed in May
 and June 2020 with the participation of Denmark and The Netherlands. Cindy van Damme was
 appointed to coordinate the survey. However, due to the COVID19 pandemic, the survey had to
 be cancelled and has been postponed until 2021.

 3.2 Western and Southern egg survey in 2019
 3.2.1 Countries and Ship Participating
 The 2019 mackerel and horse mackerel egg survey was designed to cover the whole spawning
 area of the two species, within six sampling periods of differing geographical coverage (ICES
 2019b, SISP 6). Nine institutes from eight countries, Germany, Ireland, Netherlands, Scotland,
 Portugal, Spain (IEO), Spain (AZTI), Faroes, and Norway participated. The return of Norway
 was welcomed and provided additional coverage in the northern area compared to 2016. Survey
 dates, as well as vessel details, can be found below in table 3.2.1.1.
 In 2019 a total of eighteen individual surveys took place, totaling 343 days. Individual contribu-
 tions were Portugal (37 days), IEO (51 days), AZTI (33 days), Germany (29 days), Netherlands
 (37 days), Ireland (40 days), Scotland (82 days), Faroes (14 days) and Norway (20 days). This is a
 decrease in the number of survey days compared to 2016. The number of survey days are com-
 parable to 2013 (341 days) and 2010 (334 days).
ICES | WGMEGS 2020 | 5

 Table 3.2.1.1: Participating countries, vessels, areas covered, dates and sampling periods of the 2019 surveys

 Country Vessel Area Dates Period

 Portugal Noruega Portugal Jan 23rd – Feb 28th 2

 Ireland Celtic Explorer West of Ireland, Celtic sea, Biscay, February 8th – 28th 2

 Corystes West of Ireland, west of Scotland June 9th – 29th 6

 Scotland Scotia West of Scotland February 24th – Mar 2
 1st

 Altaire West of Scotland, west of Ireland March 19th – Apr 1st 3

 Altaire West of Scotland April 16th – 29th 4

 Scotia West of Scotland, west of Ireland May 8th – 30th 5

 Altaire West of Scotland, west of Ireland, Celtic sea, July 1st – 23rd 7
 Biscay

 Spain (IEO) Vizconde de Eza Cantabrian sea, Galicia, southern Biscay March 14th – April 5th 3

 Vizconde de Eza Cantabrian sea, Galicia, Biscay April 9th – May 4th 4

 Spain (AZTI) Ramon Margalef Northern Biscay March 19th – 30th 3

 Ramon Margalef Biscay, Cantabrian sea May 3rd - 25th 5

 Germany Dana Celtic sea, west of Ireland March 29th – April 3
 12th

 Dana Celtic sea, west of Ireland, west of Scotland April 15th – 30th 4

 Netherlands Tridens Northern Biscay, Celtic sea May 4th – 24th 5

 Tridens Biscay, Celtic sea June 5th – 23rd 6

 Norway Brennholm Faroes & Norway June 9th – 29th 6

 Faroes Magnus Heinason Faroes, Iceland May 23rd – June 5th 5

 3.2.2 Sampling Areas and Sampling Effort in the Western and South-
 ern Areas
 The survey was split into six sampling periods. The deployment of vessels to areas and periods
 is summarized in Table 3.2.1.1.
 Sampling in both the southern and western areas commenced in period 2 with Portugal sampling
 in ICES division 9a, and Ireland and Scotland surveying from the west of Scotland to mid-Biscay.
 Surveying in division 9a was only carried out in period 2. Period 3 saw the survey continue in
 the western area with surveying extended westwards into the Cantabrian Sea and Galicia, and
 continuing further north in Biscay, west of Ireland and west of Scotland. Sampling continued in
 all areas in period 4. In period 5 sampling was discontinued in Galicia, but continued from the
 eastern Cantabrian Sea northwards. From period 6 onwards, only the western area north of the
 Cantabrian Sea was covered.
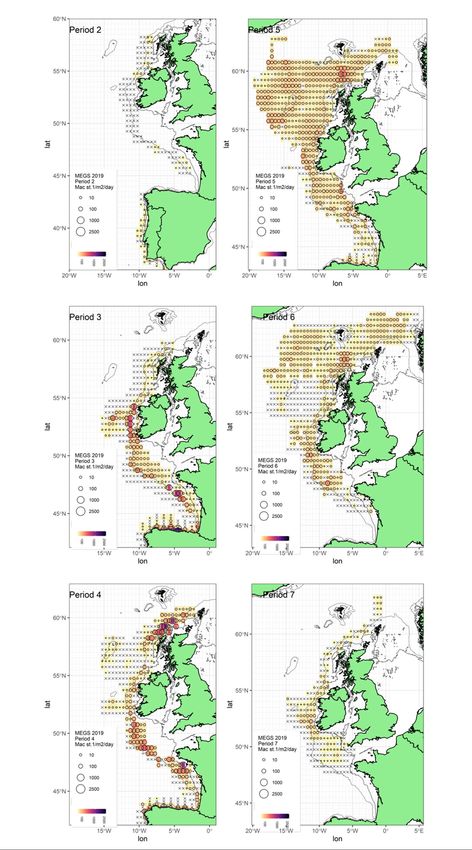
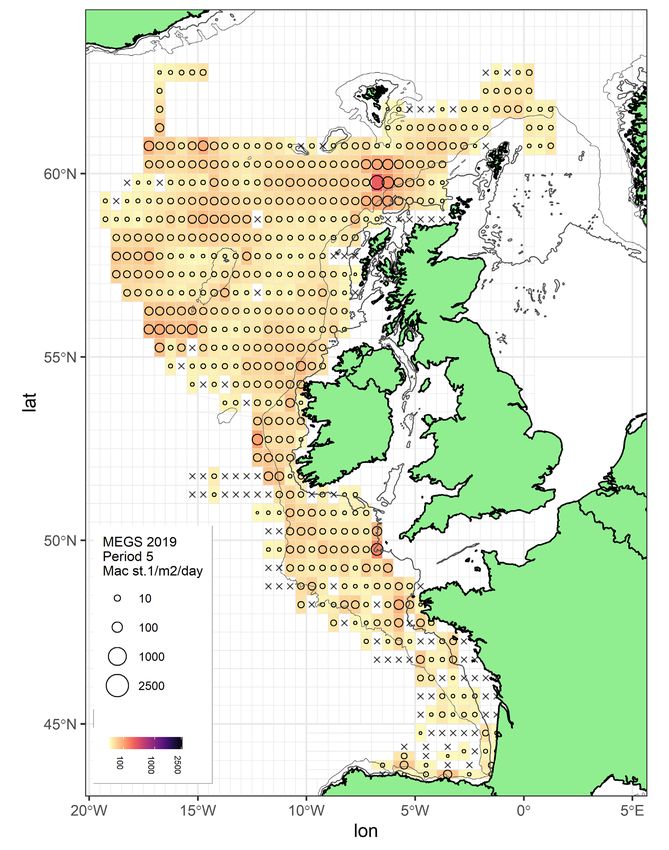
6 | ICES SCIENTIFIC REPORTS 3:11 | ICES

 Due to the expansion of the spawning area which has been observed since 2007 survey emphasis
 has been focused on full area coverage and delineation of the spawning boundaries. Cruise lead-
 ers have been asked to cover their entire assigned area using alternate transects and then use any
 remaining time to fill in the missed transects during the return leg.
 The planned and realized survey coverage by period is described in detail below (Figure 3.2.2.1):
 Period 2 – In period 2 Portugal carried out a DEPM survey in ICES Division 9a from Cadiz to
 Galicia, mainly targeting the southern horse mackerel stock. This survey is designed for this pur-
 pose but it provides mackerel egg and adult samples as well. Period 2 traditionally marks the
 start of the surveys in the western area. Since 2010 the commencement date of this period has
 been moving forward in time. The results of the 2010 and 2013 MEGS survey and the Winter
 2014/Spring 2015 industry surveys indicated that early spawning in the western area was set to
 continue. In 2016 however peak spawning took place in May / June. It was decided for 2019 that,
 despite the result from 2016, sampling in the western area should once again commence in early
 February. Sampling in this area was undertaken by Ireland (west of Scotland, west of Ireland,
 Celtic Sea and Biscay) and Scotland (northwest Ireland and west of Scotland).
 Poor weather was encountered in the western area at the start of the period however survey
 coverage was good. In the southern area Portugal sampled 531 stations with no interpolations.
 In the western area 115 stations were sampled, 20 were interpolated and there were 14 replicate
 samples.
 Period 3 – During period 3 Biscay, the Cantabrian Sea and Galicia were surveyed by Spain (IEO
 and AZTI). The German survey was delayed due to problems with their preferred vessel and the
 requirement to charter a replacement. The survey was conducted in the Celtic sea and west of
 Ireland. Scotland surveyed west of Scotland and northwest of Ireland.
 372 stations were sampled, 16 were interpolated and there were 39 replicate samples, the major-
 ity of which were completed in the Cantabrian Sea.
 Period 4 – This period was covered by three surveys. Scotland was operating to the west of Scot-
 land and northwest of Ireland on board a commercial vessel, Germany to the west of Ireland,
 Celtic Sea and northern Biscay. Spain (IEO) sampled southern Biscay, the Cantabrian Sea and
 Galicia.
 The most surprising fact from this period were the large numbers of eggs encountered by Scot-
 land to the north of the Hebrides. Scotland were successful in securing the northern boundary
 however.
 319 stations were sampled and 55 were interpolated. There were 53 replicate samples taken pri-
 marily from the Cantabrian Sea.
 Period 5 – Period 5 was covered by four surveys sampling the area from the Cantabrian Sea to
 the Faroes. AZTI carried out a targeted DEPM survey for anchovy in southern Biscay and Can-
 tabrian Sea and although it also provides mackerel and horse mackerel egg samples, the design
 of this survey means that it is constrained in that purpose. Netherlands surveyed northern Biscay
 and the Celtic Sea. Scotland sampled west of Ireland and Scotland as well as Rockall and Hatton
 Bank, while Faroes sampled from the north of Scotland to Faroes.
 Iceland had planned to participate in the 2019 survey and would have sampled during this pe-
 riod. Due to financial difficulties however they had to withdraw. Faroes agreed to modify its
 survey area and cover the entire northern section, sampling alternate transects. Faroes were also
 asked to extend their survey east of Faroes to monitor the stations where Scotland recorded large
 egg numbers in period 4. Egg numbers in that area were quite low in period 5. Due to poor
 weather at the end of their survey the Faroese were unable to close the northern boundary how-
 ever egg numbers in this area were low.
ICES | WGMEGS 2020 | 7

 Similar to 2016, and despite all the effort deployed in this period, the western and northern
 boundaries remained unsecured. This year however the numbers of eggs recorded on the bound-
 ary stations were much lower than in 2016.
 407 stations were sampled and 184 were interpolated. Sixteen replicate samples were collected.
 Period 6 – In this period Netherlands surveyed Biscay, north of 46°N, and the Celtic Sea, Ireland
 sampled to the west of Ireland and Scotland, and Norway sampled to the north of Scotland.
 Netherlands successfully delineated the southern boundary of spawning for this period.
 Once again there were issues securing boundaries to the West and the North, however boundary
 egg counts were not as high as in Period 5, or as high as those encountered in 2016.
 418 stations were sampled, with 210 interpolated and there were 6 replicate stations.
 Period 7 – This period was covered entirely by Scotland sampling mainly on alternate transects
 in the area from 47°45N in the South to the most northern transect on 63°15N. The southern
 boundary of sampling was delineated at 49°N and only very low levels of spawning were ob-
 served during this period. Due to the low numbers of eggs encountered it was possible to con-
 duct short transects with few stations straddling either side of the 200m contour line. Conse-
 quently Scotland was able to sample a number of stations to the north of Shetland to ensure
 spawning had concluded in this area.
 145 stations were sampled, 60 were interpolated and there was 1 replicate.
8 | ICES SCIENTIFIC REPORTS 3:11 | ICES

 Figure 3.2.2.1: Survey coverage by period. Grey stations were sampled while purple is interpolated.
ICES | WGMEGS 2020 | 9

 3.2.3 Sampling and Data Analysis
 The triennial mackerel egg survey aims to determine annual egg production using the mean
 daily egg production rates per predefined sampling periods for the complete spawning area of
 the Northeast Atlantic mackerel and horse mackerel. The 2019 egg survey was designed to reach
 a broad spatial and temporal coverage in each of the sampling periods. To achieve this, plankton
 hauls per half degree longitude were conducted on mostly alternating transects covering the
 complete spawning area. In core spawning areas, sampling was intensified and all transects were
 covered (Figure 3.2.2.1). Given the high variability of egg production by station this design en-
 sures the smallest chances of under- and overestimation of the egg production (comp. ICES
 2008).
 A total of 2310 plankton samples were collected and sorted. Mackerel, horse mackerel, hake and
 ling eggs were identified and the egg development stages determined. Depending on the vessel
 facilities and the experience of the participants this was done either during the cruise or back in
 the institute laboratories.
 Double micropipette samples and sections from 1416 ovaries of mackerel and horse mackerel
 were also taken on board. After finishing the individual surveys these samples were sent to six
 different European research institutes for the analysis and estimation of realized fecundity (po-
 tential fecundity minus atresia). For the mackerel atresia analysis only fish with atretic oocytes
 or spawning markers can be used. These markers can only be reliably detected histologically and
 these procedures and the resultant estimates are described in detail in section 3.4.3. WGMEGS
 decided that from the 2013 survey onwards, and in the period of peak of spawning, extra sam-
 pling effort would be dedicated to collect additional adult samples for the estimation of adult
 parameters to apply the DEPM.
 The analysis of the plankton samples as well as of the fecundity samples were carried out ac-
 cording to the sampling protocols as described in SISP 5 and SISP 6 (ICES, 2019b; ICES 2019c).
 Horse mackerel is believed to be an indeterminate spawner and therefore since 2007 IPMA has
 adopted the DEPM methodology for southern horse mackerel (ICES Division 9a). The egg survey
 design in the western horse mackerel is directed at the AEP method for mackerel which produces
 an estimate of SSB. Fecundity samples for horse mackerel were taken during the expected peak
 spawning period in survey in order to develop a modified DEPM approach for estimating the bio-
 mass of the horse mackerel stocks, however due to the low number of adult horse mackerel
 caught it was decided not to pursue this work.

 3.2.4 Sampling Strategy for Southern Horse Mackerel in ICES division
 9a
 The Portuguese (IPMA) 2019 DEPM survey directed at southern horse mackerel (PT-DEPM19-
 HOM) was carried out on board RV Noruega between the 23rd January and the 28th February
 (Period 2), as scheduled. It covered the area between Cape Trafalgar and Cape Finisterre (ICES
 division 9a), the survey plan having been totally achieved.
 Plankton surveying for obtaining egg density estimation and spawning area delimitation was
 conducted along transects perpendicular to the coast and spaced 12 nautical miles apart. The
 sampler used was a modified CalVET structure with a CTDF probe (paired nets with 40 cm di-
 ameter mouth aperture and 150 µm mesh size); plankton hauls (and CTDF casts) were conducted
 down to 200 m depth maximum, following a pre-defined grid of stations (every 3 or 6 nautical
 miles) along the transects. The plankton samples from each net were stored in separate contain-
 ers, one preserved in 4% buffered formaldehyde solution in distilled water (for laboratory eggs
 identification, staging and counting) and the other in 96% ethanol (for Trachurus spp. and
10 | ICES SCIENTIFIC REPORTS 3:11 | ICES

 Scomber spp. genetic analyses). Concurrently, CUFES samples (335 µm mesh size) were col-
 lected (every 3 nmiles) along the path between the vertical plankton tows, as an auxiliary sampler
 for adaptive area surveying. Also surface temperature, salinity and fluorescence data were rec-
 orded continuously using a probes associated to the water pumped by the CUFES sampler. Dur-
 ing the survey, a total of 531 CalVET and 723 CUFES samples were collected.
 Surveying for horse mackerel took place simultaneously with the ichthyoplankton sampling, 1-
 2 fishing hauls were performed opportunistically during the survey using bottom trawl gear. On
 the whole, 56 fishing hauls were obtained on board the research vessel, 20 hauls (37.5%) having
 been positive for horse mackerel. Sampling was complemented with fish from the bottom trawl
 and purse seine fleets at several harbours along the coast from the same period when the research
 vessel was surveying each area: a total of 15 samples were obtained at the harbours of Ma-
 tosinhos, Aveiro, Figueira da Foz, Peniche, Sesimbra, and Portimão/Olhão. For each trawl, com-
 plete biological sampling of a random sample of 60 fish was undertaken: individual biological
 information was recorded, a minimum of 30 ovaries per trawl were preserved in 4% buffered
 formaldehyde for histology and fecundity estimation, and otoliths were collected for ageing. Ex-
 tra effort was taken to obtain females with hydrated ovaries for the fecundity estimation (F), as
 well as to also collect fish of smaller sizes to obtain a maturity ogive.
 Mackerel sampling was also carried out whenever possible to support the estimations under-
 taken by WGMEGS, the biological data and sub-samples of the preserved ovaries having been
 sent to all partner institutes for the screening analysis and the fecundity calculations (Angelico
 et al. 2019).
 Details on the biological sampling, laboratory work and parameters calculation are described in
 the MEGS Manual for AEPM and DEPM fecundity (ICES 2019b).

 3.3 Hydrography 2019 report
 3.3.1 Southern Horse Mackerel DEPM Survey
 The hydrography and plankton surveying during IPMA’s days at sea took place between the
 25th January and the 25th February. Accordingly, the weather and hydrographic conditions en-
 countered were the typical for the winter time which can be shortly described by the maps in
 figure 3.3.1.1. Sea surface temperature varied from 12.5°C, in the northern shelf, to 17°C, in the
 eastern region of the southern coast. Water temperature in the whole western shelf was below
 14°C and in the more northern region a large patch of colder water (~12.5-13°C) was very evident
 occupying the whole platform from the Galician rias to Aveiro. This plume was also noticeable
 in the surface coastal salinity distribution reflecting the winter freshwater runoff contribution. In
 the same region associated to these nutrient rich waters, some spots of higher fluorescence were
 apparent, indicating local phytoplankton blooming. In the southern coast, the region over the
 continental shelf was occupied mainly by water with temperature between 14.5°C and 15.5°C;
 river runoff and peaks of chlorophyll were not evident. The CTD profiles (not shown) indicated
 a characteristic winter mixed water column, with only occasional saline stratification in the re-
 gions of high influence of water from continental origin.
ICES | WGMEGS 2020 | 11

 44 44 44

 43 43 36.6 43
 17
 0.97
 36.3
 16.5 0.89
 36
 42 42 42
 16 0.81
 35.7

 35.4 0.73
 15.5
 41 41 35.1 41 0.65
 15
 34.8 0.57

 14.5 0.49
 40 40 34.5
 40
 14 34.2 0.41

 33.9 0.33
 39 13.5
 39 39
 33.6 0.25
 13
 33.3 0.17
 38 12.5 38 33 38 0.09
 Temperature (ºC) Salinity Fluorescence (volts)

 37 37 37

 36 36 36

 -10 -9 -8 -7 -6 -10 -9 -8 -7 -6 -10 -9 -8 -7 -6

 Figure 3.3.1.1: Temperature (°C) (left panel), salinity (middle panel) and fluorescence (volt) (right panel) distributions
 using the data obtained by the sensors associated to the CUFES-EDAS system.

 3.3.2 Mackerel and Western Horse Mackerel Egg Survey
 The temperature values at 20 m depth are used in the calculation of the daily egg production for
 mackerel and horse mackerel. Horizontal distribution of those temperatures during all sampling
 periods are displayed in figure 3.3.2.1. Overall, temperatures at 20 m depth ranged from values
 < 8 °C to >17.5 °C and were very similar in their distribution to those observed during the 2016
 MEGS. Lowest temperatures were always observed in the North increasing towards the South
 and also with progression of the sampling periods. Temperatures were almost everywhere and
 all the time higher than the supposed threshold minimum value of 8 °C associated to an in-
 creased probability of mackerel egg occurrence.
12 | ICES SCIENTIFIC REPORTS 3:11 | ICES

 Figure 3.3.2.1: The 20 m depth temperature distribution for periods 2 – 4 (top row, left to right) and periods 5 – 7 (bottom
 row, left to right).

 3.4 Mackerel in the western and southern spawning areas: 2019
 egg survey results
 3.4.1 Spatial distribution of stage 1 mackerel eggs
 The description of the spatial distribution of stage 1 mackerel eggs is presented for both the
 southern and western areas together. The subsequent calculation of the egg production curve
 and biomass are considered separately for the two areas. An overview of mackerel spawning
 distribution of all periods for both the southern and western areas is presented in Figure 3.4.1.1.
 Period 2 – Portugal started the 2019 survey series on January 23rd. This DEPM survey is mainly
 targeting the southern horse mackerel stock and is designed for this purpose, but it provides
 mackerel egg samples as well. The survey is usually undertaken between Cadiz and the Galicia
 (ICES division 9.a) and few mackerel eggs were found. Period 2 also marks the commencement
 of the western area surveys. In the west MEGS once again started sampling earlier in February
 than would have been the case prior to the 2010 and 2013 surveys. Sampling was undertaken by
 Ireland (West of Scotland, west of Ireland, Celtic Sea, Biscay), and Scotland (West of Ireland and
 West of Scotland) (Fig. 3.4.1.2). Similar to 2016 however, and in marked contrast to 2010 and
 2013, no sign of spawning was found during this period in the Celtic Sea or Bay of Biscay. Instead
 very low levels of spawning were found north of 54.5°N by both the Scottish and Irish surveys.
 In 2019 the start of mackerel spawning in the western area was captured. The eggs that were
 collected were close to the 200m contour line.
 Period 3 – In period 3 the German vessel operated to the West of Ireland and Celtic Sea. North-
 west Ireland and the West of Scotland was covered by Scotland. The Bay of Biscay, Cantabrian
 Sea and Galicia were covered by Spain (IEO and AZTI). In contrast to 2016 large numbers of eggs
 were found in the Cantabrian Sea. High egg numbers were found close to the 200m contour in
 Biscay and to the west of Ireland. Low numbers were recorded northwest of Ireland and west of
 Scotland. All boundaries were successfully delineated (Fig. 3.4.1.3).
 Period 4 – In period 4 sampling in the western area was carried out by IEO, Germany and Scot-
 land, with the area covered running from Galicia in the south to Shetland in the north (Fig.
 3.4.1.4). Egg numbers in the Cantabrian Sea were still quite high, again much higher than in 2016.
 Egg numbers were moderate to high in Biscay and the Celtic sea, with low numbers recorded
ICES | WGMEGS 2020 | 13

 west of Ireland. Again all spawning occurred close to the 200m contour. Egg numbers around
 Rockall were very low, but large numbers of eggs were found following the 200m contour from
 the Hebrides north to Shetland. The Scottish survey was able to close this northern boundary
 however. Once again all boundaries were successfully delineated.
 Period 5 –In period 5 four countries surveyed the area. AZTI conducted their DEPM survey in
 southern Biscay and the Cantabrian Sea targeting sardines and anchovies. Netherlands sampled
 the Celtic sea and northern Biscay, with Scotland surveying west of Ireland and west of Scotland
 as well as Rockall and Hatton Banks. Faroes and Iceland had been scheduled to survey north of
 this, however unfortunately Iceland had to withdraw from the survey. Faroes agreed to cover
 the whole area and also surveyed the area east of Faroes where large egg numbers were found
 by Scotland in period 4 (Fig. 3.4.1.5). Low egg numbers were found in the Cantabrian Sea and
 Biscay. Elsewhere within period 5 spawning activity was very widely dispersed with Scotland
 and Faroes encountering mackerel eggs spread over a large area in northern waters. Northern
 and north-western boundaries were not delineated during this period, however egg numbers
 encountered at the boundary stations were much lower than those found in 2016.
 Period 6 –This period was covered by Ireland, Netherlands and Norway (Fig. 3.4.1.6). Nether-
 lands delineated the spawning boundary in the south at 48°N. Issues continued with eggs on the
 boundaries in the northwest but egg numbers in this area were very low, again much lower than
 in 2016. Norway successfully delineated the northern boundary to the north of Faroes. Norway
 also found low numbers of eggs to the north of Shetland, as far as 64°N.
 Period 7 –Period 7 was surveyed entirely by Scotland, sampling on alternate transects, from
 47°45N in the South to the most northerly station at 63°15N (Fig. 3.4.1.7). The southern boundary
 was delineated at 49°N and only very low levels of spawning were observed during this period,
 mainly to the west of Ireland with very little reported for the Celtic Sea. Due to the low numbers
 of eggs encountered the Scottish survey was able to travel northwards quite quickly and as a
 result were able to sample some stations north of Shetland, where very few eggs were found.
 Similar to the 2016 survey all boundaries were delineated.
14 | ICES SCIENTIFIC REPORTS 3:11 | ICES

 Figure 3.4.1.1: Mackerel egg production by half rectangle for all periods. Circle areas and colour scale represent mackerel
 stage I eggs/m2/day by half rectangle. Crosses represent zero values.
ICES | WGMEGS 2020 | 15

 Figure 3.4.1.2: Mackerel egg production by half rectangle for period 2 (Feb 5th – Mar 3rd). Circle areas and colour scale
 represent mackerel stage I eggs/m2/day by half rectangle. Crosses represent zero values.
16 | ICES SCIENTIFIC REPORTS 3:11 | ICES

 Figure 3.4.1.3: Mackerel egg production by half rectangle for period 3 (Mar 4th – Apr 12th). Circle areas and colour scale
 represent mackerel stage I eggs/m2/day by half rectangle. Crosses represent zero values.
ICES | WGMEGS 2020 | 17

 Figure 3.4.1.4: Mackerel egg production by half rectangle for period 4 (Apr 13th – May 3rd). Circle areas and colour scale
 represent mackerel stage I eggs/m2/day by half rectangle. Crosses represent zero values.
18 | ICES SCIENTIFIC REPORTS 3:11 | ICES

 Figure 3.4.1.5: Mackerel egg production by half rectangle for period 5 (May 4th – June 5th). Circle areas and colour scale
 represent mackerel stage I eggs/m2/day by half rectangle. Crosses represent zero values.
ICES | WGMEGS 2020 | 19

 Figure 3.4.1.6: Mackerel egg production by half rectangle for period 6 (June 6th – 30th). Circle areas and colour scale rep-
 resent mackerel stage I eggs/m2/day by half rectangle. Crosses represent zero values.
20 | ICES SCIENTIFIC REPORTS 3:11 | ICES

 Figure 3.4.1.7: Mackerel egg production by half rectangle for period 7 (July 1st – 31st). Circle areas and colour scale rep-
 resent mackerel stage I eggs/m2/day by half rectangle. Crosses represent zero values.
ICES | WGMEGS 2020 | 21

 3.4.2 Egg production in Northeast Atlantic mackerel
 3.4.2.1 Stage I egg production in the western area

 2010 provided an unusually large spawning event early in the spawning season, while 2013
 yielded an even larger spawning event indicating that spawning was probably taking place well
 before the nominal start date of 10th February (day 42). In 2016 the first survey commenced on
 February 5th which is five days prior to the nominal start date. That year, however, mackerel
 migration was later and slower than that recorded in the previous two surveys. The pattern in
 2019 followed that of 2016 with no early peak spawning being recorded (Fig. 3.4.2.1.1 & Table
 3.4.2.1.1). In 2019, however, peak spawning was found to have occurred in period 4, rather than
 period 5 as was the case in 2016 (Figure 3.4.2.1.2). Unlike 2016 when concern was expressed that
 survey coverage may have underestimated the total egg production estimate, area coverage in
 2019 was much better. The expansion observed in western and north-western areas during peri-
 ods 5 and 6 in 2016 was once again observed during 2019, however egg numbers were not as
 large as in 2016. During period 5, the northern and north-western boundaries were once again
 not delineated, however the exploratory egg surveys carried out in this region during both 2017
 and 2018 provide robust evidence that while some spawning has been missed the loss of egg
 abundance is not sufficiently large to significantly impact the SSB estimate (ICES, 2019a)
 The nominal end of spawning date of the 31st July is the same as was used during previous
 survey years and the shape of the egg production curve for 2019 does not suggest that the chosen
 end date needs to be altered. The total annual egg production (TAEP) for the western area in
 2019 was calculated as 1.22 * 1015 (Table 3.4.2.1.1). This is a 20% reduction on the 2016 TAEP
 estimate which was 1.55 * 1015.

 Figure 3.4.2.1.1: Annual egg production curve for mackerel in the western spawning component. The curves for 2007,
 2010 2013 and 2016 are included for comparison. Months of January, March, May and July are highlighted in grey back-
 ground

 Table 3.4.2.1.1: Western estimate of mackerel total stage I egg production by period using the histogram method for
 2019
22 | ICES SCIENTIFIC REPORTS 3:11 | ICES

 Dates Period Days Annual stage I egg production * 10 15

 Pre 2 0
 Feb 11th – Mar 1st 2 25 0.0007

 Mar 2nd – 18th 2-3 17 0.09

 Mar 19st – April 12th 3 25 0.28

 Apr 13th – 14th 3-4 2 0.03

 Apr 15th – April 30th 4 16 0.28

 May 1st – 3rd 4-5 3 0.05

 May 4th – May 31st 5 28 0.32

 Jun 1st – 5th 5-6 5 0.04

 Jun 6th – June 28th 6 23 0.11

 June 29th – July 1st 6–7 3 0.008

 July 2nd – July 22nd 7 21 0.01

 July 20th – July 31st Post 7 12 0.004

 Total 1.22

 CV 20%

 Variance 6.09*e28

 Data CV 2.22
ICES | WGMEGS 2020 | 23

 Figure 3.4.2.1.2: Egg production by period for mackerel in the western spawning component. Months of January, March,
 May and July are highlighted in grey background

 3.4.2.2 Stage I egg production in the southern area

 The start date for spawning in the southern area was the 23rd January (Table 3.4.2.2.1). The start
 date of the Portuguese period 1 survey in division 9.a was delayed by around 1 week. As a result,
 the survey dates aligned more closely to period 2. It was subsequently reclassified within period
 2 and survey period 1 was removed. Sampling in the Cantabrian Sea where most of the spawning
 occurs within the Southern area commenced 6 days later than in 2016 on the 14th March. The
 same end of spawning date of the 17th July was used again this year and the spawning curve
 suggests that there is no reason for this to change (Fig. 3.4.2.2.1). As in 2013 the survey periods
 were not completely contiguous, and this has been accounted for (Figure 3.4.2.2.2 &Table
 3.4.2.2.1). The provisional total annual egg production (TAEP) for the southern area in 2019 was
 14
 calculated as 4.23 * 10 (Table 4.3.2.1). This is an 88% increase on the 2016 TAEP estimate which
 was only 2.25 * 1014.
24 | ICES SCIENTIFIC REPORTS 3:11 | ICES

 Figure 3.4.2.2.1: Annual egg production curve for mackerel in the southern spawning component. The curves for 2007,
 2010, 2013 and 2016 are included for comparison. Months of January, March, May and July are highlighted in grey back-
 ground.

 Table 3.4.2.2.1: Southern estimate of mackerel total stage I egg production by period using the histogram method for
 2019.

 Dates Period Days Annual stage I egg production x 10 14

 1 No sampling

 Jan 23rd – Feb 26th 2 35 0

 Feb 27th –Mar 13th 2-3 15 0.86

 March 14th – April 5th 3 23 2.23

 April 6th – April 9th 3-4 4 0.26

 April 10th – May 3rd 4 24 0.79

 May 4th – May 8th 5 5 0.01

 May 9th –July 17th Post 5 71 0.07

 Total 4.23

 CV 99%

 Variance 1.72*e29
 Data CV 1.97
ICES | WGMEGS 2020 | 25

 Figure 3.4.2.2.2: Egg production by period for mackerel in the southern spawning component. Months of January, March,
 May and July are highlighted in grey background

 3.4.2.3 Total Egg production

 While NEA mackerel total annual eggs production (TAEP) in the western component was rec-
 orded at the historically lowest level in the time series since 1992, the southern component’s TAEP
 value was the fourth highest within the same time frame (Figure 3.4.2.3.1). TAEP for both the west-
 15
 ern and southern components combined in 2019 is 1.64 * 10 . This is a decrease in egg production
 by 7.6% compared to the 2016 TAEP and is the second lowest value in the time series since 1992
 (Figure 3.4.2.3.2 and Table 3.4.4.1).

 Figure 3.4.2.3.1: Annual Egg Production estimates for both southern (left) and western (right) components. 1992-2019
26 | ICES SCIENTIFIC REPORTS 3:11 | ICES

 Figure 3.4.2.3.2: Combined mackerel Total Annual Egg Production estimates. 1992-2019

 3.4.3 Fecundity of Northeast Atlantic mackerel
 3.4.3.1 Adult sampling

 During the 2019 survey 4604 adult mackerel were collected from 72 trawl hauls between 36.91°N
 and 62.77°N during periods 2–7. The results presented in this section refer to only females. All
 together 1391 ovary samples (Figure 3.4.3.1.1-A) were used for AEPM (annual egg production
 method) and DEPM (daily egg production method). Only 63% of the samples planned were col-
 lected (Table 3.4.3.1.1). Deviation from the initial plan was observed in all periods; the inter-
 annual variability in the mackerel migration as well as the probability of successful fishing effort
 makes it difficult to fit to the original sampling scheme.

 Figure 3.4.3.1.1: A: Mackerel ovary samples collected in 2019 for AEPM and DEPM by period. B: Mackerel ovary samples
 that were used for fecundity counting by period.
ICES | WGMEGS 2020 | 27

 Table 3.4.3.1.1: Summary of fishing effort and number of mackerel samples collected for AEPM and DEPM during the
 2019 survey. Positive and negative hauls show the number of hauls where mackerel was present or absent, respec-
 tively. Number of collected and planned ovary samples are shown both in numbers and as percentage (number of
 collected samples compared to planned).

 Period 2 3 4 5 6 7 Total

 Positive hauls 12 26 8 14 10 2 72
 Negative hauls 44 12 3 3 4 4 70

 Ovary samples 57 703 233 156 154 47 1391

 Planned 200 990 1260 225 175 100 2950

 Percentage (%) 28.5 71.0 18.5 69.3 88.0 47.0 47.2

 3.4.3.2 Histological screening

 From the 1391 ovary samples, a total of 1364 samples were screened by histology and classified
 as described in the manual (ICES, 2019b; for DEPM samples see DEPM section). 1353 were valid
 for further analysing. The remaining samples were not analysed because of various technical
 issues. From the 1353 samples analysed (Figure 3.4.3.1.2), 8 % were assigned to stage 2 (early
 vitellogenic oocytes), 9 % to stage 3 (vitellogenic oocytes), 43% to stage 4 (migratory nucleus
 stage), 32% to stage 5 (hydrated oocytes), 7% to stage 1 (previtellogenic oocytes). In total only 6%
 of the females (Figure 3.4.3.1.1-B) were classified as pre-spawning or close to spawning (i.e. sam-
 ples could be used for potential fecundity analyses), and 66 % of the females were classified as
 spawning. Spawning females were only used for analyses of atresia.
 Migratory nucleus (4) and hydrated stages (5) were the most abundant stages in periods 3 to 6,
 reaching the highest values in periods 3 and 4. Stage 1 increased significantly in period 6 (Figure
 3.4.3.2.1).

 Figure 3.4.3.2.1: Number of observations of the most advanced oocyte stage by survey periods. Stage 1 = pre-vitellogenic
 oocytes; 2 = early vitellogenic oocytes (
28 | ICES SCIENTIFIC REPORTS 3:11 | ICES

 From the histological screening, a total of 78 samples qualified for potential fecundity analysis,
 which represent ~6% of the total samples screened by histology (N = 1353). After the whole
 mount screening, this number decreased to 65 samples. Samples were discarded by whole mount
 screening because of detection of immature ovaries, presence of hydrated oocytes, or spent con-
 dition. The number of samples used to estimate fecundity decreased again to 62, since 3 samples
 had an oocyte leading cohort diameter smaller than 400 µm. According to the manual (ICES
 2019b, SISP 5), ovaries with a leading cohort smaller than 400 µm are considered as not fully
 recruited yet; not all oocytes that are going to be spawned may have reached the 185 µm thresh-
 old that is used to classify oocytes as maturing.

 POF´s (Post Ovulatory Follicles) are important spawning markers and were found in 72% of the
 samples (Figure 3.4.3.1.2). For all periods except period 2, when the frequency of samples with
 POF´s was slightly lower than without, females with POF´s were more than twice as frequent as
 females without.

 Figure 3.4.3.1.2: Frequency of POF’s presence throughout the survey periods (0 = no POF’s; 1 = POF’s present).

 3.4.3.3 Potential Fecundity in the Western and Southern combined components

 For all mackerel females collected we did an initial check (Figure 3.4.3.3.1 a-b and Figure 3.4.3.3.2
 a-b) on the distribution of fish length, weight, Fulton’s condition factor (100 × weight/length3),
 and gonad-somatic index (GSI; 100 × Ovary weight/Fish weight). Similarly, we analysed sepa-
 rately the samples qualified for potential fecundity estimation (Figure 3.4.3.3.1 c-d and Figure
 3.4.3.3.2 c-d).
ICES | WGMEGS 2020 | 29

 Figure 3.4.3.3.1: Frequency histograms of a) Fish length and c) Fish weight from all mackerel females sampled in 2019
 and b) Fish length and d) Fish weight for mackerel assigned for potential fecundity analysis. Curves demonstrate the
 interpreted data distribution.

 Similar to the previous surveys only fish with condition factor between 0.5 and 1.2, and GSI
 between 1 and 25 were included (ICES 2014) in the fecundity and atresia estimates (Figure
 3.4.3.3.2). In 2019, no females needed to be excluded from the analysis based on these biological
 parameters.
 Relative potential fecundity in 2019 ranged from 324 to 2098 oocytes/g fish, with a median value
 of 1191 oocytes/g fish (Figure 3.4.3.3.3). In the years before 2013, values below 300 and above
 2100 were excluded. Since the 2013 survey (ICES 2014) it was agreed not to delete them, but
 instead replace the use of arithmetic mean by median. The median is considered to be more ro-
 bust. In 2019, this issue was discussed again and we agreed to test a trimmed mean as an alter-
 native to the median. We analysed the time-series (Figure 3.4.3.3.4) and found that the median
 estimates were close to the mean and trimmed mean estimates. For consistency with previous
 years we continue using the median. To assure that we in the future are consistent in the way we
 statistically treat the AEPM data and calculate realised fecundity, the working group in 2020
 made a detailed calculation manual complete with corresponding STATA and R-code. Both
 STATA and R are being used for the calculations. This manual is planned to be appended to the
 current manual for the fecundity work after being reviewed during the next fecundity workshop.
You can also read