Identification of Potential Barriers to Electric Vehicle Adoption in Oil-Producing Nations-The Case of Saudi Arabia - MDPI
←
→
Page content transcription
If your browser does not render page correctly, please read the page content below

Review
Identification of Potential Barriers to Electric Vehicle Adoption
in Oil-Producing Nations—The Case of Saudi Arabia
Saleh Alotaibi * , Siddig Omer                    and Yuehong Su

                                           Faculty of Engineering, The University of Nottingham, Nottingham NG7 2RD, UK
                                           * Correspondence: saleh.alotaibi@nottingham.ac.uk

                                           Abstract: Electric vehicles (EVs) are important elements in the global strategy to tackle climate change;
                                           however, research often fails to sufficiently identify the range of barriers which affect their adoption.
                                           Taking Saudi Arabia as a case study, this paper analyses responses from 698 potential drivers in
                                           order to identify and rank the infrastructure, performance, financial, social, and policy barriers to EV
                                           adoption in a major oil-producing nation with a hot climate and a desert terrain. According to this
                                           study’s findings, the most important barriers in this context are the lack of charging infrastructure
                                           and the additional load placed on the national grid, while others include the safety and effectiveness
                                           of batteries at high temperatures, and the ability of EVs to perform in desert conditions. Common
                                           themes also include concerns that EVs may damage Saudi’s oil-based economy, cost of purchase and
                                           maintenance, low resale value, and the absence of awareness about EVs. The study concludes that EV
                                           manufacturers must demonstrate that their vehicles are suitable for the Saudi climate. Governments
                                           should also provide subsidies, or other incentives, to promote adoption of EVs as the study also found
                                           that variations in the cost of different EV models in Saudi Arabia, for example, the Tesla Model 3, is
                                           up to 40% more expensive to own than a Toyota Camry, mean that owning EVs can cost significantly
Citation: Alotaibi, S.; Omer, S.; Su, Y.
                                           more than small sized internal combustion engine-based vehicles (ICEVs). This paper identifies and
Identification of Potential Barriers to    ranks the barriers to EV ownership in a desert nation which is a leading petroleum producer and
Electric Vehicle Adoption in               compares the relative costs of EVs and ICEVs in the country. As such, it has immediate relevance in
Oil-Producing Nations—The Case of          countries with similar economic, geographic, and climatic conditions.
Saudi Arabia. Electricity 2022, 3,
365–395. https://doi.org/10.3390/          Keywords: electric vehicles; sustainable transportation; EV adoption; vehicle-to-grid; ownership cost;
electricity3030020                         barriers of EVs; questionnaire; Saudi Arabia
Academic Editors: Gabriele Grandi,
Riccardo Mandrioli and Hugo
Morais
                                           1. Introduction
Received: 9 June 2022
                                                 The principal cause of global warming is recognized as greenhouse gas (GHG) emis-
Accepted: 8 August 2022
Published: 12 August 2022
                                           sions, predominantly from burning fossil fuels [1]. In 2019, over a quarter of the EU’s GHG
                                           emissions were caused by transportation [2]. As the transportation sector is responsible for
Publisher’s Note: MDPI stays neutral       a considerable proportion of these emissions, sustainable transportation must be a part of
with regard to jurisdictional claims in    any climate change mitigation strategy. Electric vehicles (EVs) are widely considered to be
published maps and institutional affil-
                                           more environmentally and economically efficient than internal combustion engine-based
iations.
                                           vehicles (ICEVs), and as the technology matures and availability increases [3], governments
                                           around the world are beginning to phase out ICEVs and promote EV adoption; for example,
                                           the UK has recently legislated to end the sale of new petrol and diesel cars by 2030 [4].
Copyright: © 2022 by the authors.
                                           However, while research to date has addressed the modelling, evaluation, or presentation
Licensee MDPI, Basel, Switzerland.
                                           of new EV methods or technologies, the end-user’s perspective has largely been ignored [5],
This article is an open access article
                                           despite the fact that the widespread adoption of EVs will depend on meeting consumers’
distributed under the terms and            economic, social, and environmental demands.
conditions of the Creative Commons               This study foregrounds potential end-users’ requirements in respect of EVs and identi-
Attribution (CC BY) license (https://      fies the key technical, social, financial, infrastructure, and policy barriers to their widespread
creativecommons.org/licenses/by/           adoption, using Saudi Arabia as a case study, since, according to Chidambaram [6], limited
4.0/).                                     adoption of EVs in developing countries is a matter of concern. In doing so, it builds on

Electricity 2022, 3, 365–395. https://doi.org/10.3390/electricity3030020                                  https://www.mdpi.com/journal/electricity
Electricity 2022, 3                                                                                                  366

                      a previous paper which explored ICEV drivers’ perceptions of EVs and the factors they
                      found most attractive [7], with particular reference to the Saudi context. The Kingdom of
                      Saudi Arabia (KSA) presents an interesting context within which to examine end-users’
                      perceptions of EVs and the barriers to their widespread adoption. The country has long
                      been a major producer of oil, but it now has ambitious plans to reduce its GHG emissions,
                      with the aim of achieving net-zero by 2060 [8]. This will require much greater use of public
                      transport and the widespread adoption of EVs [9,10], and the country aims to become
                      a regional hub for EV manufacturing [11]. However, EVs are currently unavailable for
                      purchase in the Kingdom, although they can be imported, and there has been scant research
                      into how end-users perceive them, or the challenges to their widespread adoption. The
                      need for such research has recently become more pressing. In May 2022, Lucid Motors, a
                      US EV manufacturer, announced that it will begin constructing manufacturing facilities in
                      the Kingdom, with a capacity of 155,000 electric vehicles [12]. As part of the deal involves
                      the Saudi government committing to purchase 100,000 vehicles over a ten-year period,
                      there is an increasingly urgent need to understand how potential users in the country
                      view EVs and the nature of the barriers to their widespread adoption. In exploring these
                      issues and identifying both general barriers (applicable in most contexts) and local barriers
                      (applicable in similar cultural and geographical contexts), this study will inform the devel-
                      opment of public policy to encourage drivers to adopt EVs, thereby serving the strategic
                      imperatives of sustainable transport and development and promoting the related social
                      and environmental values.
                           In order to achieve this aim, the paper addresses the following research questions to
                      explore the relationship between potential users’ perceptions of EVs and the barriers to
                      their widespread adoption:
                      RQ1: What are the salient characteristics of EVs and what is their potential for strengthening
                      EV acceptance?
                      RQ2: To what extent are EVs perceived as economically, socially, and environmentally
                      beneficial compared to ICEVs in Saudi Arabia?
                      RQ3: What are the main barriers to widespread EV adoption, which ones are regarded as most
                      significant by potential users, and are they nationally, regionally, or internationally applicable?

                      2. Literature Review
                           Electric vehicles can be up to four times more energy efficient than those with internal
                      combustion engines [13]. Therefore, EVs are considered a more sustainable alternative
                      to ICEVs for future mobility needs, and countries are starting to invest more heavily in
                      their manufacture, notably China, the global leader in car production [14]. However, even
                      the most advanced current EV technologies have many limitations, including limited
                      ranges, long recharging times, short lifespans of components, high costs, and some safety
                      concerns, and these issues must be addressed if EVs are to be widely accepted. In addition,
                      although EVs have a strong potential for reductions in transportation-related carbon dioxide
                      (CO2 ) emissions, which is estimated at 17–34% of those from ICEVs [15,16], Malmgren [5]
                      warns that people sometimes misunderstand the benefits of EV usage and that currently
                      there are inadequate cost–benefit analyses. This paper therefore begins by reviewing
                      published papers, policy statements, and other research to identify the key elements
                      associated with EVs and whether they act as incentives or barriers to widespread EV
                      adoption. These include charging infrastructure, available energy and grid resources,
                      national transport strategies, geographical considerations, and economic forces (at the
                      national level), energy management systems, batteries, and autonomous features (at the
                      vehicle level) [17], maintenance costs and fuel savings (at the individual level), and wider
                      social benefits related to development, the environment, health, and national security.

                      2.1. Key Factors Associated with EVs
                          There have been many studies of the factors influencing potential EV users and the
                      importance of taking their views into consideration. For example, according to Funke [18]
Electricity 2022, 3                                                                                              367

                      the share of electric taxi fleets in Karlsruhe, Germany, could increase by up to 45% if taxi
                      users’ perspectives were considered. Meanwhile [19] suggests that knowing customers’
                      needs and segmenting buyers by range requirements is critical, rather than presuming that
                      all drivers need currently expensive large batteries. In terms of adoption, [20] concludes
                      that EVs are more attractive to consumers with high annual mileage in Germany, while [21]
                      finds that the high purchase price and high battery costs are the most important factors
                      affecting EV adoption in China. However, Singh [22] concludes that policymaking is the
                      most influential factor in terms of influencing the rate of EV adoption since it can directly
                      affect customers’ intentions to purchase an EV. In regions, such as Japan and California, US,
                      for example, long-term government subsidies encourage drivers to switch to EVs [23], and
                      many studies have found that the development of EV infrastructure enhances acceptance
                      of EVs, something which requires policy support [22,24]. Such factors are expected to
                      influence the perceptions of potential EV users in Saudi Arabia and other petroleum
                      producing states, and these are discussed in more detail below.

                      2.1.1. Charging Infrastructure
                            Charging infrastructure is a key issue in relation to EV adoption, and Tie [25] recom-
                      mends the building of a comprehensive nationwide charging infrastructure to precede the
                      introduction of EVs. This is a particular issue in the context of Saudi Arabia, a relatively
                      large country (at over 2,000,000 km2 ) [26] with a desert climate. The long distances between
                      cities and the heavy use of air-conditioning drains batteries more quickly, and Saudi drivers
                      report feeling ‘range anxiety’ [27], so charging stations are needed on all main roads. An
                      optimal solution would be the formation of isolated microgrids supplied by renewable
                      energy, with diesel backup [27].

                      Charging Stations
                            Numerous studies have found that a lack of infrastructure has a direct impact on
                      consumers’ intentions to purchase an EV [22,28,29]; this not only affects market sales, but it
                      has also risen to the top of the list of arguments against the spread of EVs [30]. Research
                      indicates that an increase in public charging infrastructure development leads to an increase
                      in EV sales; however, in the early stages of the EV market, private charging options, such
                      as home or workplace charging, have also proven to be significant [31]. Moreover, lower
                      total expenses associated with household charging unit installation and vehicle operation
                      would significantly enhance customer behaviour towards and perceptions of EVs [6].

                      Repair and Maintenance Workshops
                           According to [32] the absence of EV repair centres and workshops compared to those
                      for ICEVs has disappointed current EV owners. For example, a study in Denmark [33]
                      found that the fact that EV technology is still new means that relatively few workers are
                      qualified and trained to fix EVs, so even simple repairs are costly and more complex repairs
                      may take several months.

                      Effect on the Electricity Grid
                           EVs consume a high amount of real power in a short period of time due to the non-
                      linear nature of their loads, and this can cause instability in the power networks [34].
                      Overloading of charging may also affect aspects of the grid and distribution network,
                      depending on driving and charging behaviour, so EVs can have a significant impact on the
                      power network’s load curve [35]. The KSA generates an estimated 362 TWh of electricity,
                      mainly from crude oil and natural gas, [36]; however, demand can exceed supply in the hot
                      summer months, and the widespread adoption of EVs will place additional burdens on an
                      overstretched grid. In addition, as less than 1% of electricity comes from renewable energy
                      resources [36], this may also increase GHG emissions unless steps are taken to further
                      develop renewable electricity production.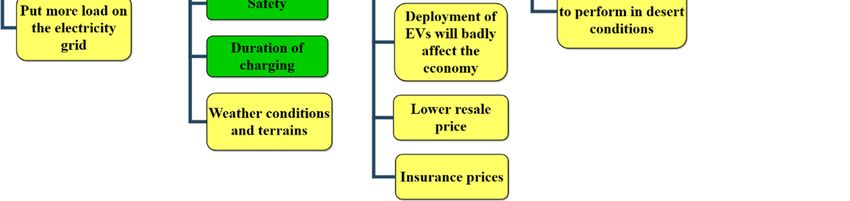
Electricity 2022, 3                                                                                            368

                      2.1.2. Vehicle to Grid Technology
                           Storage of energy is also an issue for EV adoption; however, the increasing global
                      uptake of EVs facilitated by technological advances, such as cheaper batteries, has initiated
                      new business models to exploit the potential of EVs for electric storage. V2G technology is
                      one such development, and it enables EVs to be charged and to return stored electricity to
                      the grid through a connection to a domestic, commercial, or public charging station [37].
                      Vehicle batteries are charged at a low tariff when demand on the grid is low and excess
                      unused power is available, then partially discharged at a higher tariff during peak de-
                      mand, when the grid is short of supply, allowing owners to make a profit [38]. V2G thus
                      offers cheap, flexible, and fast-responding storage [39] and also incentivizes EV owners to
                      participate in charge/discharge systems.
                           According to Weiller and Neely [40], V2G has both short- and long-term potential
                      benefits. The former includes residential applications, such as vehicle-to-home for smart
                      home systems, and it is significant to note that Tesla has promoted its EVs as central to
                      the ‘self-powered home’, in which they are integrated with solar panels and a so-called
                      Powerwall [41]. The long-term benefits include potential reductions in GHG emissions
                      (around 13,429 kg CO2 per year with self-sufficiency of 99.1% and net metering) and
                      reduce per-unit electricity prices by up to 12% [42]. In addition, as Tesla’s move suggests,
                      continued technological innovation and development of V2G systems, alongside shorter
                      battery response times, will potentially be enhanced by integration with solar photovoltaics,
                      among other options [43].
                           The development of this technology is currently constrained by inadequate infrastruc-
                      ture, battery degradation, and low consumer awareness. For example, grid-scale uses of
                      EV batteries for storage and V2G applications are unlikely to be deployed in the short-term
                      because EV adoption rates do not yet justify new control architectures being implemented.
                      However, studies of consumer acceptance of V2G have identified key institutional and
                      policy factors as including incentives to EV consumers, such as direct subsidies, emission-
                      based taxes, provision of charging infrastructure, and free parking. Developments in
                      battery capacity, driving range, and in the purchase price of EVs are discussed below.

                      2.1.3. EV Batteries
                             Lithium ion batteries (LIBs) are used for EVs and grid storage applications because of
                      their superiority to conventional lead–acid or nickel–cadmium batteries in terms of energy
                      density, specific power, cost, safety, cycle life, and calendar life. An LIB stores chemical
                      energy during charging and converts it to electrical energy while discharging, and an EV
                      carries LIBs in groups connected as modules, which are joined together to form a complete
                      battery pack. Each module has the circuits for a thermal management system and the
                      whole pack is used to power the motor which propels the EV [44]. The power density, cycle
                      life, cost per kWh of energy, and calendar life correspond to the energy requirement of the
                      battery system. However, the range and the battery capacity of an EV are not linear; the
                      weight of the battery pack increases with an increase in capacity, which adversely affects
                      the efficiency of the vehicle on the road. It is therefore important to compare batteries and
                      battery systems based on energy and power densities, rather than on range requirements.
                      Different battery technologies and their specific energy and specific power ratings are
                      shown in Figure 1 [45].
                             Car manufacturers rarely make the batteries they use, although Tesla has its own
                      battery manufacturing plant, and battery cell production is largely concentrated in the USA,
                      China, Japan, and South Korea, details are shown in Table 1 [46–49].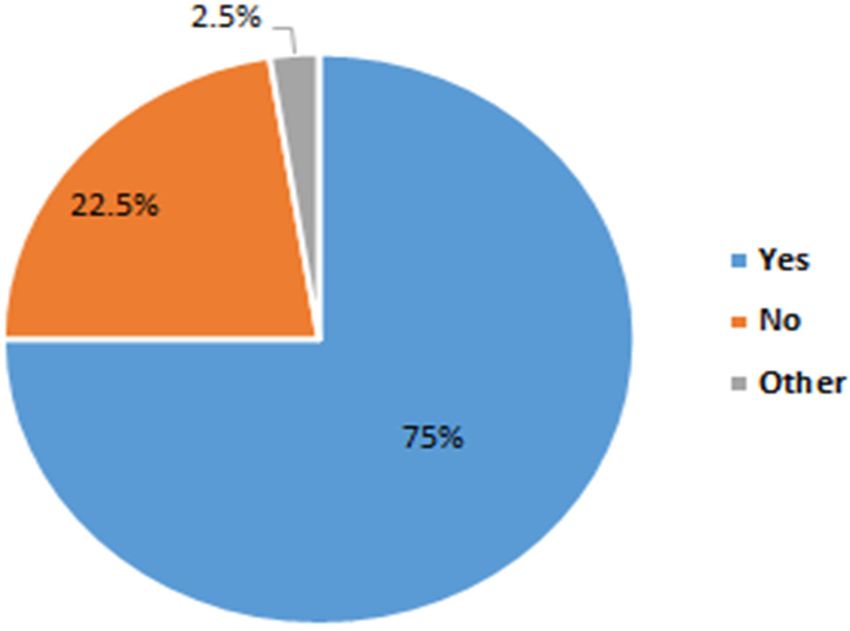
ty 2022, 3, FOR PEER REVIEW 5
Electricity 2022, 3 369
requirements. Different battery technologies and their specific energy and specific power
ratings are shown in Figure 1 [45].
Figure 1. Various battery technologies used in EVs and their specific energy and specific power
Figure 1. Various battery technologies used in EVs and their specific energy and specific power ratings.
ratings.
Table 1. Major electric car manufacturers and models, showing range, battery size, battery manufac-
Car manufacturers rarely
turers, location make the
of battery packbatteries
assembly they use, although
and location of batteryTesla has its own
cell production [46–49].
battery manufacturing plant, and battery cell production is largely concentrated in the
USA, China, Japan, and South Korea, details
Battery Size are shown in Table 1 [46,47,48,49].
Battery Battery Pack Battery Cell
Car Manufacturer Model Range (km)
(kWh) Manufacturer Assembly Location Production Location
Tesla Table Model
1. Major
S & electric
X car manufacturers
416–539, 474 75 orand
100 models, showing range, battery USA
Panasonic/Tesla size, battery manu- Japan
BYD facturers, Tang 528 pack assembly
location of battery 86.4 and location ofBYD China
battery cell production [46,47,48,49]. China
BYTON M-Byte 430–550 72–95 CALT China China
Tesla Model 3Battery Size Battery
354–498 Manufac-Panasonic/Tesla
50–74 Battery Pack As- Battery USA Cell Pro- USA
Manufacturer Model
Chevrolet
Range (km)
Bolt EV 383 60 LG Chem Location duction USA
(kWh) turer sembly Location S Korea
NIO ES8 425 84 CALT China China
Tesla Model S & X 416–539, 474 75 or 100 Panasonic/Tesla USA
Automotive energy Japan
Nissan Leaf 243 30 USA USA
BYD Tang 528 86.4 BYD China
supply corp. China
Fiat 500e 135 24 SB LiMotive USA USA
BYTON M-Byte
VW 430–550
e-Golf 72–95
202 CALT
35.8 China
Samsung SDI HungaryChina S Korea
Tesla Model 3
Ford 354–498
Focus Electric 50–74
190 Panasonic/Tesla
33.5 LG ChemUSA USA USA USA
BMW I3 183 22–33 Samsung SDI Hungary S Korea
hevrolet Bolt EV 383 60 LG Chem USA S Korea
Kia Soul EV 178 27 SK innovations S Korea S Korea
NIO ES8 425 84 CALT China China
Reprinted with permission from [46]. 2022, Coffin, David.
Automotive en-
Nissan Leaf 243 30 USA USA
Driving Ranges ergy supply corp.
and Charging Times
Fiat 500e 135 One 24of the main SB LiMotive
challenges associated USA with battery electricUSAvehicles (BEVs) is the
VW e-Golf 202 limited35.8 capacity and driving range associated with the batteriesKorea
Samsung SDI Hungary S and their cost. The battery
Ford Focus Electric 190 capacity 33.5
of many currentLG Chem models limits theirUSAdriving range to USA
250 km, although some
BMW I3 183 new models 22–33 offer Samsung
ranges ofSDI up to 400 km, Hungary
and upcoming models S Koreaare predicted to range
Kia Soul EV 178 beyond 27 SK innovations
this [50]. Consumers S Korea
are also concerned about the costSofKorea
batteries. In 2015 this was
approximately
Reprinted with permission from USD 350/kWh,
[46]. 2022, Coffin,making
David. the cost for a battery capacity of 40 kWh as much as
USD 14,000, meaning an EV would cost at least USD 12,000 more than a similar ICEV [50];
Driving Rangeshowever,and Charging Times that these will decrease to around USD 112/kWh by the end of
it is estimated
2025 [51]. It is important
One of the main challenges associated to recognize thatelectric
with battery real-world driving
vehicles ranges
(BEVs) is thewill
lim-not be the same
ited capacity and driving range associated with the batteries and their cost. The battery and drivers’
as the rated (or manufacturers’) range, as factors, such as driving conditions
capacity of many skills, will affect
current models vehicle
limitsefficiency. Thus,
their driving the time
range to 250taken
km, to charge an
although someEVnew
is also a significant
consideration. Table 2 [47,52–54] lists some of the most
models offer ranges of up to 400 km, and upcoming models are predicted to range beyond modern EVs, their rated and actual
drivingare
this [50]. Consumers ranges, and their battery
also concerned charging
about the cost oftimes.
batteries. In 2015 this was ap-
proximately USD 350/kWh, making the cost for a battery capacity of 40 kWh as much as
USD 14,000, meaning an EV would cost at least USD 12,000 more than a similar ICEV [50];Electricity 2022, 3 370
Table 2. The most modern EVs available in the market: predicted and real-world range, home and
rapid charging times [47,52–54].
Manufacturers’ Range Real-World Range Charging Time
Model
(km) (km) Home Charging (h) Rapid Charging (min)
Tesla Roadster 998 965 32 44
Tesla Model S 603 523 15 38
Volkswagen ID. 3 547 475 12.25 34
Tesla Model 3 547 475 11.75 22
BYD Tango 528 400 10.75 30
BYTON M-Byte 520 389 12 30
Polestar 2 498 450 12 28
Skoda vision IV 498 442 13.25 33
Jaguar I pace 470 407 13.50 44
Kia e-Niro 453 378 10.5 44
Mercedes-Benz EQC 450 362 12.75 35
Hyundai Kona Electric 449 394 10.5 44
NIO ES8 425 355 12 90
From Table 2, the shortest attainable rapid charging time is 22 min for the Tesla Model
3, while most other modern EVs can be rapidly charged fully within 45 min. Among these,
the Tesla Roadster has the longest range, at 965 km, with a real-world range closer to the
rated range than other EVs. The length of time it takes to recharge an EV depends on the
type of charger used, with the fastest chargers costing the most. There are currently three
main types of chargers, AC level 1, level 2 and DC fast chargers, and their key performance
details are shown in Table 3. AC level 1 EV supply equipment delivers charging through
a 120-volt AC plug and provides a range of about 2–5 miles per charging hour, while AC
level 2 equipment is capable of charging through 208–240-volt electrical supply, and it can
be installed at home or as a public charging point. This provides 10–20 miles per charging
hour; however, as the charging time for a 24 kWh battery pack is around 8 h, an EV should
be fully charged at home when 240-volt services are available [55]. Next, 480-volt direct
current (DC) fast charging equipment provides charging in around 30 min, but these are
only available at public stations and cannot be installed in residential buildings for safety
purposes. Globally, there are three types of DC charging systems: Type 4 CCS/COMBO
(Combined Charging System), Type 4 CHAdeMO, and Tesla dual single-phase AC and DC
charger [56]; however, only the Japanese CHAdeMO standard chargers (used by Nissan,
Mitsubishi, and Kia), are currently fitted with V2G technology [57].
Table 3. Chargers, miles per charging hour and charging times for each level of charging [55,58].
Charging Levels Miles per Charging Hour Charging Time for a 24 kWh Battery Pack Charger Standard
AC level 1 2–5 ~17 h SAE J1772
AC level 2 10–20 ~8 h SAE J1772
CHAdeMO, CCS, Combo,
DC fast charging 50–70 ~30 min
Tesla Supercharger
Battery Lifespan
Competition with conventional ICEVs requires EVs and their batteries to run reliably
for 10–15 years under various climatic conditions and duty cycles. The main factors limiting
battery lifetime are time at high temperature, state of charge (SoC), cycling at high depth of
discharge (DoD), and C-rate [59]. While time at high temperature may not be regarded as a
significant factor within Western European or North American contexts, it takes on much
greater importance in the Saudi context, where summer temperatures average 45 ◦ C [60].
The life cycles of some commonly used energy storage batteries and their characteristics
are listed in Table 4 [61]Electricity 2022, 3 371
Table 4. Lifespans, characteristics, and applications of commonly used energy storage batteries [61].
Specific Energy Specific Power Life Cycle
Energy Storage Type Efficiency (%) Applications
(Wh/kg) (W/kg) (Cycles)
Lead–acid battery
Lead–acid 35 180 1000 >80 Grid energy storage, UPS, electric
Advanced lead–acid 45 250 1500 _ vehicle lighting and ignition
Metal foil lead–acid 30 900 500+ _
Nickel battery
Nickel–iron 50–60 100–150 2000 75
Nickel–zinc 75 170–260 300 76 Digital cameras, electric vehicles,
Nickel–cadmium (Ni–Cd) 50–80 200 2000 75 portable electronics, and toys
Nickel metal hydride
70–95 200–300 95
Lithium ion polymer (LiPo) 130–225 260–450 >1200 _ Electric vehicles, smart phones,
Lithium iron phosphate laptops, electric toys, digital cameras
120 2000–4500 42,000 _
(LiFePO4)
Lithium ion sulphide (FeS) 150 300 1000+ 80
Lithium titanate 80–100 4000 18,000 _
ZEBRA battery
Sodium sulphur 150–240 150–230 800+ 80 Automobile applications
Sodium nickel chloride 90–120 155 1200+ 80
Metal air battery
Aluminium air 220 60 _ _
Zinc air 460 80–140 200 60 Grid storage and electric vehicles
Zinc 460 _ _ _
Lithium air 1800 _ _ _
Adapted with permission from [61]. 2022, Elsevier.
Charging is most efficient when the battery has low charge or SoC, while charge
acceptance slows towards saturation. Charging efficiency also depends on temperature
and SoC. As the battery ages, internal resistance increases, and the charge rate slows. An
SoC above 80% promotes capacity fade, while keeping the lithium ion at high SoC affects
lifetime more than cycling at mid-range SoC [62].
2.1.4. Weather Conditions and Terrains
Research suggests that the performance of an EV varies considerably according to the
climate and terrain in which it is driven. For example, [63] found that the driving range
in mountainous terrain was less than the manufacturers had estimated. In addition, the
thermal behaviour of lithium ion batteries is adversely affected by extreme heat, with both
charging efficiency and life cycle significantly reduced when battery temperature exceeds
50 ◦ C. For example, the Nissan Leaf’s battery capacity was found to deteriorate when tested
in the heat of Arizona in the US [64]. Saudi Arabia has a desert climate with extremely
high temperatures in the summer, reaching an average of 45 ◦ C [65], and mountainous
regions in the west and southwest, and this could raise doubts about the suitability of EVs,
negatively impacting their quick adoption, at least in the short-term.
2.1.5. Safety of EVs
While there are risks with any motorised vehicle, the risk of fire and other hazards
associated with lithium ion batteries are particularly serious in EVs for a variety of reasons;
these include high demands in terms of driving performance and charging speed, the
resulting increasing scale and energy density of battery packs, and unavoidable traffic
accidents [66]. There is an additional risk that burning lithium ion batteries may release
toxic gases as a result of their high heat rate [66]. Concerns around the risks associated with
fires due to batteries overheating are likely to be exacerbated when external air temperatures
are already high, as is the case in the KSA.Electricity 2022, 3 372
2.1.6. Environmental Benefits
EVs have the potential to play a key role in reducing GHG emissions within the
transportation sector, which has one of the highest emissions rates of any sector [67].
However, evaluating exactly how environmentally friendly EVs are is a complex task that
includes assessing the electricity generation sources for charging and manufacture and
the challenges associated with recycling EV batteries, and their overall contributions to
environmental degradation. Consequently, users are frequently unsure whether driving an
EV will actually assist the environment by reducing GHG emissions [68]. However, the use
of renewable resources to power EVs could significantly enhance their green credentials.
2.1.7. EV Prices
EV pricing depends on several factors, including driving range, battery capacity, and
km/kWh energy consumption. Table 5 [69] lists the manufacturer’s suggested retail price
(MSRP) for selected US BEVs, showing their range, battery capacity, and km/kWh con-
sumption. The fact that even the cheapest models come in at over USD 29,900 demonstrates
that purchase price is a significant factor in relation to EVs, especially by comparison
with ICEVs.
Table 5. EV manufacturers and models with range, battery capacity, per kWh energy consumption,
and manufacturer’s suggested retail price [69].
Battery Capacity
Manufacturer Model Range (km) km/kWh MSRP (USD)
(kWh)
Tesla Model S 100D 564 100 5.65 94,000
Tesla Model S P100D 542 100 5.42 135,000
Tesla Model 3 498 78 6.39 35,000
Tesla Model X 100D 474 100 4.75 96,000
Model X
Tesla 465 100 4.65 140,000
P100D
Tesla Model S 75D 442 75 5.90 74,500
Chevrolet Bolt EV 383 60 6.39 36,620
Tesla Model X75 381 75 5.08 70,532
VW e-Golf 201 35.8 5.62 30,495
Hyundai Ioniq Electric 200 28 7.13 29,900
Ford Focus Electric 185 33 5.60 29,120
BMW I3 183 33 5.55 44,450
Kia Soul EV 178 30 5.95 32,250
Nissan Leaf 172 30 5.74 29,900
Honda Clarity Electric 150 25.5 5.61 33,400
Fiat 500e 140 24 5.84 32,995
As Table 5 demonstrates, almost all models exhibit similar range per kWh energy
consumption, at 5–6 km/kWh, except the Tesla Model X variants, at less than 5 km/kWh.
While Tesla models are broadly comparable with competitors’ models in km travelled per
kWh, they have superior ranges because of their larger battery capacity, compact packing,
and efficient thermal management systems. The Hyundai Ioniq Electric has an impressive
range per kWh of approximately seven kilometres; this high efficiency may be due to
Hyundai’s battery technology. If Hyundai could scale its battery capacity to the 100 kWh
capacity of Tesla, then it would have a driving range of 710 km, far longer than any other
model, including those of Tesla. However, the pricing shown here suggests that any such
innovation would lead to a significant increase in price, as Tesla models are among the
most expensive listed, with the highest suggested retail price of the Tesla Model X P100 D
being the most expensive at USD 140,000.
2.1.8. Charging Costs
While the average purchase costs of EVs far exceeds those of ICEVs, the running costs
are typically much lower. For example, EDF Energy’s GoElectric 35 tariff [70], currently
available to UK users, has an off-peak rate of GBP 0.045/kWh (USD 0.06/kWh), enabling
users to fully charge a standard 40 kW Nissan Leaf overnight for only GBP 1.80 using aElectricity 2022, 3 373
7 kW home charger. This is much lower than the equivalent fuel cost for a conventional
petrol or diesel car. In any driving scenario, the recharge consumption of an EV can be
determined by multiplying its drive efficiency (in kWh/mile) by miles travelled. In the case
of level 2 charging, the A/C charge rate is equal to the EV’s hourly recharge consumption,
and dividing the required daily recharge consumption by the vehicle charging rate gives the
number of charge hours per day [71]. The optimal daily charging amount can be estimated
using Equations (1) and (2) below:
T−1
DHC = LMPT × (CHR − (T − 1) × VCR) + ∑n=1 VCR × LMPn (1)
CHR
T= (2)
VCR
DHC represents the daily hourly charges (USD), VCR is the vehicle charge rate (kW),
T is charging time (hours), CHR is the charge required (kWh) and LMPn is the locational
marginal price (LMP) during the nth lowest-ranked hour of the day (USD/kWh). When
estimating DHC, the LMP values can, if necessary, be taken as starting from the lowest
LMP hour and moving to the next rank ordered LMP hour. The savings achieved in the
Tesla 3 long-range and Chevrolet Bolt for a range of driver profiles (light, average, heavy,
and Lyft/Uber) are shown in Table 6 [71].
Table 6. Hourly and flat charging rates for Tesla and Bolt and corresponding savings over conven-
tional petrol cars [71].
Hourly Flat Rate % Saving USD Saving
Driver Profile 1 Vehicle
(USD) (USD) Hourly Hourly
Tesla 37 91 59 54
Light driver
Bolt 40 98 59 58
Tesla 74 182 59 108
Average driver
Bolt 81 196 59 115
Tesla 132 303 57 172
Heavy driver
Bolt 143 327 56 184
Tesla 289 607 52 318
Lyft/Uber
Bolt 315 654 52 339
1 Light driver—24 miles/day; average driver—48 miles/day; heavy driver—80 miles/day; Lyft/Uber
driver—161 miles/day.
Having explored the main factors associated with EV usage globally, the next section
examines the factors which are likely to influence their adoption in Saudi Arabia, notably
recent rises in domestic fuel prices and the government’s ambitious carbon reduction plans
set out in Vision 2030.
2.2. Drivers of EV Adoption in Saudi Arabia
There were over 15 million vehicles in Saudi Arabia in 2020 [72], four-fifths of these
being cars and other light vehicles, and numbers are expected to reach 25 million by
2030 [73]. Although buses operate between cities and to and from neighbouring countries
and trains run between major cities, such as Riyadh, Jeddah and Dammam, urban public
transport is limited. Most people use their own vehicles, as the meagre public transport
provision is compensated for by subsidized fuel, making cars affordable, even for low-
income residents [74]. For example, in Riyadh, the capital city, private vehicle ownership
almost doubled between 1996 and 2008, accounting for 85% of 8 million daily trips taken,
against only 2% in buses [74]. According to the Saudi Energy Efficiency Center [75],
transportation currently consumes around 21% of total energy in the KSA, at around one
million barrels of oil equivalent per day, and 52% of the sector is light duty vehicles. As
transportation energy consumption is expected to double by 2030 [75], the widespread
adoption of electric vehicles could have a significant impact in reducing CO2 emissions;Electricity 2022, 3 374
however, the findings of the survey (survey questions: https://rb.gy/lhogk8, accessed
on 15 February 2021) conducted for this study indicate that there are almost no EVs on
the KSA’s roads at the moment. Only one participant out of 698 stated that they currently
drove an EV, with nearly 3.5% owning hybrid vehicles, but more than 96% of respondents
still drive conventional vehicles.
However, domestic fuel prices are now being brought into line with international lev-
els, as part of reforms aimed at easing the burden of subsidies on state finances, improving
energy efficiency, and cutting consumption. Between 2007 and 2015, gasoline prices in
Saudi Arabia were fixed, with premium 95-octane gasoline cost of SAR 0.60 (Saudi riyals)
per litre, while 91-octane gasoline was at SAR 0.45 per litre. In the first wave of energy price
reforms in December 2015, retail prices rose to SAR 0.90 and SAR 0.75 per litre, respectively,
and there were larger increases in 2018, with prices rising to SAR 2.04 and 1.37 per litre [76].
In July 2021, following increased crude oil prices, the government capped prices at SAR 2.33
and 2.18 per litre, respectively [76]. As for electricity, the residential and commercial tariffs
were set in January 2018 at SAR 0.18 and 0.20 per kWh, respectively [77]. With consumers
now feeling the effect of increases in the price of gasoline, there is more willingness to
consider switching to an electric option.
The Saudi government wishes to promote EVs in line with Saudi Vision 2030, an
ambitious and broad reaching strategy to shift the economy away from oil and reduce GHG
emissions, and some policies to support their adoption have already been developed [78].
However, adoption initiatives, such as the agreement with Lucid Motors, are in their early
stages and are just beginning to be implemented in the country. This is reflective of the
approach to EVs of the petroleum-producing states within the Gulf Cooperation Council
(GCC), with the notable exception of the United Arab Emirates (UAE). Although a global
revolution is occurring in the field of EVs, Dubai is the only location in the Gulf to have
embraced this technology to date, with about 50% of Dubai’s taxi fleet now being hybrid
or electric, and 300 charging stations available across the city [79]. Various studies have
been conducted to assess the future of EVs in the KSA and to estimate the GHG reductions
that may be achieved by their adoption [80]. Despite the fact that the country is one of
the world’s largest oil producers, many of these studies indicate that a key challenge to
EV adoption is the massive additional demand EVs will place on an already overloaded
electrical network, especially during the summer, and steps are now being taken to design
systems to evaluate the impact of EVs on the grid [81]. One possible solution is a techno-
economic hybrid power system for EVs using a mixture of green energy [82]. This would be
a significant development, both in terms of developing sustainable EV infrastructure and
meeting the country’s GHG reduction targets. Having examined the key factors associated
with EV adoption identified in the literature, both internationally and in the Saudi case
study context, the next section describes the methodology adopted for the study.
3. Methodology
This study adopted a mixed-methods approach to analysing the perceptions of po-
tential EV users in the KSA, with the aim of identifying the barriers to widespread EV
adoption in the Kingdom. This is part of a wider study of the strategy of using EVs to partly
replace centralized energy storage, given that solar panels and other renewable energy
systems are increasingly deployed. It is anticipated that this case study can be applied or
correlated to other Gulf Cooperation Council (GCC) countries or any country that shares
the same climate conditions and similar user lifestyles.
3.1. Quantitative Analysis
Data were collected in a quantitative e-survey, considered suitable for large samples [83].
Sampling was non-random [84], the instrument being an electronic questionnaire self-
administered by individuals identified via local vehicle suppliers [85]. Most of the 78 items
were in the form of closed questions which were scored on a 5-point Likert scale from
“not important” (1) to “very important” (5). Some additional open questions were used toElectricity 2022, 3 375
elicit more subtle perceptions. To meet limitations of scope and space, a selection of the
questionnaire findings is reported here.
Three aspects of instrument validity were assessed: face, content, and construct
validity [86]. For face validity, ten participants were asked to examine questionnaire items
for logical links with the objectives [87]. For content validity, six EV experts assessed
each item for purpose, i.e., whether it measured what it should measure [86]. Content
validity was evaluated further via subjective feedback in a pilot study of 30 participants,
which also explored construct validity objectively to confirm the instrument’s reliability
and internal consistency. This was achieved by means of Cronbach’s alpha and exploratory
factor analysis (EFA), which was used to develop theory, reduce complexity, and identify
latent factors [88]. The experts in the field who reviewed the survey questions included an
expert working on an EV chargers project at Saudi Electricity Company, two EV policy and
regulatory experts working at the Saudi Standards, Metrology and Quality Organization
(SASO), and three other researchers working in the field of EVs in the Saudi context.
Both Arabic and English versions of the questionnaire were used to elicit responses
from a wider population of drivers, comprising Saudi national, expatriates and others.
Four bilingual experts examined the Arabic-to-English translations of the survey items and
the responses to open questions. To ensure clarity and reduce the risk of misunderstanding,
the second page of the survey offered definitions of such terms as ‘hybrid vehicle’, ‘electric
vehicle’, ‘conventional vehicle’, and ‘V2G’.
3.2. Qualitative Analysis
NVivo was used for qualitative analysis, following Braun and Clark’s [89] six steps
of thematic analysis: (1) data familiarity, by iteratively reading responses to ensure under-
standing; (2) creating initial codes; (3) exploring textual data for themes by mapping initial
codes to text; (4) reviewing themes; (5) defining and naming themes; and (6) preparing the
report. The combined qualitative–quantitative analysis followed the approach of Makrakis
and Kostoulas-Makrakis [90].
The response rate was enhanced by a combination of convenience, snowball, and
volunteer sampling, thus compensating for any weaknesses among these strategies [91].
A sample size of 601 was calculated to be sufficient at a confidence level of 95% and a 4%
margin of error [92], given Saudi Arabia’s population of 34.8 million [93]. When data were
collected, 1012 questionnaires were returned, 698 of them complete, at a completion rate of
70%; the incompleteness of the remainder may be explained by the novelty of EVs in the
KSA. The instrument was developed on the SurveyMonkey platform, and in line with the
increasing use of social networking sites by researchers seeking to strengthen engagement
with surveys [84], Twitter, WhatsApp, and Telegram were used to recruit participants, as
were emails.
The R software environment was used to perform data analysis, comprising descriptive
statistics and factor analysis, including means and frequencies, an independent samples
t-test, Cronbach’s alpha and Pearson correlation coefficients, one-factor repeated measures
ANOVA, EFA using the lavaan package [94], and ggplot2 for graphics [95]. Normal
distribution and data homogeneity assumptions were confirmed by skewness and kurtosis
tests, making the above procedures appropriate [96].
3.3. Cost of Long-Term Ownership
As the literature review indicated that cost forms a significant barrier to EV adoption,
the potential costs of ownership over a period of 10 years were calculated for both EVs
and ICEVs based on their long-term costs. For the purposes of this study, the cost of
ownership was deemed to include the initial cost and ongoing operation and maintenance
(O&M) costs. Estimations of O&M costs were based on the resources available in the KSA.
Maintenance and repair costs were calculated on a vehicle’s entire expected lifetime and
thus assumed to be constant across the 10-year analysis period. The fact that EVs are far
cheaper to operate and maintain than ICEVs, as combustion engines require oil, filters,Electricity 2022, 3 376
belts, and so on, and EVs do not, was also considered. A 10-year period was chosen as
research indicates that the payback period for an EV might be up to ten years due to the
higher initial costs compared to ICEVs [97]; as a result, and in order to account for variation
in daily driving ranges, ownership costs were examined for the first 10 years. This study
assessed annual running cost as follows:
Engine O&M: Calculated for ICEVs only. Given their low requirement for engine
maintenance, this cost was not considered for EVs when estimating the cost of their
long-term ownership.
Other O&M: These costs include those associated with tires, brake pads, gearbox oils,
etc. [98,99], which are generally similar for EVs and equivalent ICEVs.
Battery replacement: According to [100], battery replacement is a major cost associated
with long-term EV ownership; however, it is estimated that these will decrease fairly
rapidly [51]. The US Department of Energy set cost targets of USD 300/kWh by 2015 and
USD 125/kWh by 2022 [101], and this study took USD 125/kWh as the cost of the battery.
Battery replacement was assumed to be necessary only for EVs with a high usage rate. It
was also assumed that it may be required eight years after purchase of the vehicle. This was
taken into consideration when estimating the battery replacement costs for vehicles in all
mileage ranges. The fact that EVs with larger batteries will incur greater replacement costs
was also recognized; thus, for the Tesla Model 3, a 75 kWh battery capacity was assumed,
making the estimated battery replacement cost around USD 9375 (approx. SAR 35,000).
Administration fees: Most of these are paid to the government, including for vehicle
registration, annual renewal, periodic inspection, and plate registry [102]. The KSA cur-
rently imposes no road tax, congestion charges, or emission charges; however, nor does
the government offer grants for ownership of EVs, whereas the UK government, for exam-
ple, provides up to GBP 1500 under its net-zero strategy [103] and the Irish government
provides EUR 5000 grants [104].
Car insurance: According to [105], some of the KSA’s motor insurance companies offer
fixed annual insurance prices, and the annual average is SAR 1050 (USD 280). This is the
insurance cost used in this study for all car brands and all mileage ranges.
Due to the absence of EV agencies in the KSA, the initial price for the Tesla was
obtained by examining Tesla prices in the UAE [106], which is similar to the KSA market
in terms of prices, standards, and other factors, and set at AED 200,000 (USD 54,450). The
initial cost for the three Toyota ICEVs was set based on new vehicle prices at Saudi Toyota,
as follows: the Camry is priced at SAR 99,000 (USD 26,400), the Prado at SAR 213,000 (USD
56,800) and the VXR at SAR 404,500 (USD 108,000) [107]. However, a primary long-term
cost not included in the present analysis is depreciation; it is assumed that all EVs and
ICEVs are purchased outright, rather than via loans or instalment plans, and that ownership
persists for the full ten years, making depreciation inapplicable.
Finally, the cost of ownership of a vehicle over 10 years can be calculated as [108]:
10
COO10 = (PP − GI) + BR + ∑y=1 FCy (D) + T + OMCy
(3)
where COO10 is the 10-year cost of ownership, PP is the initial cost of the vehicle, GI
represents government incentives to purchase it (currently zero in the KSA), BR is battery
replacement cost, FCy is forecasted cost of fuel per year y, D is the annual distance travelled
by the vehicle, T is the motor tax on the vehicle (again, zero in the KSA), and OMCy is
O&M cost per year (excluding fuel consumption).
4. Findings
This section presents the findings of the study. The demographic data are reported
in Section 4.1, then the quantitative and qualitative results are presented and discussed in
Sections 4.2 and 4.3, respectively.Electricity 2022, 3 377
4.1. Demographic Data
The majority of participants were Saudi citizens (around 96%) and there were more
men (around 85%) than women (around 15%). This gender difference was anticipated
since women have only recently been permitted to drive in the KSA [109]. Most of the
respondents (around 60%) lived in the central region (including the capital, Riyadh),
followed by around 20% in the western region (which include the major cities of Jeddah,
Makkah, and Medina). Over two-thirds were aged 30–50, followed by 18 to 29 years old,
who accounted for around 18% of participants. Around 51% had an undergraduate degree,
while 22% had higher degrees (e.g., a master’s or doctorate). Only 1% of participants did
not have a high school diploma. The major demographic data elicited are provided in
Table 7.
Table 7. Demographic data on survey participants.
Variable Classification No.
Saudi 669
Nationality
Non-Saudi 28
Female 105
Gender
Male 593
Single 169
Marital status Married 520
Others 9
Northern 18
Southern 52
Region Eastern 68
Central 419
Western 140
18–29 123
30–39 260
Age
40–49 222
Above 50 93
Below high school 7
High school 103
Diploma 68
Education level
Bachelor’s degree 359
Higher degree 159
Other 1
4.2. Quantitative Findings
4.2.1. Current Vehicle Usage
Almost half of respondents reported owing vehicles with six-cylinder engines, fol-
lowed by a third with four cylinders, and a fifth with eight. It may be assumed that
Saudi drivers prefer vehicles with large engines to suit the long distances and exceptional
terrain, including vast expanses of desert, in the country. In terms of the daily distance
travelled, participants were asked to select from a number of mileage segments, taking
average mileage as the mid-point of the range, with Segment #1 (under 25 km); Segment
#2 (26–50 km), Segment #3 (51–100 km); Segment #4 (101–150 km); and Segment #5 (above
150 km). More than a third (37%) of participants selected Segment #2, while 21% travelled
less than this. Just over 30% selected Segment #3, with around 3% reporting that they drove
for more than 150 km per day. The daily mileage of participants is illustrated in Figure 2.elled, participants were asked to select from a number of mileage segments, taking aver-
age mileage as the mid-point of the range, with Segment #1 (under 25 km); Segment #2
(26–50 km), Segment #3 (51–100 km); Segment #4 (101–150 km); and Segment #5 (above
150 km). More than a third (37%) of participants selected Segment #2, while 21% travelled
Electricity 2022, 3 less than this. Just over 30% selected Segment #3, with around 3% reporting that they378
drove for more than 150 km per day. The daily mileage of participants is illustrated in
Figure 2.
Daily travel profile
40%
35%
30%
25%
20%
15%
10%
5%
0%
Segment #1 Segment #2 Segment #3 Segment #4 Segment #5
(Under 25 km) (26-50 km) (51-100 km) (101-150 km) (Above 150 km)
Figure 2. Daily mileage of participants.
Figure 2. Daily mileage of participants.
4.2.2. Fuel Consumption Costs (Based on Distance Travelled)
To test whether EVs were cost effective of in terms fuel consumption in the con-
text of a petroleum producing nation, a calculation of the comparative fuel consumption
costs between ICEVs and EVs was made using the mileage ranges shown in Figure 2.
Three popular Toyota ICEV models (Camry, Land Cruiser Prado, and Land Cruiser VXR)
were used to represent ICEVs, because Toyota came top of the 2019 Brand Index for car
makers in Saudi Arabia [110], with the Tesla Model 3 used to represent EVs, as it was
identified as the best-selling EV around the world in 2020 [111].
Fuel cost per day (Equation (4)) was measured according to the current petrol price
(SAR 2.18/L) and fuel efficiency for the above three Toyota brands as 18.3, 10.1 and
8.2 km/L, respectively [107]. The fuel cost per day of EVs (Equation (5)) was calculated
according to the Saudi electricity tariff (0.18 SAR/kWh). The estimated battery capacity of
the Tesla model 3 is 75 kWh, and its consumption is 0.121 kWh/km [112]:
SAR/L
Fuel cost per day of ICEV = (4)
Average km per day
0.151 kWh/km × 0.18 SAR/kWh
Fuel cost per day of EV = (5)
Average km per day
Figure 3 compares daily cost of consumption for the four models at each of the
five average daily mileage segments, based on manufacturers’ specifications. Among
ICEVs and in each segment, the Camry has the lowest cost, which increases with engine
size. Thus, in Segment #5, the VXR costs SAR 50 per day to run and the Prado SAR 8.20.
However, the Tesla Model 3 is seen to be a much cheaper alternative in terms of fuel cost in
all segments, at about six, ten, and thirteen times lower than the Camry, Prado, and VXR
models, respectively.Figure 3 compares daily cost of consumption for the four models at each of the five
average daily mileage segments, based on manufacturers’ specifications. Among ICEVs
and in each segment, the Camry has the lowest cost, which increases with engine size.
Thus, in Segment #5, the VXR costs SAR 50 per day to run and the Prado SAR 8.20. How-
ever, the Tesla Model 3 is seen to be a much cheaper alternative in terms of fuel cost in all
Electricity 2022, 3 379
segments, at about six, ten, and thirteen times lower than the Camry, Prado, and VXR
models, respectively.
SAR 50
SAR 45
SAR 40
SAR 35
SAR 30
SAR 25
SAR 20
SAR 15
SAR 10
3.42 4.78
SAR 5 1.03 2.07
0.35
SAR 0
Segment#1 Segment#2 Segment#3 Segment#4 Segment#5
13 km 38 km 76 km 126 km 176 km
Camry Prado VXR Tesla
Figure3.3.Fuel
Figure Fuelconsumption
consumptionper
perday.
day.
4.2.3.CO
4.2.3. CO22 Emissions
Emissions (Based
(Based on
onDistance
DistanceTravelled)
Travelled)
Asthe
As thedesire
desiretotoreduce
reduceCO emissionsisisaakey
CO2 2emissions keydriver
driverof
ofEVEVadoption
adoptionfor
forthe
theSaudi
Saudi
government,
government, Equation
Equation (6)
(6) was
was used
used totoestimate
estimateand
andcompare
compareemissions
emissionsfrom
fromEVsEVsand
and
ICEVs.
ICEVs.The
Thefigure
figureofof2.29
2.29kg/L
kg/L was
was based
based on
ondata
datafrom
fromNational
NationalResource
ResourceCanada
Canada[113]
[113]
who
whoestimate
estimatethe CO2 2tailpipe
theCO tailpipeemissions
emissionsforforgasoline
gasolinevehicles
vehiclesatat2.29
2.29kg/L.
kg/L.As
Asbefore,
before,the
the
Camry, Prado, and VXR were used as examples:
Camry, Prado, and VXR were used as examples:
3, FOR PEER REVIEW 16
CO kg/L = 2.29Average
∗ km per day (6)
CO2 (kg/L) = 2.29 ∗ (6)
Fuel efficiency km L
Figure 4 indicates that CO2 tailpipe emissions increase rapidly as driving range and
Figure 4 indicates that CO2 tailpipe emissions increase rapidly as driving range and en-
engine size increase, the
gine size highest
increase, theemissions beingbeing
highest emissions in Segment
in Segment#5,
#5,at
at 22.02, 39.90,
22.02, 39.90, andand
49.1549.15
kg/L
kg/L for the Camry,
for thePrado,
Camry, and
Prado,VXR, respectively.
and VXR, respectively.
50
40
30
20
10
0
Segment #1 Segment #2 Segment #3 Segment #4 Segment #5
13 km 38 km 76 km 126 km 176 km
Camry Prado Land Cruiser
Figure 4. CO2 emissions
Figure 4. (kg/L).
CO emissions (kg/L).
2
4.2.4. EV Prices
Given the fact that the literature identified purchase price as a key barrier to EV adop-
tion, respondents were asked to identify the maximum price they would be willing to pay
for an EV. Figure 5 shows respondents’ preferences in terms of EV price and battery range,Segment #1 Segment #2 Segment #3 Segment #4 Segment #5
13 km 38 km 76 km 126 km 176 km
Camry Prado Land Cruiser
Electricity 2022, 3 380
Figure 4. CO2 emissions (kg/L).
4.2.4. EV Prices 4.2.4. EV Prices
Given the fact that thethe
Given literature
fact that identified purchase
the literature identifiedprice as a key
purchase pricebarrier tobarrier
as a key EV adop-to EV
tion, respondents were asked
adoption, to identify
respondents the maximum
were asked price
to identify the they would
maximum bewould
price they willing to payto
be willing
for an EV. Figurepay for an EV.
5 shows Figure 5 shows
respondents’ respondents’
preferences in preferences
terms of EV in price
terms of EVbattery
and price and battery
range,
range, with the majority (62%) choosing the lowest price band (SAR 70,000 to 100,000)
with the majority (62%) choosing the lowest price band (SAR 70,000 to 100,000) and just
and just 3% choosing the high battery range with advanced specification (SAR 250,000
3% choosing thetohigh battery range with advanced specification (SAR 250,000 to 500,000).
500,000).
SAR 70,000 –
100,000 SAR “with
less battery range” 3%
SAR 100,001 – SAR 11%
150,000 “with
medium battery
range”
SAR 150,001 – SAR
62%
24%
250,000 “with high
battery range”
SAR 250,001 – SAR
500,000 “with high
battery range and
advanced
specifications”
Figure 5. Respondents’
Figure EV price preferences
5. Respondents’ EV pricein terms ofinbattery
preferences terms ofrange.
battery range.
4.2.5. Addressing Energy Storage Issues
4.2.5. Addressing Energy Storage Issues
V2G technology has been identified as a possible solution to some of the energy storage
V2G technology
issues has been identified
associated with EVs [7]. as In
a possible solution
order to assess to some of the
the acceptability energy stor-
of introducing V2G
age issues associated withtoEVs
technology Saudi[7]. In order
Arabia, to assess
participants werethe acceptability
asked whether theyofwould
introducing
be willingV2G
to use
technology to Saudi Arabia, participants were asked whether they would be willingso.toIn
an EV to supply the electricity grid if they gained some economic benefit from doing
order to avoid any confusion, the terms used were clearly defined to ensure participants
had a clear understanding on which to base their responses. As Figure 6 shows, three-
quarters of participants expressed an interest in this, while just under a quarter declined.
Some of the 2.5% of respondents who selected the ‘Other’ option here provided instructive
qualitative responses, expressing doubts about costs versus financial benefits, technical
issues, including reliability and safety in the hot Saudi climate, or the risk that frequent
charging and discharging would reduce battery life, making the income from selling power
insufficient to compensate for having to replace the battery more quickly.
It is interesting to note that analysis of responses to this question via ANOVA revealed
that respondents who expressed greater interest in financial incentives and environmental
matters elsewhere in the survey were significantly more positive in their replies regarding V2G.
In order to calculate the potential availability of EV batteries to feed the grid via
V2G, respondents were asked about their current car ownership (Q18). More than half
of respondents (58%) owned a single car, 27% owned two, and 15% had three or more,You can also read