In Situ Modification of Reverse Osmosis Membrane Elements for Enhanced Removal of Multiple Micropollutants - MDPI
←
→
Page content transcription
If your browser does not render page correctly, please read the page content below
membranes
Article
In Situ Modification of Reverse Osmosis Membrane
Elements for Enhanced Removal of
Multiple Micropollutants
Katie Baransi-Karkaby 1,2, *, Maria Bass 1 and Viatcheslav Freger 1, *
 1   Technion—Israel Institute of Technology, Wolfson Department of Chemical Engineering, Technion City,
     Haifa 32000, Israel; bass@technion.ac.il
 2   The Galilee Society, Institute of Applied Research, P.O. Box 437, Shefa-amr 20200, Israel
 *   Correspondence: Katie.b.karkaby@gmail.com (K.B.-K.); vfreger@technion.ac.il (V.F.);
     Tel.: +972-4-9867771 (K.B-K); +972-4-8292933 (V.F.)

 Received: 10 January 2019; Accepted: 11 February 2019; Published: 13 February 2019

 Abstract: Reverse osmosis (RO) membranes are widely used for desalination and water treatment.
 However, they insufficiently reject some small uncharged micropollutants, such as certain
 endocrine-disrupting, pharmaceutically active compounds and boric acid, increasingly present
 in water sources and wastewater. This study examines the feasibility of improving rejection of
 multiple micropollutants in commercial low-pressure RO membrane elements using concentration
 polarization- and surfactant-enhanced surface polymerization. Low-pressure membrane elements
 modified by grafting poly(glycidyl methacrylate) showed enhanced rejection of all tested solutes
 (model organic micropollutants, boric acid, and NaCl), with permeability somewhat reduced, but
 comparable with commercial brackish water RO membranes. The study demonstrates the potential
 and up-scalability of grafting as an in situ method for improving removal of various classes of organic
 and inorganic micropollutants and tuning performance in RO and other dense composite membranes
 for water purification.

 Keywords: in situ membrane modification; micropollutant removal; boron removal; spiral wound
 elements; reverse osmosis

1. Introduction
      The presence of organic micropollutants, in particular, endocrine-disrupting compounds (EDCs)
and pharmaceutically active compounds (PhACs), in sewage treatment plant effluents emerged as an
issue of growing concern over recent years [1–6]. This is an extremely diverse group of substances that
include industrial chemicals, agrochemicals, pharmaceuticals, hormones, etc. that can have adverse
effects on ecological systems and human health [7,8]. Many micropollutants tend to persist or only
partially degrade in conventional wastewater treatment, thereby tending to accumulate in recreational
and drinking water sources [1,9–11]. Up to date, there are no regulatory requirements for monitoring
EDCs and PhACs in drinking water [1], yet there are attempts to limit their entrance.
      Nanofiltration (NF) and reverse osmosis (RO) membrane processes offer an attractive solution
for improving water quality by removing organic contaminants to a greater extent than conventional
water treatment plants [11] or concentrating them in smaller reject volumes that may be easier
to treat and safely dispose of. However, the rejection of small organic compounds by membrane
filtration is strongly influenced by physicochemical properties of the compounds (e.g., molecular size,
solubility, hydrophobicity, charge); therefore, the removal of some organics by membrane processes
can be low. Notably, studies of organic removal by commercial RO and NF membranes in pilot and
full-scale installations showed contradictory results. Many show a high rejection of micropollutants

Membranes 2019, 9, 28; doi:10.3390/membranes9020028                        www.mdpi.com/journal/membranes
Membranes 2019, 9, 28 2 of 14
by membranes [1,11–14]; however, others report incomplete removal by RO and NF, which may also
greatly vary between different membranes and specific pollutants [15–18]. Moreover, sorption of
organics within membranes and filtration systems is a phenomenon that may overestimate the true
rejection of strongly adsorbed solutes, if the steady state is not reached [5,19–21].
Sorption of organics within the membrane itself and, especially, the active layer, as result of
affinity toward the polyamide, also enhances permeation and lowers rejection of small uncharged
organics in RO and NF [2,6,22–25]. The undesired sorption and permeation of uncharged organics
is exacerbated by the fact that they are unaffected by electrostatic exclusion mechanisms (Donnan
and dielectric) that are responsible for the high salt rejection in RO and NF [26–30]. The rejection of
uncharged micropollutants is then controlled mostly by the affinity, size exclusion, and molecular
friction [6,22,23]. Similar factors are responsible for the low rejection of boric acid, an important
inorganic micropollutant in seawater desalination. Boric acid is naturally present in sea water and
aquifers (>4 mg/L) and can also be introduced in waste water from anthropogenic sources [31–33].
High concentration of boric acid in irrigation water accelerates plant decay and expiration, yet it is
insufficiently removed by RO membranes at pH below its pKa ~8.6 (in artificial seawater), when boric
acid is uncharged, which incurs additional costs in sea and brackish water desalination [31,34].
Surface modification of NF/RO membranes by graft polymerization was shown to be an appealing
way to improve micropollutant removal [33,35–38]. The concentration polarization (CP)-enhanced
procedure, whereby a mixture of suitable monomers and initiators is simply filtered through the
membrane, resulting in enhanced polymerization at its surface, offers a particularly facile way to
form a modifying coating layer on top of the membrane and minimize monomer consumption [35,38].
Moreover, our group demonstrated recently that the monomer consumption may be further reduced
and coating uniformity can be improved by adding a non-ionic surfactant such as Triton X100 to
the modifying solution, which solubilizes the monomer within surfactant micelles. Since micelles
concentrate the hydrophobic monomer and undergo a stronger CP, this helps bringing the monomer
to the surface and facilitates surface grafting [39].
Unfortunately, most previous studies were performed at the laboratory scale, with very few
reports involving feasibility tests up-scaled to commercial elements [38]. The potential of up-scaled
in situ modification for improving micropollutant removal in genuine commercial elements remains
largely unexplored. Therefore, in this study, we examine the feasibility of in situ surfactant-enhanced
surface modification up-scaled to commercial membrane elements for improved micropollutant
removal. Since, from a practical standpoint, tuning the modification recipe to each group of pollutants
would not be attractive, another point examined here is whether a single optimal procedure can
improve rejection of a range of micropollutants that belong to different classes and differ in their
physicochemical characteristics. The focus is on low-pressure reverse osmosis (LPRO), which is
particularly attractive for water treatment due to high permeability, relatively high selectivity, and low
energy consumption.
2. Materials and Methods
2.1. Materials
All chemicals used in the study were purchased from Sigma-Aldrich (Rehovot, Israel), and used
without purification. The fully aromatic polyamide LPRO elements (ESPA1-2521, membrane active
area 9200 cm2 [40]) were purchased from Hydranautics (Oceanside, CA). Deionized water (DW) was
used for preparing solutions in all experiments.
Bisphenol-A (BPA), classified as an EDC, and carbamazepine (CBZ) and acetaminophen (ACN),
classified as PhACs, were used as model micropollutants for membrane performance tests, along with
boric acid, an inorganic micropollutant. These contaminants were selected based on their occurrence
in water sources, and relatively poor rejection by RO membranes. Table 1 summarizes their structureMembranes 2019, 9, 28 3 of 14
and physicochemical characteristics. The pKa values, as well as that of boric acid (determined to be
pKa ~9.2 in fresh water [31]), indicate that all tested micropollutants are uncharged at neutral pH.
Version February 13, 2019 submitted to Journal Not Specified 2 of 4
Table 1. Model organic micropollutants used and their main characteristics. EDC—endocrine-
disrupting Bisphenol-A
Bisphenol-A
compound; PhAC—pharmaceutically Carbamazepine
Bisphenol-A active compound.
Carbamazepine Acetaminophen
Carbamazepine Acetaminophen
Acetaminophen
Characteristics
Characteristics
Characteristics
Plastic Additive,
Plastic EDC EDC
Additive, Drug, PhACPhAC
Drug, Drug, PhACPhAC
Drug,
31 This section may be divided by subheadings. It should provide a concise and PhAC
Plastic Additive, EDC Drug, PhAC Drug,
precise
Abbreviation
Abbreviation
Abbreviation Bisphenol-A
BPA
BPA BPA Carbamazepine
CBZCBZ CBZ Acetaminophen
ACNACNACN
32 description of the experimental
Characteristics
Plastic
results,
Additive,
their
EDC
interpretation
Drug,
as well as the Drug,
PhAC
experimental
PhAC
Molecular
Molecular weight
Molecular
weight weight 228
228 228 236.3
236.3 236.3 151151 151
33 conclusions
Solubility
that can be drawn.
inin water
Solubility
Solubility waterin water
Abbreviation BPA CBZ ACN
120 120
120 1818 18 14,00014,000
14,000
Molecular
(mg/L)
(mg/L) * * weight
(mg/L) * 228 236.3 151
34 2.1. Subsection
Solubility
Log
Log Kow in* water
Kow
Log *
Kow *(mg/L) * 3.32 120
3.32 3.32 18 2.45
2.45
2.45 14,000
0.46 0.46
0.46
pKa
pKa LogpKa
Kow * 9.6–10.2
9.6–10.2 **3.32
** **
9.6–10.2 13.92.45
13.9
******
13.9 *** 0.46
9.4
9.4 ******9.4 ***
35 2.1.1. Subsubsection
pKa 9.6–10.2 ** 13.9 *** 9.4 ***
36 Bulleted lists look like this:
37 Chemical
First
Chemical
•Chemical bullet structure
structure
structure
38 • Second bullet
39 • Third bullet
* [20], ** [41], *** [3].
40 Numbered lists can be added as follows:
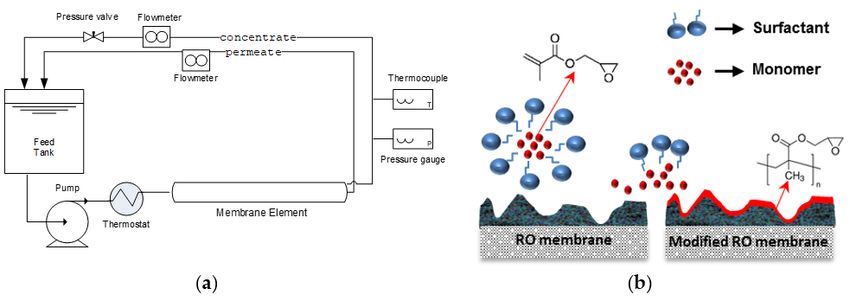
2.2. Membrane Modification
41 1. First item
42 2. Modification
Second item of ESPA1-2521 elements using a CP-enhanced grafting procedure with added
43 3. Third [39]
surfactant itemwas performed in a cross-flow filtration mode. The set-up included an 8-L feed tank,
the membrane module, a high-pressure pump with a pulsation damper for minimizing pressure
44 The text continues here.
fluctuations in the system, a heat exchanger, a valve for pressure regulation, and two flow meters
45
installed in the
2.2. Figures, concentrate
Tables and permeate lines that were used for monitoring the cross-flow rate and
and Schemes
adjusting recovery. The system was operated in a close loop with permeate and concentrate streams
46 All figures
recirculated backand tables
to the should
feed be cited
tank (see in the
Figure 1a).main text as Figure 1, Table 1, etc.
Figure 1. (a) isSchematic
1. This representation
a figure, Schemes of same
follow the the set-ups for modification
formatting. and the
If there are multiple testing
panels, theyelement.
should
(b) Schematic
be listed as: (a)illustration
Descriptionofof
formation mechanism
what is contained of the
in the firstgrafted
panel. layer.
(b) Description of what is contained
in the second panel. Figures should be placed in the main text near to the first time they are cited. A
The modifying solution initially contained 2 mM glycidyl methacrylate (GMA) monomer,
caption on a single line should be centered.
and 0.045 mM surfactant Triton X-100. The solution was first filtered through the membrane
47 for 5Textmin at the feed pressure of 20 bar in order to adjust recovery. Thereafter, the cross-linker
0
(N,NText -methylene-bisacrylamide, MBAA) and initiators potassium persulfate and potassium
48
metabisulfite, separately dissolved in DW, were added to the modifying solution; their concentrations
in theTable 1. This is asolution
modification table caption. Tables
were set should
to 0.003 be placed
mM, 4 mM,inand
the 2main
mM,text near to the first
respectively. Duringtimemodification,
they are
cited.
the tangential velocity of the solution was kept small (~1.8 cm/s) in order to enhance concentration
polarization of the reactants and promote Titlethe
1 surface
Title 2 grafting
Title 3 reaction. Recovery rate was 35–45%,
i.e., retentate flow was 55–65% of the feed, which allowed pushing a substantial fraction of the feed
entry 1 data data
across the membrane and yet ensuringentry a substantial
2 data recirculation
data rate to avoid a strong variation of
49 Text
50 TextMembranes 2019, 9, 28 4 of 14
Membranes 2019, 9, x FOR PEER REVIEW 4 of 13
monomer
performance concentration along theillustration
tests. A schematic module andofobtain a uniform
the grafting coating. and
chemistry The modification
mechanism iswas carried
shown in
out for 30 min at a temperature of 24 ◦ C. Afterward, the solution was discarded and the module was
Figure 1b.
thoroughly washed with DW. Fresh DW was recirculated through the modified modules for 24 hours
before the performance
2.3. Membrane tests. A schematic illustration of the grafting chemistry and mechanism is
Characterization
shown in Figure 1b.
The pristine and modified ESPA1 elements were autopsied to examine changes in membrane
surface characteristics.
2.3. Membrane Scanning electron microscopy (SEM, Ultra-Plus FEG, Zeiss, Oberkochen,
Characterization
Germany) was used to image the membrane surface morphology before and after modification.
The pristine
Attenuated total and modified
reflection ESPA1 elementsinfrared
Fourier-transform were autopsied to examine
(ATR-FTIR) spectra changes in membrane
were recorded as the
surface
average characteristics.
of 64 scans at 4-cm Scanning electron
−1 resolution microscopy
using a Nicolet (SEM, Ultra-Plus
8700 FTIR FEG, Zeiss,
spectrometer Oberkochen,
(Thermo-Scientific,
Germany)
Waltham, MA, was USA)
used equipped
to image with
the membrane surfaceATR
a Smart MIRacle morphology before
accessory with and afterelement
a diamond modification.
(Pike,
Attenuated total reflection Fourier-transform infrared (ATR-FTIR) spectra were
Madison, WI, USA). The spectra of modified membrane were recorded at different locations recorded as the average
along
of 64across
scans the
at 4-cm −1 resolution using a Nicolet 8700 FTIR spectrometer (Thermo-Scientific, Waltham,
and element in order to evaluate the uniformity of the coating. Each relative location along
MA, USA)the
or across equipped
element with a Smart
included 10–12MIRacle ATR
different accessory
spots. with aofdiamond
The degree element
grafting (DG) was(Pike, Madison,
defined as
WI, USA). The spectra of modified membrane were recorded at different locations along and across
the element in order to evaluate the uniformity DGof=the coating.
, Each relative location along or across (1)
the element included 10–12 different spots. The degree of grafting (DG) was defined as
where Ag and Am are the areas of the IR bands characteristic to the grafted polyGMA (a carbonyl band
at ~1725 cm−1) and the membrane (1586 cm−1 band characteristicAg of the supporting porous polysulfone
DG
layer of the original membrane), respectively, as shown = , (1)
Am in Figure 2.
Contact angle of membranes after autopsy was measured using a sessile drop of water, using a
where
DSA 100 and Am are (KRÜSS)
Ag instrument the areas equipped
of the IR bands
with acharacteristic
video camera, to image
the grafted polyGMA
grabber, (a carbonyl
and data analysis
band at ~1725 cm −1 ) and the membrane (1586 cm−1 band characteristic of the supporting porous
software. Every measurement was repeated at least four times (starting with a 0.25–0.45-μL drop)
polysulfone
and reportedlayer of the
results for original membrane),
each membrane respectively,
sample as shown
are the average of atinleast
Figure
five2.drops.
Carbonyl Polysulfone
−1
~1725 cm 1586 cm−1
Contact angle = 57 ± 2o
Contact angle = 26 ± 1o
Figure 2.
Figure 2. Typical
Typicalspectra
spectra
of of a pristine
a pristine ESPA1
ESPA1 membrane
membrane (bottom)
(bottom) and a membrane
and a membrane modified
modified by
by grafting
grafting a poly(glycidyl methacrylate) (GMA) coating
a poly(glycidyl methacrylate) (GMA) coating layer (top). layer (top).
Contact angle
2.4. Membrane of membranes after autopsy was measured using a sessile drop of water, using
Testing
a DSA 100 instrument (KRÜSS) equipped with a video camera, image grabber, and data analysis
The filtration tests were performed on a larger pilot-scale set-up, analogous to the one used for
software. Every measurement was repeated at least four times (starting with a 0.25–0.45-µL drop) and
modification (Figure 1a), but allowing higher feed flow rates, corresponding to standard operation
reported results for each membrane sample are the average of at least five drops.
conditions. The system included a 100-L feed tank, a membrane module housed in a high-pressure
vessel, a high-pressure pump, and a pressure regulation valve. Flow meters installed in the
concentrate and the permeate lines were used for monitoring the cross-flow rate and water flux. TheMembranes 2019, 9, 28 5 of 14
2.4. Membrane Testing
The filtration tests were performed on a larger pilot-scale set-up, analogous to the one used for
modification (Figure 1a), but allowing higher feed flow rates, corresponding to standard operation
conditions. The system included a 100-L feed tank, a membrane module housed in a high-pressure
vessel, a high-pressure pump, and a pressure regulation valve. Flow meters installed in the concentrate
and the permeate lines were used for monitoring the cross-flow rate and water flux. The system was
operated in a closed loop with permeate, concentrate, and bypass streams recirculated back to the
feed tank.
Membrane permeability was tested by filtering DW at a constant concentrate flow rate that was
set by adjusting the feed pressure between 10 and 20 bar. Two ranges of feed flow rates were used,
330–400 L/h and 600–680 L/h and the average permeability was taken.
The NaCl and boric acid passages were measured by filtering 1500 mg/L NaCl solution or 5 mg/L
boric acid solution of pH ≈ 7 at 10, 15, and 20 bar. Boron and salt passages were examined after 2 h
of filtration. Then, samples were taken after 15 minutes of filtration for each pressure and recovery
condition. The salt passage was determined by measuring the electric conductivity of the feed and
permeate using a conductivity meter (WTW InoLab Cond 7110, Weilheim, Germany). The passage
of boric acid was determined by measuring B concentration using an inductively coupled plasma
(ICP) spectrometer (iCap 6000 SeriesICP-OES, Thermo Scientific, Waltham, MA, USA) at a wavelength
248 nm.
The removal of organic micropollutants was examined in the filtration tests carried out for four
days at the recovery rate of 5–10%. The feed solution contained 10–12 mg/L for CBZ, 100–120 mg/L
for BPA, and 100–120 mg/L for ACN at pH ≈ 7.3–7.4 (at this pH, the model solutes were uncharged).
It was prepared by adding a stock solution of micropollutants in ethanol to the feed tank; the added
stock solution volume did not exceed 1% of the feed volume. These micropollutant concentrations,
high compared to those found in water sources and wastewater, had to be used due to the detection
limit of HPLC used for analysis of the permeate. However, we believed this point was not critical
for comparing pristine and modified membranes, which was our main purpose. Furthermore,
except for BPA, all micropollutant concentrations were far below the solubility in water (see Table 1);
therefore, no excessive non-linearity of sorption was expected, and the results and conclusions could
be extrapolated to lower concentrations.
The solution containing the selected micropollutants was filtered at a feed pressure of 20 bar,
and the recirculation rate was in the range of 350–680 L/h to maintain recovery within the 5–10%
range. The resulting permeate flow rate was within the range 27–47 L/h for the unmodified module
and 24–39 L/h for the modified module.
The concentration of the organic micropollutants in the inlet was determined using a
high-performance liquid chromatograph with an ultraviolet (UV) detector (HPLC, Agilent 1220
Infinity, Santa-Clara, CA, USA). HPLC was equipped with a Zorbax Eclipse XDB-C18 separation
column; the mobile phase was a binary gradient of 0.1% formic acid in distilled deionized water
(DDW) and acetonitrile at a flow rate of 1 mL/min. UV wavelengths employed for the analysis
were 230 nm for BPA and CBZ, and 280 nm for ACN. Prior to HPLC injection, the feed samples
were pre-filtered through 0.22-µm syringe filters made of polyvinylidene fluoride (BPA and CBZ) or
polyethersulfone (ACN).
For measuring much lower permeate concentrations, an LC equipped with a multiple stage/mass
spectrometry detector unit (LC–MS/MS, Agilent 1200, Santa-Clara, CA, USA) coupled to an ion-spray
interface and API 3200 triple quadrupole mass spectrometer was used. The separation column was a
Purospher Star RP-18 (Merck, Darmstadt, Germany) that used a binary gradient of formic acid water
solution (0.1% (v/v)) and methanol for CBZ and ACN and a binary gradient of ammonium hydroxide
water solution (5 mM) and methanol for BPA. Electrospray ionization used positive ion mode for CBZ
and ACN and negative ion mode for BPA. The detection limit of CBZ, ACN and BPA was 5 µg/L.Membranes 2019, 9, 28 6 of 14
The passage (P) and rejection (R) of all tested permeants was calculated as
CP
P = 1−R = , (2)
CF
where CP and CF are the measured permeant concentrations in the permeate and feed, respectively.
Since the measured solute rejection could be affected by concentration polarization in the modules, its
degree during membrane testing was estimated using the concentration polarization factor, defined
as CPF = exp (JV /k), where JV is the measured volume flux and k is the mass transport coefficient.
The mass transfer coefficient for pristine and modified ESPA1 elements was first estimated for NaCl
(kNaCl ) by measuring its passage and flux at different feed flow rates Q. Given that the module geometry
and physical properties were constant, the standard relationship Sh = ARen Sc1/3 [42–45], where Sh, Re,
and Sc are the Sherwood, Reynolds, and Schmidt numbers, respectively, and A and n are constants,
could be reduced to k = A0 Qn , where A0 is constant for a specific solute, and Q is the feed flow
rate. The value for kNaCl was determined from measured dependence of passage on Q and JV using
the method reported by Sutzkover et al. [44], with the value of n = 0.4 reported for spiral-wound
elements [45]. Subsequently, the mass transfer coefficients for micropollutants were computed using
the scaling relation of the boundary diffusion layer model k = kNaCl (rNaCl /rs )2/3 , where the salt Stokes
radius rNaCl is the average of the Stokes radii of Na+ and Cl− ions and rs is the Stokes radius for
organic solutes [46]. The value of rs was computed using the correlation between the molecular weight
(Table 1) and rs [47].
3. Results and Discussion
3.1. Membrane Surface Characteristics, Morphology, and Uniformity
The grafting procedure exploited in this study was similar to the one used in a previous report [35];
however, two important modifications were made. Firstly, the surfactant (Triton X-100) was added to
the modification solution, which was previously shown to facilitate grafting of GMA, reduce required
monomer concentration, and improve the homogeneity of the coating [39]. Secondly, the modification
was performed in cross-flow mode with 35–40% recovery, rather than dead-end mode (100% recovery)
in order to overcome non-uniformity of the coating along the module [35]. The degree and uniformity
of grafting was quantified after autopsy of a modified ESPA1 element and recording ATR-FTIR spectra
at different locations along and across the element, relative to the entry and permeate edge (Figure 3).
The results indicate that the membrane surface was successfully and uniformly modified over the
entire element, while contact angle data also showed a significant increase in surface hydrophobicity.
A recently developed method for the quantitative evaluation of polymer coating thickness using
ATR-FTIR showed that the average DG ~0.12 corresponds to an average grafted layer thickness of
about 35 nm [48].
Figure 4 shows SEM images of the pristine and the modified ESPA1. The change in the surface
morphology caused by the modification is clearly seen in Figure 4b; however, at some locations,
SEM images appeared more similar to the pristine membrane, indicating that the modification
was absent or too thin to change the morphology. On the other hand, each ATR-FTIR result in
Figure 3 represents a much larger surface area (~3 mm2 ) compared to SEM images (~4 × 10⁻⁵ mm2 ).
This suggests that, while the grafting is fairly uniform on the millimeter scale, the coating may vary
in surface coverage and thickness on the micron scale. Nevertheless, if surface modifications mainly
seal microscopic defects in the polyamide layer, as shown previously [25,33], a non-uniform coating
could achieve such sealing and produce the desired improvement in performance as well. Indeed,
the results presented below confirm that the obtained coating significantly improved rejection of all
tested micropollutants.recording ATR-FTIR spectra at different locations along and across the element, relative to the entry
and permeate edge (Figure 3). The results indicate that the membrane surface was successfully and
uniformly modified over the entire element, while contact angle data also showed a significant
increase in surface hydrophobicity. A recently developed method for the quantitative evaluation of
polymer2019,
Membranes coating
9, 28 thickness using ATR-FTIR showed that the average DG ~0.12 corresponds 7to an
of 14
average grafted layer thickness of about 35 nm [48].
0.25 along module 2 mM GMA
across module 2 mM GMA
Degree of grafting
0.2
0.15
0.1
0.05
0
Membranes 2019, 9, x FOR PEER REVIEW 7 of 13
0 0.2 0.4 0.6 0.8 1
and thickness on the micron scale. Nevertheless, Relative location
if surface modifications mainly seal microscopic
defects in the polyamide layer, as shown previously [25,33], a non-uniform coating could achieve
Figure3.3.Degree
Figure Degreeof ofgrafting
grafting(DG)
(DG)ofofESPA1-2521
ESPA1-2521elements
elementsmodified
modifiedwith
withGMA
GMAatatdifferent
differentlocations
locations
such along
sealing and produce the desired improvement in performance as well. Indeed, the results
along(entrance
(entrance(0)(0)
to-exit (1))(1))
to-exit andand
across (permeate
across edge (0)
(permeate edgeto-outer edge (1))
(0) to-outer the element.
edge The element
(1)) the element. The
presented
was below
modified confirm that the obtained coating significantly improved rejection of all tested
element was for 0.5 h using
modified 2 mM
for 0.5 GMA2and
h using mM0.045
GMA mM Triton
and 0.045solution. The error
mM Triton bars The
solution. correspond
error barsto
standard
micropollutants.
corresponddeviations of alldeviations
to standard DG measurements
of all DG for a given location.
measurements for a given location.
Figure 4 shows SEM images of the pristine and the modified ESPA1. The change in the surface
morphology caused by the modification is clearly seen in Figure 4b; however, at some locations, SEM
images appeared more similar to the pristine membrane, indicating that the modification was absent
or too thin to change the morphology. On the other hand, each ATR-FTIR result in Figure 3 represents
a much larger surface area (~3 mm2) compared to SEM images (~4 × 10⁻⁵ mm2). This suggests that,
while the grafting is fairly uniform on the millimeter scale, the coating may vary in surface coverage
Figure 4. SEM images of the pristine ESPA-1 membrane (a), and the membrane taken from modified
Figure 4.
ESPA1-2521 module (b). The modification conditions were as follows: 2 mM GMA with addition of
0.045 mM Triton
Triton (0.5
(0.5 h).
h).
3.2. Membrane Performance
The selected model micropollutants significantly differed in polarity, water solubility, and
molecular weight (see Table 1), especially the organic solutes compared to boric acid. Previous
studies showed that many hydrophobic micropollutants tend to adsorb or dissolve within polyamide
membranes and/or parts of filtration systems and produce artefacts such as superficially high non-
steady-state rejection [2,5,17,19–22,36,49–51]. Therefore, to rule out such overestimates, it was
important to verify that the examined membranes reached a steady-state performance for allMembranes 2019, 9, 28 8 of 14
3.2. Membrane Performance
The selected model micropollutants significantly differed in polarity, water solubility,
and molecular weight (see Table 1), especially the organic solutes compared to boric acid. Previous
studies showed that many hydrophobic micropollutants tend to adsorb or dissolve within polyamide
membranes and/or parts of filtration systems and produce artefacts such as superficially high
non-steady-state rejection [2,5,17,19–22,36,49–51]. Therefore, to rule out such overestimates, it was
important to verify that the examined membranes reached a steady-state performance for all examined
solutes. The time required for reaching steady state was evaluated using a solution containing BPA and
CBZ that was filtered through a pristine ESPA1 element for 12 days, while the pollutant concentration
was monitored in the feed and permeate. During this period, the feed solution was replaced twice
with a fresh one in order to speed up the equilibration.
Figure 5 shows the results obtained for BPA and CBZ during the run. It is seen that the decrease
in the feed concentrations of BPA and CBZ was more significant in the first 24 hours each time
the feed 2019,
Membranes was 9,replaced, and
x FOR PEER then continued to change slowly up to the next replacement, while
REVIEW their
8 of 13
concentrations in the permeate increased steadily, especially in the case of BPA. The results also indicate
that a four-day
indicate that a period wasperiod
four-day about was
sufficient
aboutto sufficient
approach the steady state;
to approach thetherefore, the subsequent
steady state; therefore, tests
the
were performed for this period of time.
subsequent tests were performed for this period of time.
1
Permeate concentration [mg/L]
120 New New
feed
Feed concentration [mg/L]
feed
0.8
80 0.6
0.4
40
0.2
0 0
0 100 200 300
Time [h]
CBZ-Feed BPA-Feed CBZ-Permeate BPA-Permeate
Changesininthe
Figure5.5.Changes
Figure thefeed
feedand
andpermeate
permeateconcentrations
concentrationsofofcarbamazepine
carbamazepine(CBZ)
(CBZ)and
andbisphenol-A
bisphenol-A
(BPA) measured with time for a pristine ESPA1-2521 element. The filled and open symbols represent
(BPA) measured with time for a pristine ESPA1-2521 element. The filled and open symbols represent
thefeed
the feedand
andpermeate
permeateconcentrations,
concentrations,respectively.
respectively.
Figure 6 shows the changes in the permeate concentrations of the tested micropollutants over
Figure 6 shows the changes in the permeate concentrations of the tested micropollutants over
time measured for the GMA-modified and pristine ESPA1-2521 elements. The relatively rapid decrease
time measured for the GMA-modified and pristine ESPA1-2521 elements. The relatively rapid
in the pollutant concentration in the feed over the first six hours of filtration (not shown) could be
decrease in the pollutant concentration in the feed over the first six hours of filtration (not shown)
attributed to sorption, as well as rejection of micropollutants by the membranes. However, after about
could be attributed to sorption, as well as rejection of micropollutants by the membranes. However,
a day, the permeate concentrations stabilized and steady-state rejection could be measured. It is
after about a day, the permeate concentrations stabilized and steady-state rejection could be
also clear that, after reaching the steady state, the modified membrane element showed a higher
measured. It is also clear that, after reaching the steady state, the modified membrane element
micropollutant rejection than the pristine one (see Figure 6). Table 2 summarizes the solute passages
showed a higher micropollutant rejection than the pristine one (see Figure 6). Table 2 summarizes the
and the hydraulic permeabilities (Lp ) measured for the pristine and the modified elements, as the
solute passages and the hydraulic permeabilities (Lp) measured for the pristine and the modified
average of the results obtained during the filtration runs. It is seen that the passage of ACN and BPA
elements, as the average of the results obtained during the filtration runs. It is seen that the passage
through the modified ESPA1 element was two and four times lower compared to the pristine one,
of ACN and BPA through the modified ESPA1 element was two and four times lower compared to
respectively, and the passage of CBZ dropped to an undetectable level.
the pristine one, respectively, and the passage of CBZ dropped to an undetectable level.
Table 2. Passage of carbamazepine (CBZ), bisphenol-A (BPA), and acetaminophen (ACN) and
permeability before and after modification of the ESPA1 element for 0.5 h using 2 mM GMA solution
with added 0.045 mM Triton; n.d.—not determined; DW—deionized water.was then anticipated that such sealing will affect larger solutes more strongly, which is indeed
observed here. Yet, some effect of affinity is seen as well, while comparing BPA and CBZ. These
solutes have a similar size and logKow. However, as phenolic compounds are known to exhibit an
exceptionally high affinity and sorption with polyamide layers [51,52], this factor may be responsible
for the 2019,
Membranes difference
9, 28 and explain the much lower and more difficult-to-stabilize rejection of9 of BPA
14
compared to CBZ.
Permeate concentration [mg/L]
1
0.1
0.01
0.001
0 1 2 3 4
Time [day]
CBZ before mod. BPA before mod. ACN before mod.
CBZ after mod. BPA after mod. ACN after mod.
Figure6.6.Permeate
Figure Permeateconcentrations
concentrationsofofcarbamazepine
carbamazepine(CBZ),
(CBZ),bisphenol-A
bisphenol-A(BPA),
(BPA),andandacetaminophen
acetaminophen
(ACN)
(ACN)measured
measured for
for ESPA1-2521
ESPA1-2521elements
elements before
before and
and after
after modification
modification as as aa function
function of
of time.
time.
Modification was performed for 0.5 h using 2 mM GMA with the addition of 0.045
Modification was performed for 0.5 h using 2 mM GMA with the addition of 0.045 mM Triton. The mM Triton.
The filled
filled andand open
open symbols
symbols represent
represent concentrations
concentrations before
before and and
afterafter modification,
modification, respectively.
respectively. CBZ
CBZ concentration in permeate after modification became undetectably low
concentration in permeate after modification became undetectably low after one day.after one day.
Table 2. Passage of carbamazepine (CBZ), bisphenol-A (BPA), and acetaminophen (ACN) and
Unfortunately,
permeability the
before improvement
and in pollutant
after modification rejection
of the ESPA1 after
element formodification came
0.5 h using 2 mM at the
GMA expense of
solution
reduced flux. For the membrane modules modified in this study,
with added 0.045 mM Triton; n.d.—not determined; DW—deionized water. the drop in membrane water
permeability was significant, when measured with DW (~46%). However for the feed containing
2 h bar
Before/After the decrease in Solute
micropollutants, Passage, was
permeability % more moderate Hydraulic Permeability
(20–25%, Lp , L/m
see Table 2), apparently
Modificaton CBZ/BPA/ACN
as a result of concentration CBZpolarization (see below)ACN
BPA and the effect of DWmicropollutants on membrane
permeability [51–53]. The more significant loss of pure water permeability maySolution then not fully
Before modification
represent the actual drop 0.33 ±in0.06 0.34 ± 0.05in realistic
performance 0.7 ± 0.06operation 6.5conditions.
± 0.05 1.8 ± 0.3since the
Moreover,
After modification n.d. 0.09 ± 0.007 0.41 ± 0.03 3.5 ± 0.1 1.4 ± 0.1
original membrane was a high-flux LPRO membrane, the reduced permeability could still be
acceptable and the permeability–selectivity trade-off could compare well with commercial brackish
waterIt may be noted that
RO membranes (seethe solute passage, both before and after modification, was highest for
below).
ACN,Note whichthatcorrelates with
the results in its smaller
Figure size, be
6 could compared
somewhat to biased
the other solutes (Table
by differences 1). On the
in concentration
other hand, it does not correlate with the smaller value
polarization, which was supposed to become lower after modification, of logK ow , the logarithm of octanol/water
since, in micropollutant
partition
filtrationcoefficient
experiments, (seethe
Table
flux1). The latter
dropped fromparameter
about about was36 shown
L/(m2 h)tofor correlate
pristinewith
elementthe affinity of 2
to 28 L/(m
organic solutes toward
h) for modified element.theHowever,
membrane, thei.e.,
massthetransfer
propensity to adsorb
coefficients or dissolve
evaluated within
using the selective
filtration of NaCl
layer [5,19–21,51]. This suggests that, in the present case, steric effects play a more
solutions indicated that polarization was, in fact, more significant after modification. The reason dominant role thanis
affinity. Previously,
that, after we attributed
modification, due to lower themembrane
improved permeability,
rejection (lower passage)
a smaller feedtoflow
tightening
rate hadand better
to be used
utilization
in order toofkeep
the apolyamide top layer
similar recovery ratebyfor
sealing (“caulking”)
the same less selective
feed pressure (20 bar). As areas (“defects”),
a result, which
concentration
should indiscriminately block non-selective passage and improve rejection of all solutes [25,35,38].
It was then anticipated that such sealing will affect larger solutes more strongly, which is indeed
observed here. Yet, some effect of affinity is seen as well, while comparing BPA and CBZ. These
solutes have a similar size and logKow . However, as phenolic compounds are known to exhibit an
exceptionally high affinity and sorption with polyamide layers [51,52], this factor may be responsible
for the difference and explain the much lower and more difficult-to-stabilize rejection of BPA compared
to CBZ.
Unfortunately, the improvement in pollutant rejection after modification came at the expense
of reduced flux. For the membrane modules modified in this study, the drop in membrane water
permeability was significant, when measured with DW (~46%). However for the feed containingMembranes 2019, 9, 28 10 of 14
micropollutants, the decrease in permeability was more moderate (20–25%, see Table 2), apparently as
a result of concentration polarization (see below) and the effect of micropollutants on membrane
permeability [51–53]. The more significant loss of pure water permeability may then not fully
represent the actual drop in performance in realistic operation conditions. Moreover, since the original
membrane was a high-flux LPRO membrane, the reduced permeability could still be acceptable and the
permeability–selectivity trade-off could compare well with commercial brackish water RO membranes
(see below).
Note that the results in Figure 6 could be somewhat biased by differences in concentration
polarization, which was supposed to become lower after modification, since, in micropollutant filtration
experiments, the flux dropped from about about 36 L/(m2 h) for pristine element to 28 L/(m2 h)
for modified element. However, the mass transfer coefficients evaluated using filtration of NaCl
solutions indicated that polarization was, in fact, more significant after modification. The reason is
that, after modification, due to lower membrane permeability, a smaller feed flow rate had to be used
in order to keep a similar recovery rate for the same feed pressure (20 bar). As a result, concentration
polarization
Membranes factor
2019, 9, x(CPF)
FOR PEERdid not exceed 1.4 for pristine elements, but increased to ~3,10i.e.,
REVIEW of 13about
twofold, after modification, despite lower water permeability. This suggests that the drop in pollutant
polarization factor (CPF) did not exceed 1.4 for pristine elements, but increased to ~3, i.e., about
permeability after modification was even more significant than indicated by Figure 6, if the results are
twofold, after modification, despite lower water permeability. This suggests that the drop in pollutant
corrected for CPF. For instance, the NaCl permeability corrected for CPF dropped by about half after
permeability after modification was even more significant than indicated by Figure 6, if the results
modification, i.e., NaCl rejection increased as well (see below).
are corrected for CPF. For instance, the NaCl permeability corrected for CPF dropped by about half
Membrane elements
after modification, modified
i.e., NaCl with
rejection polyGMA
increased also(see
as well showed
below).improved boron rejection. Figure 7
shows the boron passage
Membrane elementsdata and with
modified the hydraulic
polyGMA also permeability obtained
showed improved for rejection.
boron the pristine
Figureand7 the
modified
showsESPA1-2521 modules,
the boron passage dataalong
and thewith similarpermeability
hydraulic data for some commercial
obtained for the sea water
pristine and(SW)
the and
brackish water
modified (BW) ROmodules,
ESPA1-2521 elementsalongcompiled from data
with similar the literature [33,38,54–56].
for some commercial It is (SW)
sea water seen and
that the
modification of ESPA1 elements resulted in a decrease in boric acid passage, along with a the
brackish water (BW) RO elements compiled from the literature [33,38,54–56]. It is seen that drop in
modification
the water of ESPA1
permeability. elements resulted
However, comparedin a with
decrease
the in boric acid
reported passage, along
performance ofwith a drop in the
commercial BW RO
water permeability. However, compared with the reported performance of commercial BW RO
elements, the GMA-modified module still showed a lower passage of boric acid for a similar hydraulic
elements, the GMA-modified module still showed a lower passage of boric acid for a similar
permeability. In addition, the modification produced a significant reduction in the salt passage through
hydraulic permeability. In addition, the modification produced a significant reduction in the salt
the membrane; 0.25–0.5% NaCl passage was measured for the modified module compared to the
passage through the membrane; 0.25–0.5% NaCl passage was measured for the modified module
typical 0.5–1% to
compared values of BW
the typical RO membranes
0.5–1% values of BWofRO similar permeability
membranes of similar[39].
permeability [39].
75
Commerical
BWRO
60 ESPA1
element
B passage, %
45
30 Element
Commercia modified with
l SWRO GMA
15
0
0 2 4 6 8
Lp (L∙m-2∙h-1∙ bar-1)
Figure 7. Permeability
Figure and
7. Permeability boric
and acid
boric acidpassage
passage of
of commercial seawater
commercial seawater (triangles)
(triangles) andand brackish
brackish waterwater
(squares) reverse osmosis elements, pristine ESPA1 element (diamond), and modified ESPA1
(squares) reverse osmosis elements, pristine ESPA1 element (diamond), and modified ESPA1 element element
(circle). Modification conditions: 2 mM GMA with addition of 0.045 mM Triton, modification time 0.5
(circle). Modification conditions: 2 mM GMA with addition of 0.045 mM Triton, modification time
h.
0.5 h.
4. Conclusions
The presented results demonstrate the feasibility of improving rejection of a wide variety of
micropollutants in commercial RO membrane elements by in situ modification. While tested with
model micropollutant solutions, the modified element showed a moderate (Membranes 2019, 9, 28 11 of 14
4. Conclusions
The presented results demonstrate the feasibility of improving rejection of a wide variety of
micropollutants in commercial RO membrane elements by in situ modification. While tested with
model micropollutant solutions, the modified element showed a moderate (Membranes 2019, 9, 28 12 of 14
10. Nghiem, L.D.; Schäfer, A.I. Critical risk points of nanofiltration and reverse osmosis processes in water
recycling applications. Desalination 2006, 187, 303–312. [CrossRef]
11. Mamo, J.; García-Galán, M.J.; Stefani, M.; Rodríguez-Mozaz, S.; Barceló, D.; Monclús, H.; Rodriguez-Roda, I.;
Comas, J. Fate of pharmaceuticals and their transformation products in integrated membrane systems for
wastewater reclamation. Chem. Eng. J. 2018, 331, 450–461. [CrossRef]
12. Zhao, Y.-Y.; Kong, F.-X.; Wang, Z.; Yang, H.-W.; Wang, X.-M.; Xie, Y.F.; Waite, T.D. Role of membrane
and compound properties in affecting the rejection of pharmaceuticals by different RO/NF membranes.
Front. Environ. Sci. Eng. 2017, 11, 20. [CrossRef]
13. Snyder, S.A.; Adham, S.; Redding, A.M.; Cannon, F.S.; DeCarolis, J.; Oppenheimer, J.; Wert, E.C.; Yoon, Y.
Role of membranes and activated carbon in the removal of endocrine disruptors and pharmaceuticals.
Desalination 2007, 202, 156–181. [CrossRef]
14. Drewes, J.E.; Bellona, C.; Oedekoven, M.; Xu, P.; Kim, T.U.; Amy, G. Rejection of wastewater-derived
micropollutants in high-pressure membrane applications leading to indirect potable reuse. Environ. Prog.
2005, 24, 400–409. [CrossRef]
15. Drewes, J.E.; Heberer, T.; Reddersen, K. Fate of pharmaceuticals during indirect potable reuse. Water Sci.
Technol. 2002, 46, 73–80. [CrossRef] [PubMed]
16. Kimura, K.; Amy, G.; Drewes, J.E.; Heberer, T.; Kim, T.U.; Watanabe, Y. Rejection of organic micropollutants
(disinfection by-products, endocrine disrupting compounds, and pharmaceutically active compounds) by
NF/RO membranes. J. Membr. Sci. 2003, 227, 113–121. [CrossRef]
17. Kiso, Y.; Nishimura, Y.; Kitao, T.; Nishimura, K. Rejection properties of non-phenylic pesticides with
nanofiltration membranes. J. Membr. Sci. 2000, 171, 229–237. [CrossRef]
18. Kiso, Y.; Mizuno, A.; Othman, R.A.A.B.; Jung, Y.J.; Kumano, A.; Ariji, A. Rejection properties of pesticides
with a hollow fiber NF membrane (HNF-1). Desalination 2002, 143, 147–157. [CrossRef]
19. Kimura, K.; Amy, G.; Drewes, J.; Watanabe, Y. Adsorption of hydrophobic compounds onto NF/RO
membranes: An artifact leading to overestimation of rejection. J. Membr. Sci. 2003, 221, 89–101. [CrossRef]
20. Comerton, A.M.; Andrews, R.C.; Bagley, D.M.; Yang, P. Membrane adsorption of endocrine disrupting
compounds and pharmaceutically active compounds. J. Membr. Sci. 2007, 303, 267–277. [CrossRef]
21. Nghiem, L.D.; Schäfer, A. Adsorption and Transport of Trace Contaminant Estrone in NF/RO Membranes.
Environ. Eng. Sci. 2002, 19, 441–451. [CrossRef]
22. Nghiem, L.D.; Schafer, A.I.; Elimelech, M. Pharmaceutical retention mechanisms by nanofiltration
membranes. Environ. Sci. Technol. 2005, 39, 7698–7705. [CrossRef] [PubMed]
23. Nghiem, L.D.; Schäfer, A.I.; Elimelech, M. Removal of natural hormones by nanofiltration membranes:
Measurements, modeling, and mechanisms. Environ. Sci. Technol. 2004, 38, 1888–1896. [CrossRef] [PubMed]
24. Ben-David, A.; Bason, S.; Jopp, J.; Oren, Y.; Freger, V. Partitioning of organic solutes between water and
polyamide layer of RO and NF membranes: Correlation to rejection. J. Membr. Sci. 2006, 281, 480–490.
[CrossRef]
25. Ben-David, A.; Bernstein, R.; Oren, Y.; Belfer, S.; Dosoretz, C.; Freger, V. Facile surface modification of
nanofiltration membranes to target the removal of endocrine-disrupting compounds. J. Membr. Sci. 2010,
357, 152–159. [CrossRef]
26. Yaroshchuk, A.E. Dielectric exclusion of ions from membranes. Adv. Colloid Interface Sci. 2000, 85, 193–230.
[CrossRef]
27. Fridman-Bishop, N.; Tankus, K.A.; Freger, V. Permeation mechanism and interplay between ions in
nanofiltration. J. Membr. Sci. 2018, 548, 449–458. [CrossRef]
28. Lanteri, Y.; Fievet, P.; Szymczyk, A. Evaluation of the steric, electric, and dielectric exclusion model on the
basis of salt rejection rate and membrane potential measurements. J. Colloid Interface Sci. 2009, 331, 148–155.
[CrossRef]
29. Levchenko, S.; Freger, V. Breaking the symmetry: Mitigating scaling in tertiary treatment of waste effluents
using a positively charged nanofiltration membrane. Environ. Sci. Technol. Lett. 2016, 3, 339–343. [CrossRef]
30. Yaroshchuk, A.E. Non-steric mechanisms of nanofiltration: Superposition of Donnan and dielectric exclusion.
Sep. Purif. Technol. 2001, 22–23, 143–158. [CrossRef]
31. Kabay, N.; Bryjak, M.; Hilal, N.; Yoshizuka, K.; Nishihama, S. Boron Separation Processes; Elsevier: Amsterdam,
The Netherlands, 2015.Membranes 2019, 9, 28 13 of 14
32. Prats, D.; Chillon-Arias, M.F.; Rodriguez-Pastor, M. Analysis of the influence of pH and pressure on the
elimination of boron in reverse osmosis. Desalination 2000, 128, 269–273. [CrossRef]
33. Bernstein, R.; Belfer, S.; Freger, V. Toward improved boron removal in RO by membrane modification:
Feasibility and challenges. Environ. Sci. Technol. 2011, 45, 3613–3620. [CrossRef] [PubMed]
34. Ruiz-García, A.; León, F.A.; Ramos-Martín, A. Different boron rejection behavior in two RO membranes
installed in the same full-scale SWRO desalination plant. Desalination 2019, 449, 131–138. [CrossRef]
35. Bernstein, R.; Belfer, S.; Freger, V. Surface modification of dense membranes using radical graft
polymerization enhanced by monomer filtration. Langmuir 2010, 26, 12358–12365. [CrossRef]
36. Kim, J.H.; Park, P.K.; Lee, C.H.; Kwon, H.H. Surface modification of nanofiltration membranes to improve the
removal of organic micro-pollutants (EDCs and PhACs) in drinking water treatment: Graft polymerization
and cross-linking followed by functional group substitution. J. Membr. Sci. 2008, 321, 190–198. [CrossRef]
37. Guo, H.; Deng, Y.; Tao, Z.; Yao, Z.; Wang, J.; Lin, C.; Zhang, T.; Zhu, B.; Tang, C.Y. Does Hydrophilic
Polydopamine Coating Enhance Membrane Rejection of Hydrophobic Endocrine-Disrupting Compounds?
Environ. Sci. Technol. Lett. 2016, 3, 332–338. [CrossRef]
38. Bernstein, R.; Belfer, S.; Freger, V. Improving performance of spiral wound RO elements by in situ concentration
polarization-enhanced radical graft polymerization. J. Membr. Sci. 2012, 405–406, 79–84. [CrossRef]
39. Baransi-Karkaby, K.; Bass, M.; Levchenko, S.; Eitan, S.; Freger, V. Facile modification of reverse osmosis
membranes by surfactant-assisted acrylate grafting for enhanced selectivity. Environ. Sci. Technol. 2017, 51,
2347–2354. [CrossRef] [PubMed]
40. Available online: http://www.lenntech.com/Data-sheets/Hydranautics-ESPA-2521-L.pdf (accessed on
12 February 2019).
41. Staples, C.A.; Dom, P.B.; Klecka, G.M.; Sandra, T.O.; Harris, L.R. A review of the environmental fate, effects,
and exposures of Bisphenol A. Chemosphere 1998, 36, 2149–2173. [CrossRef]
42. Ruiz-Garcia, A.; de la Nuez-Pestana, I. A computational tool for designing BWRO systems with spiral wound
modules. Desalination 2018, 426, 69–77. [CrossRef]
43. Schock, G.; Miquel, A. Mass transfer and pressure loss in spiral wound modules. Desalination 1987, 64,
339–352. [CrossRef]
44. Sutzkover, I.; Hasson, D.; Semiat, R. Simple technique for measuring the concentration polarization level in a
reverse osmosis system. Desalination 2000, 131, 117–127. [CrossRef]
45. Avlonitis, S.; Hanbury, W.T.; Boudinar, M.B. Spiral Wound Modules Performance an Analytical Solution:
Part II. Desalination 1993, 89, 227–246. [CrossRef]
46. Bason, S.; Kedem, O.; Freger, V. Determination of concentration-dependent transport coefficients in
nanofiltration: Experimental evaluation of coefficients. J. Membr. Sci. 2009, 326, 197–204. [CrossRef]
47. Ben-David, A.; Oren, Y.; Freger, V. Thermodynamic factors in partitioning and rejection of organic compounds
by polyamide composite membranes. Environ. Sci. Technol. 2006, 40, 7023–7028. [CrossRef]
48. Bass, M.; Freger, V. Facile evaluation of coating thickness on membranes using ATR-FTIR. J. Membr. Sci. 2015,
492, 348–354. [CrossRef]
49. Verliefde, A.; Cornelissen, E.; Amy, G.; van der Bruggen, B.; van Dijk, H. Priority organic micropollutants in
water sources in Flanders and the Netherlands and assessment of removal possibilities with nanofiltration.
Environ. Pollut. 2007, 146, 281–289. [CrossRef]
50. Zhang, Y.; Causserand, C.; Aimar, P.; Cravedi, J.P. Removal of bisphenol A by a nanofiltration membrane in
view of drinking water production. Water Res. 2006, 40, 3793–3799. [CrossRef]
51. Drazevic, E.; Bason, S.; Kosutic, K.; Freger, V. Enhanced partitioning and transport of phenolic micropollutants
within polyamide composite membranes. Environ. Sci. Technol. 2012, 46, 3377–3383. [CrossRef]
52. Williams, M.E.; Hestekin, J.A.; Smothers, C.N.; Bhattacharyya, D. Separation of Organic Pollutants by
Reverse Osmosis and Nanofiltration Membranes: Mathematical Models and Experimental Verification.
Ind. Eng. Chem. Res. 1999, 38, 3683–3695. [CrossRef]
53. Van der Bruggen, B.; Vandecasteele, C. Flux decline during nanofiltration of organic components in aqueous
solution. Environ. Sci. Technol. 2001, 35, 3535–3540. [CrossRef] [PubMed]
54. Xu, P.; Drewes, J.E.; Heil, D. Beneficial use of co-produced water through membrane treatment:
Technical-economic assessment. Desalination 2008, 225, 139–155. [CrossRef]Membranes 2019, 9, 28 14 of 14
55. Redondo, J.; Busch, M.; de Witte, J.P. Boron removal from seawater using FILMTEC high rejection SWRO
membranes. Desalination 2003, 156, 229–238. [CrossRef]
56. Murray-Gulde, C.; Heatley, J.E.; Karanfil, T.; Rodgers, J.H.; Myers, J.E. Performance of a hybrid reverse
osmosis-constructed wetland treatment system for brackish oil field produced water. Water Res. 2003, 37,
705–713. [CrossRef]
© 2019 by the authors. Licensee MDPI, Basel, Switzerland. This article is an open access
article distributed under the terms and conditions of the Creative Commons Attribution
(CC BY) license (http://creativecommons.org/licenses/by/4.0/).You can also read