Inequality on the Increase: Trajectories of Privilege and Inequality in Madrid - Cogitatio ...
←
→
Page content transcription
If your browser does not render page correctly, please read the page content below

Social Inclusion (ISSN: 2183–2803)
                                                                                    2021, Volume 9, Issue 2, Pages 104–116
                                                                                                 DOI: 10.17645/si.v9i2.3845

Article
Inequality on the Increase: Trajectories of Privilege and Inequality
in Madrid
Daniel Sorando *, Pedro Uceda and Marta Domínguez

TRANSOC–Instituto Complutense de Sociología para el Estudio de las Transformaciones Sociales Contemporáneas,
Complutense University of Madrid, 28223 Madrid, Spain; E-Mails: dsorando@ucm.com (D.S.), puceda@ucm.es (P.U.),
madoming@ucm.es (M.D.)

* Corresponding author

Submitted: 13 November 2020 | Accepted: 8 February 2021 | Published: 13 May 2021

Abstract
In Spain, housing is one of the main axes of social inequality. Its position within Spain’s economic model and welfare sys-
tem is key to understanding why its financialization at the beginning of the 21st century had such different consequences
among residents as well as territorially. In this context, from 2001 to 2011, Madrid became one of the most segregated
metropolitan areas in Europe. This article delves into how both housing and its location organise inequality in different
social spheres and reproduce it over time. To this end, the geography of this inequality is analysed in different social resi-
dential trajectories, along with how segregation produces its own dynamics of inequality. The analysis is based on census
data and applies a combination of factor and cluster analyses. The results reveal important processes of social residential
marginalisation articulated by the interaction between high international immigration and the spatial manifestation of the
housing bubble. The main socio-spatial result of this process is the disappearance of mixed social spaces in Madrid, previ-
ously located in the centre of the city. This dynamic produces opposite territories in terms of advantage and disadvantage
in different spheres linked to social inequality such as education, health, leisure, care and even prejudice. In the process,
impoverished immigrants disperse towards the neighbourhoods that concentrate the greatest disadvantages in each of
these spheres.

Keywords
inequality; Madrid; privilege; residential marginalisation; segregation; social space; vulnerability

Issue
This article is part of the issue “Vicious Circle of Segregation: Understanding the Connectedness of Spatial Inequality
across Generations and Life Domains” edited by Tiit Tammaru (University of Tartu, Estonia), Siiri Silm (University of Tartu,
Estonia), Frank Witlox (Ghent University, Belgium), Maarten van Ham (Delft University of Technology, The Netherlands)
and Madli-Johanna Maidla (University of Tartu, Estonia).

© 2021 by the authors; licensee Cogitatio (Lisbon, Portugal). This article is licensed under a Creative Commons Attribu-
tion 4.0 International License (CC BY).

1. Introduction                                                    sity of residential segregation between socio-economic
                                                                   groups in twelve European capitals, Madrid was situ-
In major European metropolitan areas, residential segre-           ated at intermediate values at the beginning of the 21st
gation between socio-economic groups grew from 2001                century. However, ten years later, it was the most seg-
to 2011 (Tammaru, Marcińczak, van Ham, & Musterd,                  regated metropolitan area. One of the consequences
2016). This dynamic goes hand in hand with an increase             of the increase of segregation is the erosion of con-
in economic inequality (Piketty, 2013). In the case of             tact among unequal social groups. Even though the
the metropolitan area of Madrid, this parallel increase            lines that define the structure of segregation among
was particularly outstanding. According to the compari-            groups (socioeconomic position, ethnic origin, house-
son that Tammaru et al. (2016) made between the inten-             hold cycle) have not changed in contemporary cities,

Social Inclusion, 2021, Volume 9, Issue 2, Pages 104–116                                                                  104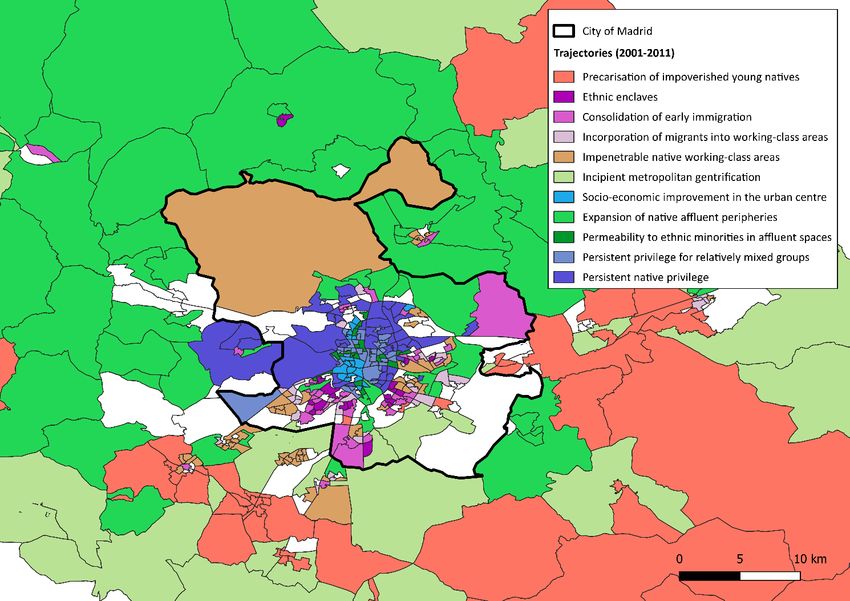
the form of residential segregation has become increas-        cient to understand these relationships in all their com-
ingly more rigid (Marcuse & van Kempen, 2002). In this         plexity. Residential segregation in Southern European
process, socio-spatial processes progressively differen-       cities specifically gave rise to socio-spatial paradoxes that
tiate between dynamic and declining territories, thus          cannot always be understood through such concepts
questioning the existence of mixed social areas (Castells,     (Arbaci, 2019). Noteworthy among these paradoxes is
2003). Therefore, the territories of privilege and vulner-     the unstable relationship between inequality and seg-
ability are consolidated and disconnected socially and         regation, a disparity that has also been observed in
geographically. In this context, previous trajectories of      other contexts (Frey, 2014; Fujita & Hill, 2012). In the
socio-spatial mobility and mixing fade and urban space         case of Southern European cities at the turn of the
fragments into positions without interaction (Kesteloot,       century, several authors pointed to high levels of res-
2005). This socio-spatial division gives rise to unequal       idential marginalisation in contexts with low intensity
socio-economic contexts in different social domains            of residential segregation and an important social mix
which, in turn, condition the individual outcomes of           in their neighbourhoods, from both racial and socio-
its inhabitants (van Ham, Tammaru, & Janssen, 2018).           economic perspectives (Domínguez, Leal, & Martínez,
By this, we do not refer to the effects of the seg-            2012; Malheiros & Fonseca, 2011). Recent research
regation of ethnic and social per se, whose relation-          has demonstrated that this relationship underwent a
ship with social integration remains contested (Musterd,       transformation whereby both social inequality and res-
2003; van Kempen & Bolt, 2012), but to the material            idential segregation increased together once again in
advantages and disadvantages that unequal urban con-           the first decade of the millennium (Sorando & Leal,
texts pose.                                                    2019). Therefore, finding residential segregation does
     The case of Spanish cities during the first decade        not presuppose the discovery of its consequences on
of the century, characterised by heavy suburbanisa-            social inequality. Whether the two phenomena change
tion facilitated by the intense financialization of hous-      together or not, what is revealed is the need to con-
ing, has been analysed in several studies (Antolín-Iria        textualise the relationships between the two concepts.
& Fernández-Sobrado, 2020; Porcel & Antón, 2020;               In short, “rather than being an inevitable outcome or
Rubiales, 2020; Sorando & Leal, 2019). However, the            an organic phenomenon, segregation is the product of,
specific processes of socio-spatial change that sparked        and part of broader mechanisms and structures that
the increase in residential segregation during the first       (re)produce, social inequalities and (un)equal production
decade of the century have not yet been addressed              of space in capitalist societies” (Arbaci, 2019, p. 42).
in-depth, especially regarding these dynamics with a                In the case of Spain, as a variant of the Mediter-
direct impact on its remaining socially mixed territo-         ranean model, the familistic welfare regime gave hous-
ries. Likewise, there is a gap in the empirical study of       ing a key role in the reproduction of its main struc-
the effects of these dynamics on the reproduction of           tures. In this sense, promoting homeownership has been
inequality in and through other spheres such as educa-         an instrument to promote the economy, rather than
tion, health, leisure, care and even prejudice (van Ham        to reduce social inequalities. Specifically, tax relief for
et al., 2018; Wacquant, 2008). These are to be the main        mortgage repayments on primary and secondary homes
contributions made by the present article, tracing the         (which significantly benefits middle and high-income
shifts in the relation between the social and spatial          households) was the traditional instrument of housing
dimensions of inequality over a decade of significant          policy in Southern European countries. Public spending
increases in the financialization of housing. To this end,     on this policy has been applied to the detriment of pub-
the article begins with a review of the relevant litera-       lic support for the working classes regardless of their
ture on the processes of segregation and inequality in         tenancy classification (Allen, Barlow, Leal, Maloutas, &
urban societies in Southern Europe. The research strat-        Padovani, 2004). In societies with pronounced dualism
egy employed is then specified in the methodology sec-         in the labour market where the informal economy occu-
tion. Next, our results reveal the trajectories of privilege   pies an important position, owning a residence is imper-
and vulnerability through which segregation and inequal-       ative for household social security (Castles & Ferrera,
ity have expanded and reproduced across Madrid’s soci-         1996). In this setting, solidarity strategies within the
ety and territory. Finally, the conclusions address the        family are organised around the transmission of prop-
scenario that the analysis poses in the context of the sub-    erty assets across generations, legitimising the aban-
sequent decade.                                                donment of social housing policy. In this regard, it is
                                                               important to point out that two types of social hous-
2. Processes of Segregation and Inequality in Southern         ing have coexisted in Spain. The first type of social hous-
Europe                                                         ing is the so-called viviendas de protección oficial, which
                                                               is destined almost entirely to homeownership and is
The literature on the relationships between social             publicly subsidised through low-interest loans to private
inequality and residential segregation has traditionally       developers. More importantly, low-income households
been dominated by concepts such as the ghetto or               were systematically excluded from the distribution of
the neighbourhood effect, which are sometimes insuffi-         viviendas de protección oficial, for which around 80%

Social Inclusion, 2021, Volume 9, Issue 2, Pages 104–116                                                               105
of households were eligible during the period consid- of Spanish cities are segmented into three of the char-
ered in this article. The second type of social housing acteristic forms taken by the quartered city model: the
corresponds to its common use in the rest of Europe: suburban city, the tenement city of the post-war period
rental social housing (Alberdi, 2014). In 2011, the distri- and the tenement city of the late 20th century. The first
bution of tenure in Spain showed the consequences of is characterised by new middle classes, the second by
this model: 79.6% of households lived in their own home both impoverished migrant populations and traditional
compared to 12.1% who did so in rental housing at mar- working classes, and the third by autochthonous and
ket price, and 2.8% in social rental housing (according ageing households. Lastly, two of the categories from
to data from the Life Conditions Survey; see INE, 2011). the divided city model do not entirely coincide with the
In this context, Spain is the fourth country in the EU social geography of the Community of Madrid. They are
with the lowest percentage of social rental housing, only the ethnic enclave, which appears only partially, and the
above Greece, Luxembourg, and Estonia (Pittini, 2019). abandoned city, which is even more divergent here, as
From the end of the 1990s, the financialization of the presence of the state is common even in the urban
this model expanded to the whole of Spanish society areas of increased social and residential vulnerability.
(Fernandez & Aalbers, 2016; García-Lamarca & Kaika, This scenario is, however, subject to the dynam-
2016). The deregulation of the mortgage markets during ics of socio-spatial change. According to van Ham,
the 1980s and 1990s, in conjunction with the reduction Manley, Bailey, Simpson, and Maclennan (2012), the
in interest rates, allowed the expansion of the mortgage main causes of social change in neighbourhoods are:
supply to sectors with less economic solvency, mainly (1) the behaviour of households that change neighbour-
migrants and young people: “Spanish ‘subprimes’ con- hoods according to their preferences, resources and
sisted in granting at least a million mortgages to vul- restrictions, (2) in-situ changes in the remaining popu-
nerable segments of society between 2003 and 2007” lation (in demographic and socio-economic terms) and
(López & Rodríguez, 2011, p. 20). This promoted residen- (3) external impacts on neighbourhoods (such as struc-
tial mobility until the outbreak of the great financial cri- tural socio-economic change and/or urban regeneration
sis in 2008 (Bayona & Pujadas, 2014). Since then, the operations). In the case of Spanish metropolitan areas,
consequences of this model have made access to hous- the first two factors are related to the underlying char-
ing (both owned and rented) unimaginably difficult for acteristics of their segregation patterns, whereas the
some sections of society. Difficulties in accessing ade- main external impacts involve two interconnected pro-
quate and safe housing are, together with the low quality cesses: the great international migratory flow beginning
of employment, the main paths towards social exclusion at the turn of the century and the different mutations
in Spain. Therefore, social inequality is strongly linked of the financialization of housing in Spain, together with
to the Spanish residential model, due to the overbur- their unequal effect across the territory (Méndez, 2017;
den that housing costs have on the economies of the Rubiales, 2020).
most vulnerable households (FOESSA, 2019). This prob- All these dynamics reconfigure the geography of resi-
lem is serious for the two groups without access to family dential inequality, which has substantial effects on social
assets that were recipients of the subprime mortgages: inequity, as a result of the unequal position of differ-
most migrants (Arbaci, 2019) and many young house- ent urban groups in property market dynamics. However,
holds affected by economic precariousness (Bayrakdar, the manners in which different segregation trajectories
Coulter, Lersch, & Vidal, 2019). In many cases, these reproduce social inequality are much broader. Following
households have been evicted from their mortgaged van Ham et al. (2018), segregation implies exposure
home or have been at risk (Cano, Etxezarreta, Dol, & to differential socio-spatial contexts that have specific
Hoekstra, 2013). In this context, a crucial savings strat- effects on individual achievements and which, in turn,
egy for them is the search for the cheapest housing in condition subsequent residential strategies. These con-
their metropolitan areas, which often involves a process texts include housing and the neighbourhood of resi-
of urban dispersion (Arbaci, 2019). dence, but also places of work, leisure, education, and
The territorial articulation of this welfare regime, in transport. In particular, the concentration of poor hous-
the current context of housing financialization, is based ing in certain neighbourhoods exposes its inhabitants
on the traditional patterns of residential segregation in to risks prevalent in other spheres such as health and
Spanish cities. These trends can be interpreted as a vari- education. In this respect, it makes sense to highlight
ation of the quartered city model proposed by Marcuse three mechanisms for reproducing inequality through
and van Kempen (2000) according to the analysis of the social residential context. Firstly, the lack of available
this phenomenon in the case of Madrid carried out space in overcrowded dwellings is linked to psychological
by Sorando and Uceda (2018). Spanish cities’ main dis- and school problems among children, as a result of the
tinguishing characteristic is the absence of widespread lack of space for study, the impact of high noise levels
abandonment of urban centres, except in working-class on concentration and sleeping difficulties (Solari & Mare,
areas in the process of gentrification. This characteristic 2012). Similarly, residence in buildings without a lift
is crucial because it had given rise to socially mixed urban implies the social and physical isolation of many elderly
centres at the beginning of the century. The peripheries and disabled people. Such isolation has significant effects
Social Inclusion, 2021, Volume 9, Issue 2, Pages 104–116 106on physical and mental health, well-being, and participa- tions, economic activity, type of contract and proximity
tion in social life (Holt-Lunstad, Smith, & Layton, 2010). to the place of work.
Finally, conditions for daily mobility are unevenly dis- Secondly, the group of territories was classified into
tributed across different territories and social groups as seven social residential types (SRT) for each year so that
a result of the segregation of economic activities and the most frequent trajectories between types could then
the unequal ability of households to select their neigh- be determined. To this end, a cluster analysis was applied
bourhood of residence, giving rise to inequalities in many to classify each ATU into an SRT according to its score
areas including welfare, social inclusion and time avail- on each of the factors in the social residential inequal-
ability (Church, Frost, & Sullivan, 2000; Delbosc & Currie, ity index. In this way, the trajectories of each area can be
2011; Kaufmann, Bergman, & Joye, 2004). observed from 2001 to 2011 through the classification
of each ATU into a social residential trajectory according
3. Methodology to its SRT of origin (in 2001) and the SRT it ends up in
(in 2011). Of the 29 existing trajectories, the patterns of
The analysis of the processes of socio-spatial change in the trajectories accounting for over 3% of the total cases
the Community of Madrid from 2001 to 2011 and their were analysed. This involved observing their transforma-
effects on inequality was based on the Population and tion in the social residential inequality index dimensions.
Housing censuses of 2001 and 2011 (INE, 2004, 2013). Lastly, the average for a series of indicators of the spe-
Since the 2011 census was not carried out as a thor- cific processes involved in the reproduction of inequality
ough census (unlike the 2001 census), but rather by linked to residential segregation was obtained in each
means of a sample, this census section cannot be used of these trajectories. These indicators are space avail-
as a territorial unit of analysis. For this reason, the terri- able (average surface area per person), the lack of time
tory analysed has been divided into the largest number (percentage of workers who spend more than one hour
of territorial units possible while maintaining sufficient commuting from their homes to their places of work)
sample sizes to obtain statistically representative infor- and potential physical isolation (percentage of people liv-
mation for 2011. The procedure for drawing up these ing in buildings of more than three floors without a lift).
territorial units followed two criteria: The number of Although these variables were used in the social residen-
grouped census sections was established as eight, given tial inequality index, the objective was to observe how
that the resulting population size (an average of 13,063 their impact varies across different trajectories of social
residents) is the smallest that allows sociodemographic residential inequality.
data to be obtained without high sampling errors, while
the grouping of census sections was carried out following 4. Results
urban planning criteria so that each grouping includes
sections mainly corresponding to the same urban plan- The empirical analysis of resident group settlement in
ning category. To sum up, the 4,271 census sections of the Community of Madrid in 2001 and 2011 confirms
the Community of Madrid in 2011 were grouped into that their spatially differentiated locations are based on
488 aggregated territorial units (ATU), which were sub- social and residential characteristics.
sequently used as a reference to construct the census
section groupings for 2001. 4.1. Dimensions of Social Residential Inequality
Taking this information as a starting point, a three-
stage research strategy was adopted. First, a multidimen- The social residential differentiation between residents
sional index of social residential inequality was devel- in the Community of Madrid is a social process charac-
oped which categorises each territory for both dates. terised by three dimensions that substantiate the classic
To this end, factor analysis was used to synthesise the model of western cities (Hartschorn, 1992) (see Table 1).
different dimensions tracing the structure of territorial Respectively, these factors explain 73.5% and 68.7% of
resource distribution and the risks associated with social the total variance of the set of variables included in 2001
residential inequality. Each factor, therefore, measures and 2011. Also, the adjustment of both models is sat-
a specific latent dimension of inequality at each ATU. isfactory on both dates (with KMO indices of 0.82 in
The aim is to obtain stable factors for 2001 and 2011 2001 and 0.85 in 2011 that confirm the suitability of the
so that each factor can be assumed to measure the data for factor analysis, given the sufficient intercorre-
same dimension in both years. For this investigation, lation between the variables). The first dimension syn-
we chose to include more variables than those of the thesises the socio–economic position of the residents
classic three-factor model (social class, household life of each ATU according to their occupation, their profes-
cycle and ethnic composition) used in the analysis of res- sional situation, and their level of education. This compo-
idential segregation in Western cities (Hartschorn, 1992). nent, to be discussed in more depth below, is connected
Along with the variables that make up these factors, this to some of the specific processes of inequality reproduc-
study incorporated other components that structure set- tion linked to residential segregation: lack of space and
tlement patterns amid increasing uncertainties and pre- time availability, as well as physical isolation. Moreover,
cariousness (Standing, 2011) such as residential condi- this dimension is bipolar, as it is made up of exclusionary
Social Inclusion, 2021, Volume 9, Issue 2, Pages 104–116 107Table 1. Composition of social residential differentiation factors in 2001 and 2011.
F1 F2 F3
Variable 2001 2011 2001 2011 2001 2011
University studies (25–64) −1.0 −1.0
Professionals −0.9 −0.9
No Secondary Education (20–64) 0.9 0.9
Temporary contract 0.9 0.7
Craft and related trades workers 0.9 0.9
Service and sales workers 0.9 0.8
Plant and machine operators and assemblers 0.8 0.8
Inactive persons (45–64) 0.8 0.5
Unemployed persons 0.7 0.8
Average area per occupant −0.7 −0.6
Elementary occupations 0.7 0.8
More than one hour (commuting) 0.6 0.8
No lift (more than 3 floors) 0.5 0.6
Children (0–14) −0.9 −0.9
Home with mortgage −0.9 −0.9
Aged 64 to 74 0.8 0.9
Aged over 75 0.8 0.7
Single mother households 0.8 0.6
Housing paid for 0.7 0.8 −0.5
Rental housing 0.7 0.8
Born abroad (non-OECD) 0.7 0.8
Buildings in poor condition 0.7 0.5
Empty housing 0.6 0.6
Source: Drawn up by the authors based on the 2001 and 2011 Population and Housing censuses (INE, 2004, 2013).
characteristics, in other words, the presence of features (the positive/negative orientation remains unchanged).
of privilege excludes those of vulnerability and vice versa. Thus, we can assume that each of the three dimensions
Thus, socio-economic privilege involves more time avail- of the index measures the same latent concept on both
ability, less difficulty in accessing housing, and more dates and that, therefore this measuring instrument can
space in the home for each inhabitant whereas the oppo- be used to explain the processes of change across time
site is linked to socio-economic vulnerability. and space.
The second dimension (household life cycle) refers
to the type of household that inhabits each ATU. 4.2. Trajectories of Social Residential Change
Specifically, it distinguishes (and mutually excludes, as it (2001–2011)
is also a bipolar component) spaces including ageing and
single-mother households, on the one hand, and spaces For 2001, the areas of the Community of Madrid
where children live in homes that are pending payment were divided into three working-class types and three
(through mortgage credit), on the other. The third com- privileged-class types (according to the origin and age
ponent points to those territories with a high percent- structure of its population, in each type), together with
age of populations born in economically impoverished a socially mixed type (in each of the components of the
countries, which are also characterised by precarious res- social residential inequality index), as shown in Table 2.
idential conditions. This association is linked to the fact This division is based on the average value of each
that the main access to housing is through private rental, socio-residential type in the first dimension (the socio-
due to the conditions imposed by the migratory path of economic position) extracted by factor analysis. In this
these residents and the dynamics of the Spanish hous- regard, a value close to zero in this component indicates a
ing market in the first decade of the 21st century (Leal & socio-economic position similar to that of the metropoli-
Alguacil, 2012). tan area of Madrid as a whole. On the other hand, val-
The stability of these factors from 2001 to 2011 is ues far from zero in this component indicate an impover-
significant here. In this respect, the 23 variables intro- ished socio-economic profile (if it adopts positive values)
duced in the model remain grouped in the same factor in or privileged (if they are negative).
both years. Also, the factorial structure and saturation of In the case of 2011, the SRT differentiate the Madrid
each variable in this dimension are similar in both years region into two variants (according to the diversity of
Social Inclusion, 2021, Volume 9, Issue 2, Pages 104–116 108Table 2. Centre of each SRT in each social residential inequality factor.
Social Residential Type F1 F2 F3 Total
SRT1 Diverse ageing working classes 0.8 0.5 0.6 85
SRT2. Young native working classes 0.7 −1.0 −0.3 84
SRT3. Ageing native working classes 0.6 0.6 −0.8 109
SRT4. Socially and ethnically mixed spaces 0.2 0.4 2.7 25
SRT5. Young upper-middle classes −0.9 −1.5 0.2 71
SRT6. Ageing privileged classes with immigration −1.1 1.0 0.7 53
SRT7. Native privileged classes −1.2 0.5 −0.8 61
Source: Drawn up by the authors based on the 2001 and 2011 Population and Housing censuses (INE, 2004, 2013).
origin of the population, in each case) of the young of the total trajectories: all together constituting 83.0%
working classes, the ageing lower-middle classes and of that total (Table 4).
the upper-middle classes, alongside an axis of privilege These transformation patterns, or trajectories of
(Table 3). The disappearance of the socially and ethni- social-residential inequality, can be classified into three
cally mixed spaces that were identified in 2001 is crucial main types (Table 5), each one characterised by a partic-
in terms of segregation. ular housing dynamic (Table 6).
Overall, a transformation was identified in the social These trajectories can be further expanded on as
residential division of Madrid’s metropolitan space, follows:
through which the consolidation of an axis of privilege
can be observed, along with two types of particularly 1. Trajectories of impoverishment:
disadvantaged space. Certain processes of social change
can be observed in four intermediate spaces. Both stabil- • The precarization of extremely impoverished
ity and change are articulated through the main social young natives [SRT2 to SRT1: 10.5%]: These
residential trajectories in the territory of Madrid from metropolitan and working-class areas are the terri-
2001 to 2011. In concrete, eleven transformation pat- tories where the socio-economic position of their
terns are identified, each of which represents over 3% inhabitants is most precarious. These territories
Table 3. Centre of each SRT for each social residential inequality factor (2011).
Social Residential Type F1 F2 F3 Total
SRT1. Young, native, highly precarious classes 1.1 −0.5 −0.5 80
SRT2. Diverse highly precarious classes 1.0 −0.3 2.0 23
SRT3. Diverse working classes 0.6 0.5 0.6 82
SRT4. Ageing native lower-middle classes 0.4 1.1 −1.0 78
SRT5. Young native upper-middle classes −0.5 −1.5 −0.4 88
SRT6. Diverse upper-middle classes −0.6 0.3 1.6 45
SRT7. Ageing privileged classes −1.3 0.5 −0.1 93
Source: Drawn up by the authors based on the 2001 and 2011 Population and Housing censuses (INE, 2004, 2013).
Table 4. Percentage of ATUs according to their SRT in 2001 and 2011.
2011
SRT1 SRT2 SRT3 SRT4 SRT5 SRT6 SRT7 Total
2001 SRT1 2.5% 3.7% 9.0% 0.8% 1.4% 17.4%
SRT2 10.5% 0.2% 0.2% 0.8% 5.5% 17.2%
SRT3 2.7% 7.2% 12.1% 0.2% 0.2% 22.3%
SRT4 0.8% 0.2% 0.2% 3.9% 5.1%
SRT5 0.8% 0.2% 11.1% 2.5% 14.5%
SRT6 3.7% 7.2% 10.9%
SRT7 0.2% 2.9% 0.2% 9.2% 12.5%
Total 16.4% 4.7% 16.8% 16.0% 17.8% 9.2% 19.1% 100.0%
Source: Drawn up by the authors based on the 2001 and 2011 Population and Housing censuses (INE, 2004, 2013).
Social Inclusion, 2021, Volume 9, Issue 2, Pages 104–116 109Table 5. Social residential inequality index according to the type of social residential trajectory.
F1 F2 F3
Trajectory 2001 2011 2001 2011 2001 2011
Precarization of extremely impoverished young natives 0.9 1.1 −0.9 −0.7 −0.4 −0.6
Ethnic enclaves 1.1 1.0 0.6 −0.2 1.1 2.0
Consolidation of early immigration 0.8 0.7 0.5 0.4 0.4 0.7
Incorporation of migrants into working-class areas 0.6 0.6 0.8 0.7 −0.5 0.5
Impenetrable native working-class areas 0.5 0.6 0.5 1.1 −1.0 −0.9
Incipient metropolitan gentrification 0.5 0.2 −1.2 −1.6 0.0 −0.4
Socio-economic improvement in the urban centre 0.0 −0.5 0.6 0.1 2.7 1.9
Expansion of native affluent peripheries −0.9 −0.8 −1.7 −1.5 0.3 −0.4
Permeability to ethnic minorities in affluent areas −0.8 −0.9 1.0 0.5 1.0 1.4
Persistent privilege for relatively mixed groups −1.3 −1.3 0.9 0.7 0.5 0.4
Persistent native privilege −1.4 −1.3 0.5 0.6 −0.6 −0.5
Total 0.0 0.0 0.0 0.0 0.0 0.0
Source: Drawn up by the authors based on the 2001 and 2011 Population and Housing censuses (INE, 2004, 2013).
are, to a large extent, made up of housing built a rejuvenation of the age structure and a shift in
between 2001 and 2011. As a result, in 2011, peo- the socio-economic structure towards increased
ple living in homes with a mortgage accounted precariousness. A high percentage of the popula-
for 43.1% of the total. Given the social composi- tion residing in these ethnic enclaves lived in rental
tion of these spaces, residential growth during the housing in 2011. This pattern is common to the fol-
said decade was based on the expansion of the lowing two types of trajectories (with a significant
mortgage supply to young native households in presence of migrants). In this regard, the percent-
a precarious economic situation. This configura- age of people living in rental housing is directly pro-
tion has posed a considerable risk of eviction and portional to the intensity of the settlement of the
impoverishment since the bursting of the hous- migrant population.
ing bubble. • The consolidation of early immigration in working-
• The formation of ethnic enclaves [SRT1 to SRT2: class areas [SRT1 to SRT3: 9.0%]: This involves a
3.7%]: These are working-class areas where peo- similar process to those described above but at a
ple of the same ethnic minority come together lower intensity.
in search of social networks, shared services, and • The incorporation of migrants into working-class
a sense of security (Feijten & van Ham, 2009). areas [SRT3 to SRT3: 7.2%]: These are working-
This process was already happening in 2001 and class areas where there was an intense settle-
became consolidated with an intensity that led to ment of impoverished migrants whose presence
Table 6. Relative increase of main dwellings (2001–2011) and tenure structure (2011) according to the type of social resi-
dential trajectory.
Tenure Structure
Increase in Housing Home with Rental
Trajectory Housing paid for Mortgage Housing
Precarization of extremely impoverished young natives 49.2 35,8 43,1 15,2
Ethnic enclaves 14.9 31,5 30,0 29,9
Consolidation of early immigration 9.6 39,5 28,8 22,6
Incorporation of migrants into working-class areas 9.4 44,2 25,4 21,9
Impenetrable native working-class areas 6.2 53,7 25,0 14,5
Incipient metropolitan gentrification 173.9 20,3 59,4 14,8
Socio-economic improvement in the urban centre 25.3 27,6 23,8 37,1
Expansion of native affluent peripheries 153.0 25,0 56,1 14,0
Permeability to ethnic minorities in affluent areas 16.1 33,8 21,8 31,8
Persistent privilege for relatively mixed groups 12.8 37,5 22,8 23,5
Persistent native privilege 18.6 45,2 28,9 15,1
Total 49.1 36,1 37,9 18,2
Source: Drawn up by the authors based on the 2001 and 2011 Population and Housing censuses (INE, 2004, 2013).
Social Inclusion, 2021, Volume 9, Issue 2, Pages 104–116 110was not significant in 2001. These last three trajec- residences (main dwellings increased by 153.0% in
tories reflect processes involving the substitution the period studied, while the percentage of res-
of the Spanish population of lower-middle classes idents in homes with a mortgage in 2011 is the
by impoverished foreign migrants as a result of second-highest among the analysed trajectories).
the opportunities provided by the housing bubble • Permeability to ethnic minorities in affluent areas
to the former and the lack of options of the lat- [SRT6 to SRT6: 3.7%]: The continuation of the pro-
ter (Módenes, 2007). The substitution process is cess of arrival of impoverished migrants to upper-
deduced from the important population change in middle-class affluent territories where a certain
the context of low residential growth. degree of mixing is possible and thus, a process
• Impenetrable native working-class areas [SRT3 of rejuvenation also occurs. Such permeability to
to SRT4: 12.1%]: These are spaces where the migrants finds its conditions of possibility in the
autochthonous working classes, whose socio- significant presence of rental housing in these
economic position is slightly deteriorating, age territories.
in houses in relatively adequate condition, which • Persistent privilege for relatively mixed groups
leads to their anchorage to the territory and [SRT6 to SRT7: 7.2%]: The rejuvenation of the priv-
explains the absence of substitution dynamics ileged population, in social residential terms, in
(Uceda, Sorando, & Leal, 2018). This configuration spaces with a certain degree of ethnic diversity,
makes these the territories with the highest per- also facilitated by a notable stock of rental housing.
centage of people who reside in properties already • Persistent native privilege: [SRT7 to SRT7:
paid for, as well as the spaces with the lowest res- 9.2%]: Ageing of the privileged population in
idential growth between 2001 and 2011. socio–residential terms and homogeneity in its
autochthonous origin. These are territories with
2. Trajectories of gentrification: little residential growth and significant weight of
already paid-for owned homes.
• Incipient metropolitan gentrification [SRT2 to
SRT5: 5.5%]: These are previously precarious The geography of these trajectories confirms the tradi-
metropolitan areas that are being transformed tional (privileged) northwest–southeast (impoverished)
through rejuvenation and a significant improve- axes of the Community of Madrid, and yet it also
ment in the socio-economic conditions of their introduces variants that confirm the dynamic nature of
populations, as a result of processes of new con- unequal socio-spatial configurations (Figure 1). Among
struction (with an increase of 173.9% in the num- these variants, the disappearance of the socially mixed
ber of main dwellings from 2001 to 2011, which spaces in the city centre stands out. The combination of
imply a proliferation of mortgages, placing these the improvement in the socio-economic position of its
territories as those with the highest percentage inhabitants with its central location feeds the hypothesis
of people in dwellings with a mortgage in 2011). of the gentrification of these spaces (Figure 2).
These processes exploit the land regulations pro-
moted by the real estate bubble to capitalise on 4.3. Interlinked Inequalities
new potential income gaps through new-build gen-
trification processes (Davidson & Lees, 2010). Residential segregation processes tend to distribute
• Socio-economic improvement in the urban centre households with disadvantaged socioeconomic status to
[SRT4 to SRT6 3.9%]: These are the areas with residential settings with an unfavourable mix of advan-
the greatest increase in socio-economic position, tages and disadvantages. The analysis of the dimen-
a transformation that brought an end to social sions of social residential inequality has revealed that
and ethnic mixing in 2001. This dynamic is facil- the spaces which concentrate populations in a weaker
itated by major urban regeneration and market- socio-economic position are those whose housing (due
ing processes in this territory, as well as by the to its surface area and conditions of physical access) and
importance of rental housing among its residents. location (in relation to the main centres of employment)
Different case studies on transformations to these constitute a greater disadvantage. Thus, residential seg-
territories point to the gentrification processes as regation, which to a large extent is the result of social
the cause of this change (García-Pérez, 2014). inequality, contributes additional specific mechanisms
towards its own reproduction, in a chain of inequality
3. Trajectories of privilege: processes that takes the form of a vicious circle (van Ham
et al., 2018).
• Expansion of native affluent peripheries [SRT5 to In this respect, the high percentage of residents who
SRT5 11.1%]: These are affluent spaces where the have to spend more than one hour commuting from
main shift relates to the notable decrease in the their homes to work means that in neighbourhoods with
proportion of migrants in rented housing as a the highest concentration of impoverished households,
result of the proliferation of new owner-occupied the time available for activities with the potential to
Social Inclusion, 2021, Volume 9, Issue 2, Pages 104–116 111Figure 1. Main trajectories of social residential change (2001–2011) in the Region of Madrid. Source: Drawn up by the authors based on the 2001 and 2011 Population and Housing censuses (INE, 2004, 2013). Figure 2. Main trajectories of social residential change (2001–2011) in the city of Madrid. Source: Drawn up by the authors based on the 2001 and 2011 Population and Housing censuses (INE, 2004, 2013). Social Inclusion, 2021, Volume 9, Issue 2, Pages 104–116 112
correct socio-economic inequality (such as education or             space are less intense. Gentrification trajectories, on the
family support) as well as the access to key services               other hand, combine advantages with specific disadvan-
and social inclusion mechanisms are reduced (Church                 tages (relating to location in the peripheries, and physi-
et al., 2000). Similarly, the lack of space for activities          cal isolation in the urban centre). Meanwhile, privileged
that require privacy, especially for those related to edu-          trajectories enjoy above-average advantages in terms of
cation and employment, constitutes a barrier to success             each of these mechanisms.
for populations living in neighbourhoods in these areas.
Overcrowded houses involve a lack of space for study,               5. Conclusion
as well as high noise levels with significant impacts on
concentration and sleeping that are related to psycho-              From 2001 to 2011, residential segregation grew in par-
logical and school problems among children (Solari &                allel with social inequality in the Madrid metropolitan
Mare, 2012). This is particularly relevant in the current           area. The results of this article reveal eleven significant
context of the global COVID-19 pandemic, as well as                 trajectories within which different processes of socio-
in the social changes and inequalities it projects into             spatial change have operated, according to the classi-
the future concerning teleworking and online education              fication of van Ham et al. (2012). Overall, during this
(Beaunoyer, Dupéré, & Guitton, 2020). In line with the              period, two external shocks increased residential mobil-
uneven challenges posed by the COVID-19 pandemic, it                ity in the region and explained many of the social resi-
is significant that the partial confinement of the popu-            dential changes: the real estate bubble and the arrival of
lation of the Community of Madrid during the autumn                 significant numbers of international migrants (Bayona &
of 2020 was concentrated in the neighbourhoods in the               Pujadas, 2014).
southeast of the region, where the main trajectories of                  Of all the trajectories of impoverishment, the pro-
impoverishment are to be found. Lastly, physical isola-             cesses of residential mobility in the southeast of the
tion poses a threat to people with reduced mobility in              region stand out: those of young natives towards
the most impoverished neighbourhoods and has signifi-               the newly built peripheries and, to an even greater
cant effects on their physical and mental health.                   extent, those of migrants towards houses abandoned by
     As per the associations observed in the social residen-        autochthonous residents in search of higher quality resi-
tial inequality dimension analysis, trajectories leading to         dential environments. The social residential trajectory of
concentrations of residents in weaker socio-economic                the latter involves a process of centrifugal expulsion from
positions are those in which these specific mechanisms              the city centre into the successive rings of the metropoli-
of inequality reproduction are concentrated (Table 7).              tan areas (Arbaci, 2019). In this context, the only excep-
The distribution of these mechanisms in impoverishment              tion to the residential mobility among the trajectories of
trajectories, however, is not homogeneous. Here the                 impoverishment is the ageing in-situ of native working
accumulation of difficulties in impoverishment trajecto-            classes in those neighbourhoods where residential condi-
ries permeable to the settlement of precarious migrants             tions were acceptable. Regarding the trajectories of gen-
stands out, with particularly high values of physical iso-          trification, residential mobility is stimulated by external
lation which confirm their social residential marginal-             impacts on processes of socio-economic improvement
isation. In contrast, in the rest of the impoverished               in the urban centre (which remove the only remaining
trajectories, characterised by the protagonism of the               spaces of social mixing left in the region) and new-build
autochthonous population, physical isolation and lack of            gentrification in the periphery.

Table 7. Average percentage of the variables of lack of time, available space and physical isolation, according to the trajec-
tory of social residential inequality (2011).
Trajectory                                                       Lack of time        Space Available            Physical Isolation
Precarization of extremely impoverished young natives                15.1                  32.5                       23.2
Ethnic enclaves                                                      12.4                  25.4                       72.1
Consolidation of early immigration                                   14.2                  28.6                       57.3
Incorporation of migrants into working-class areas                   14.7                  28.4                       51.8
Impenetrable native working-class areas                              14.9                  30.3                       35.3
Incipient metropolitan gentrification                                14.7                  36.9                       11.1
Socio-economic improvement in the urban centre                        5.2                  34.3                       37.4
Consolidation of native affluent peripheries                         10.5                  40.8                        8.0
Permeability to ethnic minorities in affluent areas                   8.2                  36.4                       16.1
Persistent privilege for relatively mixed groups                      4.1                  40.7                        9.0
Persistent native privilege                                           9.0                  41.1                        8.7
Total                                                                12.0                  35.1                       27.2
Source: Drawn up by the authors based on the 2001 and 2011 Population and Housing censuses (INE, 2004, 2013).

Social Inclusion, 2021, Volume 9, Issue 2, Pages 104–116                                                                      113
Finally, trajectories of privilege are characterised by Conflict of Interests
the persistence of privilege, based on processes of age-
ing in-situ and residential mobility segmented by socio- The authors declare no conflict of interests.
economic position. In short, the disappearance of spaces
of social mixing is complemented, on the one hand, References
by the expansion of spaces of persistent privilege and,
on the other hand, by the division of the trajectories Alberdi, B. (2014). Social housing in Spain. In K. Scanlon,
of impoverishment according to the residential qual- C. Whitehead, & M. F. Arrigoitia (Eds.), Social housing
ity of each area in the southeast of the region. For in Europe (pp. 223–237). Chichester: John Wiley and
the latter, this division leads migrant households to the Sons.
most disadvantaged environments, where they join the Allen, J., Barlow, J., Leal, J., Maloutas, T., & Padovani,
autochthonous population hardest hit by this social res- L. (2004). Housing and welfare in Southern Europe.
idential model to share in the specific mechanisms of Oxford: Blackwell.
inequality reproduction linked to segregation. In this arti- Antolín-Iria, J. E., & Fernández-Sobrado, J. M. (2020). Seg-
cle, we have investigated some of these mechanisms, regación residencial, políticas de vivienda y rentas
such as time poverty, overcrowding and physical isola- familiares en épocas de transformación urbana: Bil-
tion. Together with these, it is important to point out bao 1991–2011 [Residential segregation, housing
the symbolic mechanisms with the potential to repro- policies and family income in times of urban trans-
duce inequality in the spaces of advanced marginality. In formation: Bilbao 1991–2011]. Ciudad y Territorio,
this regard, the concentration of this regime of poverty 52(205), 529–544. https://doi.org/10.37230/CyTET.
in clearly known and recognised territories produces 2020.205.06
discourses of defamation about these spaces. The con- Arbaci, S. (2019). Paradoxes of segregation: Housing sys-
sequence is the superposition of the neighbourhood tems, welfare regimes and ethnic residential change
taint to the rest of the stigmas assigned on the poverty in Southern European cities. London: Wiley Blackwell.
and ethnic diversity of its inhabitants (Wacquant, 2008). Bayona, J., & Pujadas, I. (2014). Movilidad residencial
Marcuse and van Kempen (2002) argue that spatial divi- y redistribución de la población metropolitana: Los
sions not only reflect the divisions in society, but also casos de Madrid y Barcelona [Residential mobil-
help to create them, given that the decline in social mix- ity and redistribution of the metropolitan popula-
ing fosters prejudices based on the lack of significant tion: The cases of Madrid and Barcelona]. EURE,
daily interactions. 40(119), 261–287. http://dx.doi.org/10.4067/S0250-
According to the results obtained, it is open to new 71612014000100012
research to investigate whether some of the spaces Bayrakdar, S., Coulter, R., Lersch, P., & Vidal, S. (2019).
that host the most precarious socio-residential trajecto- Family formation, parental background and young
ries, with an important role of migrants, such as eth- adults’ first entry into homeownership in Britain and
nic enclaves, could suffer from territorial stigmatisation, Germany. Housing Studies, 34(6), 974–996. https://
redoubling the disadvantages that its inhabitants carry doi.org/10.1080/02673037.2018.1509949
in their daily lives. If we add to this the unequal effects Beaunoyer, E., Dupéré, S., & Guitton, M. J. (2020). COVID-
of the great recession which began in 2008, the scenario 19 and digital inequalities: Reciprocal impacts and
of the following decade entails dynamics of deepening mitigation strategies. Computers in Human Behavior,
inequality, given the concentration of the brunt of the 111. https://doi.org/10.1016/j.chb.2020.106424
recession’s impact in the southeast of Madrid, which Cano, G., Etxezarreta, A., Dol, K., & Hoekstra, J. (2013).
included the largest drops in employment (Rubiales, From housing bubble to repossessions: Spain com-
2016) and property value (Sorando & Leal, 2019), as well pared to other west European countries. Housing
as the evictions (Méndez, 2017). In a context of abandon- Studies, 28(8), 1197–1217. https://doi.org/10.1080/
ment of social housing in the region and a strategic com- 02673037.2013.818622
mitment by financial actors to renting, future research Castells, M. (2003). European cities, the informational
should explore the unequal burden this implies and how society and the global economy. In D. Leon, W. Heine-
it underlines or mitigates the different trajectories of meijer, & D. van Vaart (Eds.), Understanding Amster-
social residential inequality. dam: Essays on economic vitality, city life and urban
form (pp. 1–18). Amsterdam: Het Spinius.
Acknowledgments Castles, F., & Ferrera, M. (1996). Home ownership and
the welfare state: Is Southern Europe different?
Publication of this article was funded by both the South European Society and Politics, 1(2), 163–185.
Spanish Ministry of Science, Innovation and Universities https://doi.org/10.1080/13608749608539470
(CSO2017-83968-R CAMVIVSOC) and the European Church, A., Frost, M., & Sullivan, K. (2000). Transport
Social Fund and the Community of Madrid (H2019/HUM- and social exclusion in London. Transport Policy, 7,
5738 COMURES-CM). We thank the anonymous review- 195–205.
ers for their valuable and constructive comments. Davidson, M., & Lees, L. (2010). New-build gentrifica-
Social Inclusion, 2021, Volume 9, Issue 2, Pages 104–116 114tion: Its histories, trajectories, and critical geogra- detallados [Population and housing census 2011.
phies. Population, Space and Place, 16(5), 395–411. Detailed data; Data set]. Retrieved from https://
https://doi.org/10.1002/psp.584 www.ine.es/censos2011/tablas/Inicio.do
Delbosc, A., & Currie, G. (2011). The spatial con- Kaufmann, V., Bergman, M., & Joye, D. (2004). Motil-
text of transport disadvantage, social exclusion and ity: Mobility as capital. International Journal of Urban
well-being. Journal of Transport Geography, 19(6), and Regional Research, 28(4), 745–756. https://doi.
1130–1137. https://doi.org/10.1016/j.jtrangeo. org/10.1111/j.0309-1317.2004.00549.x
2011.04.005 Kesteloot, C. (2005). Urban socio-spatial configurations
Domínguez, M., Leal, J., & Martínez, E. (2012). The lim- and the future of European cities. In Y. Kazepov (Ed.),
its of segregation as an expression of socioeconomic Cities of Europe: Changing contexts, local arrange-
inequality: The Madrid case. In T. Maloutas & K. ments, and the challenge to urban cohesion (pp.
Fujita (Eds.), Residential segregation in comparative 123–148). London: Routledge.
perspective: Making sense of contextual diversity (pp. Leal, J., & Alguacil, A. (2012). Vivienda e inmigración:
217–236). Farnham: Ashgate. Las condiciones y el comportamiento residencial de
Feijten, P. M., & van Ham, M. (2009). Neighbour- los inmigrantes en España [Housing and immigration:
hood change…reason to leave? Urban Studies, The residential conditions and behaviour of immi-
46, 2103–2122. https://doi.org/10.1177/0042098 grants in Spain]. In E. Aja, J. Arango, & J. Oliver (Eds.),
009339430 La hora de la integración. Anuario de la Inmigración
Fernandez, R., & Aalbers, M. B. (2016). Financialization en España. Edición 2011 [The time of integration.
and housing: Between globalization and varieties Yearbook of immigration in Spain. 2011 edition] (pp.
of capitalism. Competition & Change, 20(2), 71–88. 126–156). Barcelona: Fundación CIDOB.
https://doi.org/10.1177%2F1024529415623916 López, I., & Rodríguez, E. (2011). The Spanish model. New
FOESSA. (2019). VIII Informe sobre exclusión y desarrollo Left Review, 69, 5–29.
social en España [8th report on exclusion and social Malheiros, J. M., & Fonseca, L. (2011). Acesso à habitação
development in Spain]. Madrid: FOESSA. e problemas residenciais dos imigrantes em Portugal
Frey, W. (2014). Diversity explosion: How new racial [Access to housing and residential problems of immi-
demographics are remaking America. Washington, grants in Portugal]. Lisbon: ACIDI–High Commission
DC: Brookings Institution Press. for Immigration and Intercultural Dialogue.
Fujita, K., & Hill, R. C. (2012). Residential income inequal- Marcuse, P., & van Kempen, R. (2000). Globalizing cities:
ities in Tokyo and why it does not translate into A new spatial order? Malden, MA: Blackwell.
class-based segregation. In T. Maloutas & K. Fujita Marcuse, P., & van Kempen, R. (eds.) (2002). Of states
(Eds.), Residential segregation in comparative per- and cities: The partitioning of urban space. Oxford:
spective: Making sense of contextual diversity (pp. Oxford University Press.
37–68). Farnham: Ashgate. Méndez, R. (2017). De la hipoteca al desahucio: Eje-
García-Pérez, E. (2014). Gentrificación en Madrid: De la cuciones hipotecarias y vulnerabilidad territorial en
burbuja a la crisis [Gentrification in Madrid: From España [From mortgage to eviction: Foreclosures
the bubble to the crisis]. Revista de Geografía and territorial vulnerability in Spain]. Revista de
Norte Grande, 58, 71–91. http://dx.doi.org/10.4067/ Geografía Norte Grande, 67, 9–31. http://dx.doi.org/
S0718-34022014000200005 10.4067/S0718-34022017000200002
García-Lamarca, M., & Kaika, M. (2016). ‘Mortgaged Módenes, J. A. (2007). Una visión demográfica de la
lives’: The biopolitics of debt and housing financial- movilidad residencial reciente en España [A demo-
ization. Transactions of the Institute of British Geogra- graphic view of recent residential mobility in Spain].
phers, 41(3), 313–327. https://doi.org/10.1111/tran. In J. M. Feria (Ed.), La vivienda y el espacio residencial
12126 en las áreas metropolitanas [Housing and residential
Hartschorn, T. A. (1992). Interpreting the city: An urban space in metropolitan areas] (pp. 15–32). Sevilla: Cen-
geography. New York, NY: John Wiley. tro de Estudios Andaluces.
Holt-Lunstad, J., Smith, T. B., & Layton, J. B. (2010). Social Musterd, S. (2003). Segregation and integration: A con-
relationships and mortality risk: A meta-analytic tested relationship. Journal of Ethnic and Migration
review. PLoS Medicine, 7. https://doi.org/10.1371/ Studies, 29(4), 623–641. https://doi.org/10.1080/
journal.pmed.1000316 1369183032000123422
INE. (2004). Censo de población y viviendas 2001. Resul- Piketty, T. (2013). Capital in the 21st century. Cambridge,
tados definitivos [Population and housing census MA: Harvard University Press.
2001. Final results; Data set]. Retrieved from https:// Pittini, A. (2019). The state of housing in the EU. Brussels:
www.ine.es/censo/es/inicio.jsp Housing Europe.
INE. (2011). Encuesta de condiciones de vida. Resultados Porcel, S., & Antón, F. (2020). Ciudad postindustrial y
[Life conditions survey. Results; Data set]. Retrieved dinámicas socio-residenciales en España: Un análi-
from https://www.ine.es/jaxiT3/Datos.htm?t=9994 sis comparativo de cinco metrópolis [Post-industrial
INE. (2013). Censo de población y viviendas 2011. Datos city and socio-residential dynamics in Spain: A com-
Social Inclusion, 2021, Volume 9, Issue 2, Pages 104–116 115parative analysis of five metropolises]. Scripta Nova. Sociales, 13(1), 383–410. https://doi.org/10.14198/
Revista Electrónica de Geografía y Ciencias Sociales, OBETS2018.13.1.14
24. https://doi.org/10.1344/sn2020.24.29092 Standing, G. (2011). The precariat: The new dangerous
Rubiales, M. (2016). Territorio y crisis: Impacto territorial class. London: Bloomsbury Academic.
de la crisis económica en las regiones metropolitanas Tammaru, T., Marcińczak, S., van Ham, M., & Mus-
de Madrid y Barcelona [Territory and crisis: Territo- terd, S. (Eds.). (2016). Socio-economic segregation
rial impact of the economic crisis in the metropoli- in european capital cities: East meets West. Oxford:
tan regions of Madrid and Barcelona]. Scripta Nova: Routledge.
Revista electrónica de Geografía y Ciencias sociales, Uceda, P., Sorando, D., & Leal, J. (2018). The diversity of
20(549). https://doi.org/10.1344/sn2016.20.17208 trajectories of large housing estates in Madrid, Spain.
Rubiales, M. (2020). Segregación en las metrópolis In D. Hess, T. Tammaru, & M. van Ham (Eds.), Housing
españolas 2001–2011: Un análisis con detalle territo- estates in Europe: Poverty, ethnic segregation and
rial [Segregation in the Spanish metropolises 2001– policy challenges (pp. 241–262). Dordrecht: Springer.
2011: An analysis with territorial detail]. Documents van Ham, M., Manley, D., Bailey, N., Simpson, L., &
d’Anàlisi Geogràfica, 66(1), 83–105. https://doi.org/ Maclennan, D. (Eds.). (2012). Understanding neigh-
10.5565/rev/dag.581 bourhood dynamics: New insights for neighbourhood
Solari, C. D., & Mare, R. D. (2012). Housing crowd- effects research. Dordrecht: Springer.
ing effects on children’s wellbeing. Social Science van Ham, M., Tammaru, T., & Janssen, H. (2018). A multi-
Research, 41, 464–476. https://doi.org/10.1016/ level model of vicious circles of socio-economic segre-
j.ssresearch.2011.09.012 gation. In OECD (Eds.), Divided cities (pp. 135–153).
Sorando, D., & Leal, J. (2019). Distant and unequal: Paris: OECD Publishing.
The decline of social mixing in Barcelona and van Kempen, R., & Bolt, G. (2012). Social consequences
Madrid. Revista Española de Investigaciones Soci- of residential segregation and mixed neighborhoods.
ológicas, 167, 125–148. http://dx.doi.org/10.5477/ In D. F. Clapham, W. A. V. Clark, & K. Gibb (Eds.), The
cis/reis.167.125 Sage handbook of housing studies (pp. 439–460). Los
Sorando, D., & Uceda, P. (2018). Fragmentos urbanos Angeles, CA: Sage.
después de la burbuja inmobiliaria: El caso de Wacquant, L. (2008). Urban outcasts: A comparative
Madrid [Urban fragments after the real estate bub- sociology of advanced marginality. Cambridge, MA:
ble: The case of Madrid]. OBETS. Revista de Ciencias Polity Press.
About the Authors
Daniel Sorando (PhD) is a Sociologist and an Assistant Professor in the Applied Sociology Department
at Complutense University of Madrid. His research focus is on residential segregation and housing,
with particular attention to gentrification processes and their link to inequality. He is co-author of First
We Take Manhattan: La Destrucción Creativa de las Ciudades [First we take Manhattan: The Creative
Destruction of Cities] (2016).
Pedro Uceda (PhD) is a Sociologist and an Adjunct Professor in the Applied Sociology Department
at Complutense University of Madrid. His research focus is on the right to the city, socio-urban vul-
nerability, and segregation processes. Pedro Uceda has published several articles in peer-reviewed
journals and contributed to different books. He is currently working as a researcher at the Conference
of Spanish University Rectors (CRUE).
Marta Domínguez (PhD) is a Sociologist and an Associate Professor in the Applied Sociology Depart-
ment at Complutense University of Madrid. Her research focus is on vulnerable groups in the city,
public space, gendered cities, urban identity and cultural and urban heritage, and social segrega-
tion processes. She has been Head of different funded research projects, coordinator of the 4Cities
Erasmus Mundus Master, coordinator member of the Urban Sociology Working Group of the Spanish
Federation of Sociology (FES), editor of the peer-reviewed journal Society and Childhood and Head of
the research group GISMAT.
Social Inclusion, 2021, Volume 9, Issue 2, Pages 104–116 116You can also read