Interim ESG performance report - First half year 2021 - Orsted
←
→
Page content transcription
If your browser does not render page correctly, please read the page content below

Interim ESG
performance report
First half year 2021

Interim ESG performance report first half year 2021

Contents
1. Introduction
                                                                  The interim ESG performance report can be downloaded
1.1 CFO’s review                                             3
                                                                  here:
1.2 Taxonomy-eligible KPIs                                   4
                                                                  https://orsted.com/esg-2021-h1
1.3 ESG target overview                                      5
1.4 Overview by business unit                                6
                                                                  Further information
1.5 Overview by country                                      7
                                                                  Group Communication
                                                                  Martin Barlebo
2. Environment
                                                                  +45 99 55 95 52
2.1 Renewable capacity                                       8
2.2 Generation capacity                                      9
                                                                  Investor Relations
2.3 Energy generation                                        10
                                                                  Allan Bødskov Andersen
2.4 Green share of energy generation                         11   +45 99 55 79 96
2.5 Energy business drivers                                  12
2.6 Energy sales                                             13
2.7 Greenhouse gas (GHG) emissions                           14
2.8 Avoided carbon emissions                                 15
2.9 Energy consumption                                       16

3. Social
3.1 Human capital                                            17
3.2 Safety                                                   18

4. Governance
4.1 Supplier due diligence                                   19

Appendix
Accounting policies                                      20

                                                                                                                         2/21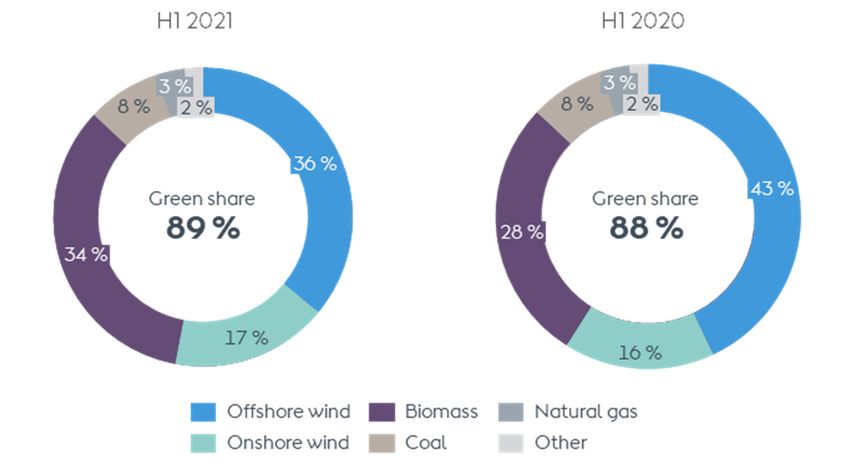
Interim ESG performance report first half year 2021                                                                                                                                Introduction

1.1 CFO’s review
EU taxonomy-eligible revenue                       In May, we commissioned our first large-scale      and power generation from our CHP plants,          not come into force until January 2022, we
                                                   combined solar PV and storage facility, Permian
above 65 % in H1 2021                                                                                 including our coal-fuelled units where we are      have decided to disclose approximate levels
                                                   Energy Center, in Texas. The renewable power       regulatorily obliged to offer our capacity to      for our taxonomy-eligible share of revenue,
–   Acquisition of Brookfield Renewable Ire-       facility consists of a 420 MW solar PV farm and    the market in the most cost-efficient way.         EBITDA, and CAPEX in our H1 2021 reports.
    land, a European onshore platform              a 40 MWac energy storage facility.
                                                                                                      Our scope 1 and 2 greenhouse gas intensity
    Awarded Ocean Wind 2 offshore wind                                                                                                                   The taxonomy-eligible share of our EBITDA
–                                                  Heat and power generation                          decreased by 13 % to 56 g CO2e/kWh in
    contract (1,148 MW) in New Jersey, US                                                                                                                in H1 2021 was above 95 %, the share of
                                                   Offshore wind power generation decreased by        H1 2021. The reasons for this were the same as
                                                                                                                                                         CAPEX was above 99 %, and the share of
–   Green share of heat and power genera-          1 % to 7.1 TWh in H1 2021 compared to H1 2020,     for the increase in the green share of genera-
                                                                                                                                                         revenue was above 65 %. The non-eligible
    tion marginally up at 89 %                     mainly due to significantly lower wind speeds      tion.
                                                                                                                                                         part of our revenue primarily concerned our
    Scope 1 and 2 greenhouse gas intensity         partly offset by generation from Borssele 1 & 2
–                                                                                                     Our scope 3 emissions decreased by 25 % in         long-term legacy activities related to sourc-
    decreased by 13 % to 56 g CO2e/kWh             (commissioned in December 2020).
                                                                                                      H1 2021 compared to H1 2020, mainly due to a       ing and sale of natural gas.
–   Reporting on EU taxonomy-eligible              Onshore wind power generation increased by         27 % decrease in natural gas sales following
                                                                                                                                                         We plan to complete the criteria screening
    revenue, EBITDA, and CAPEX for the first       23 % to 3.3 TWh in H1 2021 compared to H1          the divestment of our LNG activities in 2020.
                                                                                                                                                         before year-end and thus to report on tax-
    time.                                          2020. The increase was mainly due to the new
                                                                                                      New EU sustainability taxonomy                     onomy-aligned shares in our annual reports
                                                   onshore wind farms Sage Draw, Plum Creek,
                                                                                                      The European Commission has established the        for 2021, one year ahead of requirements.
Acquisition                                        and Willow Creek, which were commissioned in
In June, we completed the acquisition of the       Q1 2020, Q2 2020, and Q3 2020, respectively.       EU taxonomy as an important enabler to scale
onshore renewable energy platform                                                                     up sustainable investments and make the EU
                                                   Thermal heat generation increased by 22 % to       carbon-neutral by 2050. At Ørsted, we want to
Brookfield Renewable Ireland (BRI). The acqui-
                                                   5.0 TWh, primarily due to the colder weather in    be a catalyst for change, and are committed
sition marks our entry into the European on-
                                                   H1 2021 compared to H1 2020.                       to taking a leading role in the global green
shore market with a portfolio of 327 MW in
operation and 62 MW under construction.            Thermal power generation increased by 53 %         energy transformation. We therefore welcome
                                                   to 3.8 TWh in H1 2021 compared to H1 2020.         the new reporting framework.
Renewable energy capacity                          The increase was driven by higher power prices     During the year, we assessed which of our ac-
On our Capital Markets Day, 2 June, we pre-        in the spot market together with increased gen-    tivities are included in the taxonomy and there-
sented our updated strategic ambitions. We         eration of combined heat and power driven by       by can be classified as taxonomy-eligible. The
will accelerate our global build-out of renew-     the higher heat demand.                            next step is to ensure that we live up to the
able energy and have set an ambition to
                                                                                                      criteria regarding ‘substantial contribution’
reach approx. 50 GW of installed renewable         Green key performance indicators
                                                                                                      followed by ‘do no significant harm’ (DNSH)
capacity by 2030.                                  Our green share of heat and power generation
                                                                                                      and minimum social safeguards, after which we
                                                   increased by 1 percentage point to 89 % in
In June, we were awarded the 1,148 MW                                                                 can classify our activities as taxonomy-aligned.
                                                   H1 2021 compared to H1 2020. The develop-
Ocean Wind 2 offshore wind contract in New
                                                   ment was primarily due to more wind farms in       Although the upcoming EU requirements for
Jersey, US.
                                                   operation, partly offset by the increase in heat   reporting on taxonomy-eligible activities do

                                                                                                                                                                                                    3/21
Interim ESG performance report first half year 2021                                                                                                                                      Introduction

1.2 Taxonomy-eligible KPIs
EU taxonomy towards a sustainable economy                                                                                                                    Finally, it was related to our fossil-based heat
The objective of the European Green Deal – to                                                                                                                and power generation from the CHP plants,
become the first climate neutral continent by                                                                                                                where coal, natural gas, and oil still account
2050 – requires mobilisation of sustainable                                                                                                                  for 28 % of the fuels used for generation. Coal
investments at scale. To achieve this, the EU                                                                                                                will as planned be phased out completely in
has set out an ambitious regulatory initiative                                                                                                               2023.
to help redirect capital towards sustainable
projects and activities.                                                                                                                                     Taxonomy-eligible EBITDA
                                                                                                                                                             Ørsted’s taxonomy-eligible share of EBITDA in
To define what is ‘sustainable’, the European
                                                                                                                                                             H1 2021 was above 95 % and primarily con-
Commission has developed a catalogue of
                                                                                                                                                             cerned generation of power and related certifi-
economic activities, each with criteria to deter-
                                                                                                                                                             cates/grants from our offshore wind farms, and
mine if they substantially contribute towards a
                                                                                                                                                             construction agreements and divestment gains
sustainable economy – known as the EU tax-
                                                                                                                                                             related to offshore wind farms. Heat and pow-
onomy. Companies across diverse sectors,
                                                                                                                                                             er generation from our CHP plants and our
supply chains, and asset classes must use this
                                                                                                                                                             Onshore business also contributes to the share,
classification system to assess if their business                                                                                                            although to a lesser extent. The non-eligible
activities are sustainable according to the tax-                                                                                                             share primarily concerned the fossil-based part
onomy.                                               Subject to fulfilling certain criteria on substan-   revenue from generation of power and associ-       of our CHP activities and gas sales business.
                                                     tially contributing to at least one environmen-      ated renewable certificates/grants from our
In June 2021, the Commission formally adopted
                                                     tal objective, doing no significant harm (DNSH)      offshore and onshore wind farms. It also includ-   The higher taxonomy-eligible share of EBITDA
the Climate Delegated Act, establishing the
                                                     on the other environmental objectives, and           ed partner revenue from construction, opera-       compared to revenue is primarily due to the
criteria that define which activities substantial-
                                                     complying with minimum social safeguards, the        tion and maintenance, and power sales agree-       nature of our gas business and sale of power to
ly contribute to the first two, out of six, envi-
                                                     activities will be classified as taxonomy-aligned.   ments at our wind farms, as well as biomass-       end customers, which have a significantly low-
ronmental objectives of the taxonomy regula-
                                                                                                          based heat and power generation from our           er margin than our power generation and con-
tion, namely climate change mitigation and
                                                     We disclose approximate levels rather than           Danish CHP plants.                                 struction agreements.
climate change adaptation. The remaining four
                                                     exact numbers to reflect the uncertainty associ-
will follow in 2022.
                                                     ated with the exact interpretation as to what        Our share of taxonomy non-eligible activities      Taxonomy-eligible CAPEX
                                                     extent revenue can be associated with taxono-        revenue was primarily associated with our          Ørsted’s taxonomy-eligible share of invest-
Ørsted’s work with the taxonomy                      my-eligible activities at this time before the       long-term legacy activities related to the         ments in H1 2021 was above 99 % and mainly
During the year, we assessed which of our busi-      reporting obligations have come into force.          sourcing and sale of natural gas. Furthermore,     related to the construction of offshore and
ness activities are listed in the taxonomy and                                                            it covered the sale of power to end customers      onshore wind farms and solar PV assets.
thereby can be classified as ‘taxonomy-              Taxonomy-eligible revenue                            as the retailing of energy is not a taxonomy
eligible’, and have subsequently determined          Ørsted’s share of revenue associated with tax-       activity.
the revenue, EBITDA, and CAPEX (gross invest-        onomy-eligible activities in H1 2021 was above
ments) associated with these activities.             65 %. This proportion predominantly included

                                                                                                                                                                                                          4/21
Interim ESG performance report first half year 2021                                                                                                                                              Introduction

1.3 ESG target overview
Note       Indicator                                                                                           Unit                             Target    H1 2021    H1 2020                Δ        2020
           Strategic targets
2.1        Installed renewable capacity                                                                        MW                      ~50 GW (2030)      12,084       10,460           16 %         11,318
2.1        - Installed offshore wind capacity                                                                  MW      ~15 GW (2025) ,~30 GW (2030)         7,551       6,820            11 %        7,572
2.1        - Installed onshore wind and solar PV capacity                                                      MW                     ~17.5 GW (2030)       2,415       1,565           54 %         1,668
2.1        - Installed other (incl. PtX) capacity                                                              MW                      ~2.5 GW (2030)       2,118       2,075            2%          2,078
2.4        Green share of energy generation                                                                      %                 95 (2023), 99 (2025)       89           88             1%            90
2.7        Scope 1 and 2 greenhouse gas (GHG) intensity                                               g CO2e/kWh                   20 (2023), 10 (2025)
                                                                                                                                                      1       56           64          (13 %)           58
2.7        Scope 3 greenhouse gas emissions                                                    Million tonnes CO2e                        50 % (2032)2        9.9         13.1         (25 %)         25.3
n.a5       Employee satisfaction                                                                       Index 0-100                    Top 10 % (2021)3       n.a.         n.a.              -           78
3.2        Total recordable injury rate (TRIR)                                            Per million hours worked                           2.9 (2025)       3.1          3.7         (16 %)          3.6
           Additional sustainablity targets
2.9        Certified sustainable wooden biomass sourced                                                          %                           100 (2021)      100          100           0 %p           100
2.9        Coal consumption                                                                      Thousand tonnes                               0 (2023)      403          376            7%            629
2.9        Own power consumption covered by renewable energy certificates                                        %                          100 (2021)4      100          100           0 %p           100
n.a.5      Internal energy savings, accumulated from 2018                                                     GWh                             15 (2023)      n.a.         n.a.              -         10.3
n.a.5      Share of electric vehicles                                                                            %                          100 (2025)       n.a.         n.a.              -           38
n.a.   5   Women in leaderhip positions, Leadership Conference                                           % female                             22 (2023)      n.a.         n.a.              -           20
n.a.5      Women in leadership positions, middle management                                              % female                            30 (2023)       n.a.         n.a.              -           26

1In addition to the emission reduction targets, we have a target of being carbon-neutral in 2025. We will continue to investigate solutions for the remaining emissions, which could also include investing
in certified carbon-removal projects.
2   A 50 % reduction in total scope 3 emissions from the base year 2018. In addition, we want our scope 3 emissions to be carbon-neutral by 2040.
3   Our target is to have an employee satisfaction survey result in the top ten percentile every year compared to an external benchmark group.
4   Our target is that our own power consumption is 100 % covered by renewable energy certificates every year.
5   The targets marked with ’n.a.’ in the note column are not reported in the interim reports. They will be reported in the annual report for 2021.

                                                                                                                                                                                                                     5/21
Interim ESG performance report first half year 2021                                                                                                                                 Introduction

1.4 Overview by business unit
                                                                                                                                                                 Other
                                                                                                                                           Bioenergy &       activities/
Note      Indicator                                                                                       Unit    Offshore    Onshore           Other     eliminations     H1 2021   H1 2020        Δ           2020
          Revenue1                                                                                DKK million       22,225       227            12,587          (2,542)    32,497     27,001    20 %        52,601
          EBITDA1                                                                                 DKK million        11,473      406              1,125             55     13,059      9,761    34 %        18,124
2.1       Installed renewable capacity                                                                    MW         7,551      2,455           2,078                  -   12,084     10,460     16 %        11,318
2.1       Decided (FID) renewable capacity (not installed yet)                                            MW         2,220      2,204                2                 -    4,426      3,601     23 %       4,068
2.1       Awarded and contracted renewable capacity (no FID yet)                                          MW        8,687        -                    -                -    8,687      4,996     74 %       4,996
2.1       Total renewable capacity (installed, FID, and awarded/contracted)                               MW        18,458      4,659           2,080                  -    25,197    19,057     32 %      20,382
2.2       Power generation capacity                                                                       MW        3,970       2,400            2,847                 -     9,217     8,155     13 %       8,884
2.2       Heat generation capacity, thermal                                                               MW             0            0         3,486                  -    3,486      3,475      0%        3,487
2.3       Power generation                                                                               GWh        7,070       3,630            3,766                 -   14,466     12,286     18 %      25,424
2.3       Heat generation                                                                                GWh              -            -        5,038                  -    5,038      4,120     22 %           6,671
2.4       Green share of energy generation                                                                   %        100        100                76                0        89         88     1 %p             90
2.7       Scope 1 and 2 greenhouse gas (GHG) emissions                                 Thousand tonnes CO2e             13            0          1,078                 1     1,092     1,052      4%            1,853
2.7       Scope 3 GHG emissions                                                        Thousand tonnes CO2e             82       930             8,853               13     9,878      13,127   (25 %)     25,333
2.7       Scope 1 and 2 GHG emission intensity                                                    g CO2e/kWh             2            0            122                 -       56         64    (13 %)            58
3.1       Number of employees (end of period)                                                             FTEs      3,250        220               971            2,031     6,472      6,731     (4 %)          6,179
3.2       Total recordable injury rate (TRIR)                                 Injuries per million hours worked         3.1          6.3           2.5               1.1       3.1       3.7    (16 %)            3.6
1   2020 financial figures are based on the business perfomance principle.

                                                                                                                                                                                                         6/21
Interim ESG performance report first half year 2021 Introduction
1.5 Overview by country
The Nether- Other
Note Indicator Unit Denmark The UK Germany lands The US Taiwan Poland countries H1 2021 H1 2020 Δ 2020
2.1 Installed renewable capacity MW 3,061 4,400 1,346 752 2,158 45 - 322 12,084 10,460 16 % 11,318
2.1 - Offshore wind power MW 1,006 4,372 1,346 752 30 45 - - 7,551 6,820 11 % 7,572
2.1 - Onshore wind power MW - 5 - - 1,658 - - 322 1,985 1,555 28 % 1,658
2.1 - Solar PV power MW - - - - 430 - - 430 10 4200 % 10
2.1 - Biogas power (Renescience) MW - 3 - - - - - - 3 - - 3
2.1 - Thermal biomass-based heat MW 2,054 - - - - - - - 2,054 2,054 0% 2,054
2.1 - Battery storage MW 1 20 - - 40 - - - 61 21 190 % 21
2.1 Decided (FID) renewable capacity (not installed yet) MW 2 1,382 - - 2,142 900 - - 4,426 3,601 23 % 4,068
2.1 Awarded and contracted renewable capacity (no FID yet) MW - - 1,142 - 4,082 920 2,543 - 8,687 4,996 74 % 4,996
Total renewable capacity (installed, FID, and awarded/
2.1 contracted) MW 3,063 5,782 2,488 752 8,382 1,865 2,543 322 25,197 19,057 32% 20,382
2.2 Power generation capacity MW 3,407 2,331 673 376 2,108 - - 322 9,217 8,155 13 % 8,884
2.2 - Offshore wind MW 563 2,328 673 376 30 - - - 3,970 3,763 6% 4,379
2.2 - Onshore wind MW - - - - 1,658 - - 322 1,980 1,555 27 % 1,658
2.2 - Solar PV MW - - - - 420 - - - 420 - - -
2.2 - Thermal MW 2,844 3 - - - - - - 2,847 2,837 0% 2,847
2.2 Heat generation capacity, thermal MW 3,486 - - - - - - - 3,486 3,475 0% 3,487
2.3 Power generation GWh 4,697 3,852 943 1,286 3,648 - - 39 14,465 12,286 18 % 25,424
2.3 Heat generation GWh 5,038 - - - - - - - 5,038 4,120 22 % 6,671
2.4 Green share of energy generation % 79 100 100 100 100 - - 100 89 88 1 %p 90
Thousand
2.7 Scope 1 and 2 greenhouse gas (GHG) emissions tonnes CO2e 1,080 7 3 2 0 0 0 0 1,092 1,052 4% 1,853
2.7 Scope 1 and 2 GHG emission intensity g CO2e/kWh 111 2 3 1 0 0 0 0 56 64 (13 %) 58
3.1 Number of employees (end of period) FTEs 3,876 1,121 227 56 365 144 251 432 6,472 6,731 (4 %) 6,179
7/21Interim ESG performance report first half year 2021 Environment
2.1 Renewable capacity
Indicator Unit Target H1 2021 H1 2020 Δ 2020
Installed renewable capacity MW ~50 GW (2030) 12,084 10,460 1,624 11,318 Installed offshore wind power
Offshore wind power MW ~30 GW (2030)1 7,551 6,820 731 7,572 In Q2 2021, we aligned the definition of both onshore
and offshore installed wind farm capacity. All assets
Onshore wind power MW ~17.5 GW (2030)2 1,985 1,555 430 1,658
(installed or FID’ed) are from now on reported using
Solar PV power MW Note2 430 10 420 10 nameplate capacity. Previously a few wind farms
Other (incl. PtX) MW ~2.5 GW (2030) 2,118 2,075 43 2,078 were reported using ‘power optimised capacity’ or
‘export cable limit capacity’.
- Biomass, thermal heat MW 2,054 2,054 - 2,054
- Biogas, power MW 3 - 3 3 For awarded or contracted capacity we report
based on ‘granted capacity’.
- Battery storage MW 61 21 40 21
Decided (FID) renewable capacity (not installed yet) MW 4,426 3,601 825 4,068 Furthermore, we have clarified the accounting policy
for calculating the share of the asset’s capacity to
Offshore wind power MW 2,220 3,038 (818) 2,286 be included. The ownership share and the share of
Onshore wind power MW 1,297 103 1,194 665 the EPC role determine the capacity included in
Solar PV power MW 907 420 487 1,077 installed capacity.
Battery storage MW - 40 (40) 40 See accounting principles on page 20 for details.
Hydrogen MW 2 - 2 -
Awarded and contracted (no FID yet) renewable capacity MW 8,687 4,996 3,691 4,996
Offshore wind power MW 8,687 4,996 3,691 4,996
Sum of installed and FID capacity MW 16,510 14,061 2,449 15,386
Sum of installed, FID, and awarded/contracted capacity MW 25,197 19,057 6,140 20,382
1 Additional target is ~15 GW in 2025, 2The 17.5 GW (2025) target is for onshore wind and solar power combined.
Additions for the last 12 months
Q3 2020 Q4 2020 Q1 2021 Q2 2021
Willow Creek, onshore wind (103 MW) Borssele 1 & 2, offshore wind (752 MW) Helena Wind, onshore wind (268 MW) Permian Energy Center, onshore solar (420 MW)
Muscle Shoals, solar (227 MW) Sparta Solar, onshore solar (250 MW) Permian Energy Center, battery storage (40 MW)
Western Trail, onshore wind (367 MW) Renescience, Northwich, biogas (3 MW) Ocean Wind 2, offshore wind (1,148 MW)
H2RES demo project, renewable hydrogen Lincoln Land, onshore wind (302 MW)
Haystack, onshore wind (298 MW) (2 MW)
Old 300, onshore wind (430 MW) Brookfield Renewables, onshore wind (322 MW)
Brookfield Renewables, onshore wind (5 MW)
Installed renewable capacity Brookfield Renewables, onshore wind (62 MW)
Decided (FID) renewable capacity
Awarded and contraced (no FID yet) renewable capacity Baltica 2 & 3, offshore wind (2,543 MW)
8/21Interim ESG performance report first half year 2021 Environment
2.2 Generation capacity
Indicator Unit H1 2021 H1 2020 Δ 2020
Power generation capacity MW 9,217 8,155 1,062 8,884
Offshore wind MW 3,970 3,763 207 4,379
- Denmark MW 563 563 - 563
- The UK MW 2,328 2,342 (14) 2,342
- Germany MW 673 692 (19) 692
- The Netherlands MW 376 136 240 752
- The US MW 30 30 - 30
Onshore wind MW 1,980 1,555 425 1,658
- The US MW 1,658 1,555 103 1,658
- Ireland MW 322 - 322 -
Solar PV, the US MW 420 - 420 -
Thermal MW 2,847 2,837 10 2,847
- Denmark (power plants) MW 2,844 2,837 7 2,844
- The UK (Renescience) MW 3 - 3 3
Heat generation capacity, thermal1 MW 3,486 3,475 11 3,487
Based on biomass MW 2,022 2,054 (32) 2,022
Based on coal MW 1,300 1,300 - 1,300
Based on natural gas MW 1,761 1,774 (13) 1,761
Heat generation capacity, electric MW 25 25 - 25
Power generation capacity, thermal1 MW 2,847 2,837 10 2,847
Based on biomass MW 1,228 1,216 12 1,228
Based on coal MW 991 991 - 991
Based on natural gas MW 995 1,010 (15) 995
Based on biogas (Renescience) MW 3 - 3 3
1Fuel-specific thermal power and heat generation capacities cannot be added to total thermal capacity, as they are defined individually for each fuel type
for our multi-fuel plants. All fuels cannot be used at the same time.
9/21Interim ESG performance report first half year 2021 Environment
2.3 Energy generation
Indicator Unit Q2 2021 Q2 2020 Δ H1 2021 H1 2020 Δ 2020
Power generation GWh 6,010 4,907 22 % 14,465 12,286 18 % 25,424
Offshore wind GWh 2,521 2,580 (2 %) 7,070 7,171 (1 %) 15,248
- Denmark GWh 386 399 (3 %) 932 1,130 (18 %) 2,165
- The UK GWh 1,326 1,664 (20 %) 3,851 4,730 (19 %) 9,456
- Germany GWh 332 420 (21 %) 943 1,182 (20 %) 2,300
- The Netherlands GWh 451 63 616 % 1,286 63 1941 % 1,207
- The US GWh 26 34 (24 %) 58 66 (12 %) 120
Onshore wind GWh 1,660 1,512 10 % 3,259 2,653 23 % 5,731
- The US GWh 1,621 1,512 7% 3,220 2,653 21 % 5,731
- Ireland GWh 39 - - 39 - - -
Solar PV, the US GWh 322 4 7950 % 370 7 5186 % 7
Thermal GWh 1,507 811 86 % 3,766 2,455 53 % 4,438
Heat generation GWh 1,148 977 18 % 5,038 4,120 22 % 6,671
Total heat and power generation GWh 7,158 5,884 22 % 19,503 16,406 19 % 32,095
- Of which thermal heat and power generation GWh 2,655 1,788 48 % 8,804 6,575 34 % 11,109
- Of which thermal heat and power generation % 37 30 7 %p 45 40 5 %p 35
Offshore power generation decreased by 1 % Solar PV power generation increased by
in H1 2021 relative to H1 2020. The decrease 363 GWh due to Permian Energy Center.
was primarily due to lower wind speeds, off-
Thermal power generation was 53 % higher
set by new generation from Borssele 1 & 2
in H1 2021 compared to H1 2020, primarily
(commissioned in Q4 2020) .
due to higher power prices in the spot market
Onshore wind power generation increased by and higher combined heat and power gener-
23 % in H1 2021 relative to H1 2020. The in- ation driven by higher heat demand.
crease was primarily due to additional gener-
Heat generation was 22 % higher in H1 2021
ation from Sage Draw (commissioned in Q1
relative to H1 2020 due to colder weather in
2020), Plum Creek (commissioned in Q2
H1 2021.
2020), and Willow Creek (commissioned in Q3
2020).
10/21Interim ESG performance report first half year 2021 Environment
2.4 Green share of energy generation
Indicator Unit Target Q2 2021 Q2 2020 Δ H1 2021 H1 2020 Δ 2020
Total heat and power generation % 100 100 0 %p 100 100 0 %p 100
- From offshore wind % 35 44 (9 %p) 36 43 (7 %p) 47
- From onshore wind % 23 25 (2 %p) 17 16 1 %p 18
- From sustainable biomass % 29 16 13 %p 34 28 6 %p 24
- From other green energy sources % 6 1 5 %p 2 1 1 %p 1
- From coal % 6 9 (3 %p) 8 8 0 %p 7
- From natural gas % 1 4 (3 %p) 3 3 0 %p 3
- From other fossil energy sources % 0 1 (1 %p) 0 1 (1 %p) 0
Green share of energy generation % 99 (2025)1 93 86 7 %p 89 88 1 %p 90
- Offshore % 100 100 0 %p 100 100 0 %p 100
- Onshore % 100 100 0 %p 100 100 0 %p 100
- Bioenergy & Other % 81 55 26 %p 76 71 5 %p 71
Additional target is 95 % in 2023.
1
Total heat and power generation by energy source, %
The green share of our heat and power gener- The share of coal-based generation was at
ation was 89 % in H1 2021, up 1 percentage the same level in H1 2021 as in H1 2020.
point relative to the same period last year.
We are regulatorily obliged to make all of our
The share of generation from offshore wind energy capacities available to the market in
decreased by 7 percentage points in H1 2021 the most cost-efficient way, and until our coal
as offshore generation was reduced by 1 %, -based generation capacity is fully phased
whereas onshore and thermal generation out in 2023 we may see fluctuations in coal
increased by 23 % and 34 %, respectively. consumption driven by supplier obligations,
market conditions, and weather conditions.
The share of onshore wind generation in-
creased by 1 percentage point due to new
onshore generation capacity in the US (Sage
Draw, Plum Creek, and Willow Creek).
The share of generation based on sustainable
biomass increased by 6 percentage points
due to higher heat generation because of the
cold weather in H1 2021.
11/21Interim ESG performance report first half year 2021 Environment
2.5 Energy business drivers
Indicator Unit Q2 2021 Q2 2020 Δ H1 2021 H1 2020 Δ 2020
Offshore wind We have improved the ac-
curacy of our offshore wind
Availability % 93 95 (2 %p) 94 93 1 %p 94
speed calculations in 2021
Load factor % 29 32 (3 %p) 39 46 (7 %p) 45 and restated 2020 wind
Wind speed m/s 7.8 8.4 (7 %) 9.2 10.4 (12 %) 9.8 speed data to support com-
parison
Wind speed, normal wind year m/s 8.6 8.6 0% 9.8 9.8 0% 9.7
Onshore wind, the US In 2021 we have used an
improved input data set for
Availability % 97 96 1 %p 95 96 (1 %p) 96
calculating wind speeds for
Load factor % 45 49 (4 %p) 45 47 (2 %p) 45 offshore wind farms.
Wind speed m/s 7.3 8.0 (9 %) 7.5 7.8 (4 %) 7.6
Previously individual wind
Wind speed, normal wind year m/s 8.1 8.1 0% 8.0 7.9 1% 7.5 speed measuring points
Onshore wind, Ireland covered several wind farms
Availability % 96 - - 96 - - - and were reported for an
average hub height. Now
Load factor % 17 - - 17 - - -
each offshore wind farm has
Wind speed m/s 5.7 - - 5.7 - - - its own specific wind speed
Other measuring point for the
actual wind farm height.
Degree days, Denmark Number 487 436 12 % 1,812 1,501 21 % 2,432
For comparison reasons we
have also updated the actu-
Offshore wind Onshore wind, the US Onshore wind, Ireland al and normal wind speed
data reported for 2020 using
Offshore wind speeds in H1 2021 were below a Wind speeds in H1 2021 were below a normal We acquired our Irish onshore assets in Q2 2021.
the new more detailed wind
normal wind year and 12 % lower than in H1 wind year and 4 % below H1 2020. speed datasets.
Other
2020.
Availability was 1 percentage point lower than The number of degree days in H1 2021 was 21 %
Availability in H1 2021 was 1 percentage point in H1 2020, and combined with the 4 % lower higher than in H1 2020, indicating that the
higher than in H1 2020. wind speeds, this led to a 2 percentage points weather in H1 2021 was significantly colder than
lower load factor in H1 2021 compared to H1 in H1 2020.
The 12 % lower wind speed and 1 percentage
2020.
point higher availability resulted in a 7 per-
centage point decrease of the load factor in
H1 2021 compared to H1 2020.
12/21Interim ESG performance report first half year 2021 Environment
2.6 Energy sales
Indicator Unit Q2 2021 Q2 2020 Δ H1 2021 H1 2020 Δ 2020
Gas sales TWh 15.1 20.1 (25 %) 34.0 46.7 (27 %) 90.3
Power sales TWh 4.5 5.5 (18 %) 11.4 14.3 (20 %) 29.2
- Green power to end-customers1 TWh 1.1 2.0 (45 %) 2.3 4.3 (47 %) 7.5
- Regular power to end-customers 2 TWh 0.4 0.6 (33 %) 1.4 1.6 (13 %) 2.9
- Power wholesale TWh 3.0 2.9 3% 7.7 8.4 (8 %) 18.8
Power sold with renewable certificates.
1
2 Power sold without renewable certificates.
Gas sales decreased by 27 % to 34.0 TWh in due to lower wind speeds, offset by an in- Gas sales, TWh Power sales, TWh
H1 2021 compared to H1 2020. This was pri- crease in wholesale in the UK after the divest-
marily due to the divestment of the LNG busi- ment of our B2B customers in April 2021. After
ness in December 2020. the divestment, we will for a limited period
continue to sell the same power volumes to
Power sales decreased by 20 % to 11.4 TWh in
the company that acquired our B2B custom-
H1 2021 compared to H1 2020. This was due
ers (i.e. wholesale) instead of selling directly
to a 47 % decrease in green power sales to
to end customers.
end customers to 2.3 TWh in H1 2021, primari-
ly due to the divestment of the Danish B2C
customers in August 2020.
The decrease in power sales in H1 2021 was
also due to a 13 % decrease in regular power
sales to end customers and a 8 % decrease in
power wholesale.
The decrease in power wholesale was primar-
ily due to a decrease in the sale of our part-
ners’ share of generation from our wind farms
13/21Interim ESG performance report first half year 2021 Environment
2.7 Greenhouse gas (GHG) emissions
Indicator Unit Target Q2 2021 Q2 2020 Δ H1 2021 H1 2020 Δ 2020
Direct GHG emissions (scope 1) Thousand tonnes CO2e 364 496 (27 %) 1,091 1,051 4% 1,851
Indirect GHG emissions (scope 2)
Location-based Thousand tonnes CO2e 13 37 (65 %) 28 76 (63 %) 111
Market-based Thousand tonnes CO2e 0 0 - 0 1 (100 %) 2
Indirect GHG emissions (scope 3) Thousand tonnes CO2e 50 % (2032)4 4,615 5,535 (17 %) 9,878 13,127 (25 %) 25,333
- Category 2: Capital goods1 Thousand tonnes CO2e 901 81 1012 % 901 198 355 % 657
- Category 3: Fuel- and energy-related activities 2 Thousand tonnes CO2e 145 520 (72 %) 953 1,352 (30 %) 2,437
- Category 11: Use of sold products3 Thousand tonnes CO2e 3,493 4,886 (29 %) 7,880 11,451 (31 %) 21,980
- Other Thousand tonnes CO2e 76 48 58 % 144 126 14 % 259
Scope 1 and 2 GHG emission intensity
GHG intensity, energy generation g CO2e/kWh 10 (2025)5 51 84 (39 %) 56 64 (13 %) 58
- Offshore g CO2e/kWh 3 2 50 % 2 2 0% 2
- Onshore g CO2e/kWh 0 0 0% 0 0 - 0
- Bioenergy & Other g CO2e/kWh 134 275 (51 %) 122 158 (23 %) 164
CO2e per revenue, Ørsted 6 g CO2e/DKK 27 43 (37 %) 34 39 (13 %) 35
CO2e per EBITDA, Ørsted 6 g CO2e/DKK 44 168 (74 %) 84 108 (22 %) 102
Primary source of emission: 1wind farm suppliers, 2fossil-based power sales, 3natural gas sales.
4 A 50 % reduction in total scope 3 emissions from the base year 2018. In addition, we want our scope 3 emissions to be carbon-neutral by 2040.
Additional target 20 (2023).
5
2020 financial figures are based on the business perfomance principle.
6
Scope 1 ing standstill and shutdown periods at our ly by the 27 % reduction in gas sales. Scope 3 carbon footprint of solar plants is higher than
Scope 1 greenhouse gas (GHG) emissions in- CHP plants and wind farms as well as heat emissions from fuel- and energy-related activi- that of wind farms which explains the signifi-
creased by 4 % from H1 2020 to H1 2021. The and power for office buildings. ties were 30 % lower than in H1 2020 due to cant increase compared to previously report-
main driver was the increase in the use of coal the 13 % reduction in the sale of regular power ed results for capital goods. We will look into
All power purchased and consumed by Ørsted
and natural gas at our power stations in to end customers, partly offset by a 42 % in- improving the scope 3 factors for solar to-
is certified green power, and therefore our
Q1 2021. crease in the use of fuels in our thermal heat wards being more asset-specific.
market-based scope 2 greenhouse gas emis-
and power generation.
Scope 2 sions from power consumption amount to
zero. Scope 3 emissions from capital goods in-
The main source of location-based scope 2 creased by 355 % due to the commissioning of
emissions was power purchased for the gen- Scope 3
Permian Energy Center in Q2 2021. We have
eration of heat in boilers at our CHP plants. Scope 3 greenhouse gas emissions decreased used a conservative generic international
Other sources were power consumption dur- by 25 % from H1 2020 to H1 2021, driven main- scope 3 factor for solar plants. In general, the
14/21Interim ESG performance report first half year 2021 Environment
2.8 Avoided carbon emissions
Indicator Unit H1 2021 H1 2020 Δ 2020
Avoided carbon emissions Million tonnes CO2e 7.5 6.1 23 % 13.1
- From wind generation, offshore Million tonnes CO2e 3.7 3.8 (3 %) 8.1
- From wind and solar generation, onshore Million tonnes CO2e 2.3 1.6 44 % 3.5
- From biomass-converted generation Million tonnes CO2e 1.5 0.7 114 % 1.5
Accumulated avoided carbon emissions from 2006 to present year Million tonnes CO2e 66.1 51.6 28 % 58.6
- From wind generation, offshore Million tonnes CO2e 50.0 42.0 19 % 46.3
- From wind generation, onshore Million tonnes CO2e 8.5 4.3 98 % 6.2
- From biomass-converted generation Million tonnes CO2e 7.6 5.3 43 % 6.1
Carbon emissions from heat and power generation
Carbon emissions from heat and power generation Million tonnes CO2e 1.1 1.0 10 % 1.8
Accumulated (2006 to present year) carbon emissions from heat and power generation Million tonnes CO2e 125.9 124.0 2% 124.8
Compared to H1 2020, the avoided carbon This is the result of our wind-based and sus- Avoided carbon emissions, Carbon emissions,
tainable biomass-converted energy genera- million tonnes CO2e million tonnes CO2e
emissions increased by 23 % due to an in-
crease in onshore wind-based power genera- tion and corresponds to 53 % of the accumu-
tion and biomass-converted energy genera- lated carbon emissions from thermal energy
tion. generation at Ørsted since 2006.
The avoided emissions from sustainable bio-
mass-converted generation increased by
114 % in H1 2021 compared to H1 2020 due to
the increased biomass-based heat generation
in H1 2021.
By H1 2021, we have reached an accumulated
total of 66 million tonnes of avoided carbon
emissions since 2006.
15/21Interim ESG performance report first half year 2021 Environment
2.9 Energy consumption
Indicator Unit Target Q2 2021 Q2 2020 Δ H1 2021 H1 2020 Δ 2020
Direct energy consumption (GHG scope 1) GWh 4,564 2,754 66 % 12,256 8,661 42 % 15,452
Fuel used in thermal heat and power generation GWh 4,520 2,724 66 % 12,177 8,594 42 % 15,306
- Sustainable biomass GWh 3,437 1,117 208 % 8,767 5,250 67 % 9,440
- Coal GWh 0 (2023) 943 1,177 (20 %) 2,712 2,571 5% 4,444
- Natural gas GWh 107 388 (72 %) 637 698 (9 %) 1,229
- Oil GWh 33 42 (21 %) 61 75 (19 %) 193
Other energy usage (oil, gas, and diesel for vessels and cars) GWh 44 30 47 % 79 67 12 % 146
Coal used in thermal heat and power generation Thousand tonnes 0 (2023) 140 172 (19 %) 403 376 7% 629
Certified sustainable wooden biomass sourced % 100 (2020) 100 100 0 %p 100 100 0 %p 100
Indirect energy consumption (GHG scope 2) GWh 74 181 (59 %) 167 377 (56 %) 554
Power sourced for own consumption GWh 72 176 (59 %) 161 365 (56 %) 534
Own power consumption covered by renewable energy certificates % 100 100 100 0 %p 100 100 0 %p 100
Heat sourced for own consumption GWh 2 5 (60 %) 6 12 (50 %) 20
Total direct and indirect energy consumption GWh 4,638 2,935 58 % 12,423 9,038 37 % 16,006
Green share of total direct and indirect energy consumption % 76 44 32 %p 72 62 10 %p 62
Total fuel consumption used for heat and es and higher combined heat and power gener- Power sourced for our own consumption
power generation increased by 42 % in H1 2021 ation due to the colder weather in H1 2021, was 100 % certified renewable, primarily
compared to H1 2020, driven by the 53 % in- partly offset by 20 % lower coal consumption from offshore wind.
crease in thermal power generation and the 22 in Q2 2021 compared to Q2 2020.
% increase in heat generation (see note 2.3).
In H1 2021, 100 % of our wooden biomass was
The consumption of sustainable biomass in- sourced as certified sustainable wooden bio-
creased by 67 % driven by increased heat gen- mass.
eration in H1 2021.
The power sourced for own consumption by
Coal consumption increased by 5 % in H1 2021 Ørsted decreased by 56 % in H1 2021 due to
compared to H1 2020 due to generation at our the divestment of the power distribution busi-
two remaining coal-based units at Esbjerg and ness in Q3 2020, which consumed power to
Studstrup power plants. The increase in coal cover grid losses.
consumption was driven by higher power pric-
16/21Interim ESG performance report first half year 2021 Social
3.1 Human capital
Indicator Unit H1 2021 H1 2020 Δ 2020
Number of employees
Total number of employees (end of period) FTEs 6,472 6,731 (4 %) 6,179
- Denmark FTEs 3,876 4,585 (15 %) 3,854
- The UK FTEs 1,121 1,011 11 % 1,057
- The US FTEs 365 283 29 % 314
- Malaysia FTEs 308 225 37 % 274
- Poland FTEs 251 222 13 % 233
- Germany FTEs 227 214 6% 219
- Taiwan FTEs 144 110 31 % 126
- Other1 FTEs 180 81 122 % 102
Sickness absence % 1.6 2.2 (0.6 %p) 1.9
Turnover, 12 months rolling
Total employee turnover rate % 9.1 10.3 (1.2 %p) 8.4
Voluntary employee turnover rate % 6.2 5.9 0.3 %p 5.0
FTE distribution in other countries: Ireland (72) ,The Netherlands (56), Singapore (25), South Korea (12), Japan (10), and Sweden (5) in H1 2021.
1
The number of employees was 4 % lower at At the end of H1 2021, the total employee Geographical distribution of FTEs, %
the end of H1 2021 compared to H1 2020. The turnover rate decreased by 1.2 percentage
development was primarily impacted by the points to 9.1 %, and the voluntary employee
divestment of the Danish power distribution turnover rate increased by 0.3 percentage
(Radius), residential customer, and city light points to 6.2 % compared to H1 2020.
businesses to SEAS-NVE on 31 August 2020.
Approx. 750 employees were transferred to
SEAS-NVE as part of the transaction, which
was partly offset by an increase in the num-
ber of FTEs in our markets outside Denmark.
17/21Interim ESG performance report first half year 2021 Social
3.2 Safety
12M rolling 12M rolling
Indicator Unit Target H1 2021 H1 2020 Δ H1 2021 H1 2020 Δ 2020
Total recordable injuries (TRIs) Number 35 39 (10 %) 73 103 (29 %) 77
- Own employees Number 16 10 60 % 25 26 (4 %) 19
- Contractor employees Number 19 29 (34 %) 48 77 (38 %) 58
Lost-time injuries (LTIs) Number 17 18 (6 %) 35 45 (22 %) 36
- Own employees Number 8 5 60 % 13 15 (13 %) 10
- Contractor employees Number 9 13 (31 %) 22 30 (27 %) 26
Hours worked Million hours worked 11.4 10.5 9% 22.4 21.7 3% 21.5
- Own employees Million hours worked 5.2 5.5 (5 %) 10.5 10.9 (4 %) 10.8
- Contractor employees Million hours worked 6.2 5.0 24 % 11.9 10.8 10 % 10.7
Total recordable injury rate (TRIR) Per million hours worked 2.9 (2025) 3.1 3.7 (16 %) 3.3 4.7 (30 %) 3.6
TRIR, own employees Per million hours worked 3.0 1.8 67 % 2.4 2.4 0% 1.8
TRIR, contractor employees Per million hours worked 3.1 5.8 (47 %) 4.0 7.1 (44 %) 5.4
Lost-time injury frequency (LTIF) Per million hours worked 1.5 1.7 (12 %) 1.6 2.1 (24 %) 1.7
LTIF, own employees Per million hours worked 1.5 0.9 67 % 1.2 1.4 (14 %) 0.9
LTIF, contractor employees Per million hours worked 1.5 2.6 (42 %) 1.9 2.8 (32 %) 2.4
Fatalities Number 0 0 0% 0 0 0% 0
Permanent disability cases Number 0 0 0% 0 0 0% 0
The overall safety performance developed The total amount of hours worked in H1 2021 Consequently, the total recordable injury
positively in H1 2021 compared to H1 2020. was 9 % higher than in H1 2020. The number rate (TRIR) was 3.1, which was 16 % lower
of hours worked by Ørsted employees in H1 than in H1 2020, and the lost-time injury
Total recordable injuries in H1 2021 decreased
2021 was 5 % lower than in H1 2020, whereas frequency (LTIF) was 1.5, which was 12 %
by 10 % (four recordable injuries less) and lost-
the hours worked by contractor employees lower than in H1 2020.
time injuries decreased by 6 % (one lost-time
increased by 24 %.
injury less) compared to H1 2020.
18/21Interim ESG performance report first half year 2021 Governance
4.1 Supplier due diligence
Indicator Unit H1 2021 H1 2020 Δ 2020
Risk screenings
Risk screenings (all contracts above DKK 3 million) Number 120 212 (43 %) 303
Extended risk screenings (contracts above DKK 3 million) Number 27 56 (52 %) 81
Know-your-counterparty (KYC) screenings Number 686 519 32 % 843
Due diligence activities conducted
Code of conduct (CoC) desktop assessments Number 13 20 (35 %) 45
Code of conduct (CoC) site assessments Number 1 5 (80 %) 6
Health, safety, and environment (HSE) desktop assessments Number 127 145 (12 %) 290
Health, safety, and environment (HSE) site assessments Number 10 10 0% 21
Desktop vessel inspections Number 37 37 0% 58
Physical vessel inspections Number 207 171 21 % 339
The number of screenings and due diligence for US suppliers, partners, and European cus- not impacted by COVID-19 to the same de-
activities conducted is determined by the tomers as well as a strengthened KYC screen- gree as the code of conduct and HSE pro-
schedule of the individual construction pro- ing process. grammes as they were performed by local
jects and the procurement priorities from year inspectors or took place virtually.
The impact of COVID-19 and the restrictions
to year. The results of the assessments are managed
imposed in different countries continue to im-
In H1 2021, 120 risk screenings based on coun- pact the number of code of conduct (CoC) site throughout the different programmes, and
try and category risk were conducted, and a assessments. However, there were 10 health, improvement plans are developed and imple-
further 27 extended risk screenings were car- safety, and environment (HSE) site assessments mented in collaboration with suppliers.
ried out based on additional risk parameters. in H1 2021, unchanged from H1 2020. These
mainly took place virtually.
The number of know-your-counterparty (KYC)
screenings, focusing on supplier’s integrity and Physical vessel inspections increased by 21 %
legal compliance, increased by 32 % in H1 mainly due to our two large projects Hornsea 2
2021 compared to H1 2020. This was due to and Greater Changhua 1 & 2a and many new
an increase in screening activities conducted development projects. Vessel inspections were
19/21Interim ESG performance report first half year 2021 Appendix
Accounting policies
ESG data quality and consolidation For installed renewable thermal capacity, we use Heat and power generation capacity, thermal tion volume on the individual energy sources and fuels
All our ESG data is reported to the same consolida- the heat capacity as heat is the primary outcome of The thermal heat and power generation capacity is are calculated on the basis of the energy sources used
tion system, and we apply the same processes and thermal energy generation, and as bioconversions of a measure of the maximum capability to generate and the energy generated at the different energy
tools to our ESG reporting as to our financial report- the combined heat and power plants are driven by heat and power. plants.
ing. The data is consolidated according to the same heat contracts.
principles as the financial statements. Thus, the The capacity can change over time with plant modi- For combined heat and power (CHP) plants, the share
consolidated ESG performance data comprises the Decided (FID) renewable capacity fications. For each CHP plant, the capacity is given of the specific fuel (e.g. biomass) is calculated relative
parent company Ørsted A/S and subsidiaries con- Decided (FID) capacity is renewable capacity for for generation with the primary fuel mix. Overload is to the total fuel consumption for a given plant or unit
trolled by Ørsted A/S. Data from associates and which a final investment decision (FID) has been not included. within a given time period. The specific fuel share is
joint ventures is not included in the consolidated ESG made. then multiplied by the total heat and power genera-
performance data. Data from acquisitions and di- Fuel-specific capacities measure the maximum ca- tion for the specific plant or unit in the specific period.
vestments is included or excluded from the date of Awarded and contracted renewable capacity pacity using the specified fuel as primary fuel at the The result is the fuel-based generation for the individu-
acquisition or divestment. The awarded renewable capacity is based on the multi-fuel plants. Therefore, the total sum amounts al unit, for example, the biomass-based generation of
capacities which have been awarded to Ørsted in to more than 100 %. heat and power from the CHP plant unit within a given
The scoping and consolidation of health, safety, and auctions and tenders. The contracted capacity is the time period.
environment (HSE) incidents deviate from the princi- capacity for which Ørsted has signed a contract or CHP plants which have been taken out of primary
ples described above. HSE incident data is collected power purchase agreement (PPA) concerning a new operation and put on standby are not included. The percentage share of the individual energy sources
using an operational scope. This means that irre- renewable energy plant. Typically, offshore wind is calculated by dividing the generation from the indi-
spective of our ownership share, we include all inju- farms are awarded, whereas onshore wind farms are 2.3 Energy generation vidual energy source by the total generation.
ries, environmental incidents, hours worked, etc. contracted. We include the full capacity if more Power generation
from all operations where Ørsted is responsible for than 50 % of PPAs or offtake is secured. Power generation from wind farms is determined as The following energy sources and fuels are considered
HSE, including safety for our external suppliers. generation sold. The offshore wind farms Gunfleet as renewable energy: wind, solar PV, biomass, biogas,
Installed storage capacity Sands 1 & 2 and Walney 1 & 2 have been consolidat- and power sourced with renewable energy certifi-
All data presented follows the principles above, The battery storage capacity is included after the ed according to ownership interest. Other wind cates. The following energy sources are considered as
unless otherwise specified in the accounting policy commercial operation date (COD) has been reached. farms, solar farms, and CHP plants are financially fossil energy sources: coal, natural gas, and oil.
for the individual indicator. Accounting policies for The capacity is presented as megawatts of alter- consolidated.
all our ESG data can be found next to each data nating current (MWac). 2.5 Energy business drivers
table in the environmental (E), social (S), and govern- Thermal power generation is determined as net Availability
ance (G) sections. The calculation factors used in this 2.2 Generation capacity generation sold, based on settlements from the Availability is calculated as the ratio of actual produc-
report are listed at the end of the report together Power generation capacity official Danish production database. Data for gener- tion to the possible production, which is the sum of lost
with references. Power generation capacity from offshore wind ation from foreign facilities are provided by the production and actual production in a given period.
farms is calculated and included from the time when operators. The production-based availability (PBA) is impacted by
2.1 Renewable capacity the individual wind turbine has passed a 240-hour grid and wind turbine outages which are technical
Installed renewable capacity test. Generation capacities for onshore wind and Heat generation production losses. PBA is not impacted by market-
The installed renewable capacity is calculated as solar PV are included after COD. Heat (including steam) generation is requested shutdowns and wind farm curtailments as
renewable gross capacity installed by Ørsted. We measured as net output sold to heat customers. this is deemed not to be reflective of site performance,
The offshore wind farms Gunfleet Sands 1 & 2 and but due to external factors.
include all capacities where we had an ownership
Walney 1 & 2 have been consolidated according to
share and an EPC-role (engineering, procurement, 2.4 Green energy share
ownership interest. Other wind farms, solar farms, Total availability is determined by weighting the indi-
and construction) in the project. Capacities from Green energy share
and CHP plants are financially consolidated. vidual wind farm’s availability against the capacity of
acquired companies are added to the installed ca- The green (renewable energy) share of our heat and
pacity. We do not remove installed capacities from power generation and the distribution of the genera- the wind farm.
divested assets or farm-downs because the focus is
on if we installed the assets.
20/21Interim ESG performance report first half year 2021 Appendix
Load factor Energy efficiency, thermal generation scope 3 inventory into 15 subcategories Greenhouse gas emission intensity
The load factor is calculated as the ratio between Energy efficiency is calculated as total thermal heat (C1-C15). Greenhouse gas emission intensity is calculated
actual generation over a period relative to potential and power generation divided by the total energy as total scope 1 and scope 2 (market-based) emis-
generation, which is possible by continuously exploit- content of fuels (lower caloric values) used in the GHG emissions from: sions divided by total heat and power generation,
ing the maximum capacity over the same period. The generation of thermal heat and power. – C1 is categorised spend data multiplied by rele- revenue, and EBITDA, respectively.
load factor is commercially adjusted. Commercially vant spend category-specific emission factors
adjusted means that, for Danish and German offshore 2.6 Energy sales – C2 includes upstream GHG emissions from in- 2.8 Avoided carbon emissions
wind farms, the load factor is adjusted if the offshore Gas and power sales stalled wind farms. Carbon emissions are includ- Avoided carbon emissions
wind farm has been financially compensated by the Sales of gas and power are calculated as physical ed from cradle to operations and maintenance The avoided carbon emissions due to generation
transmission system operators in situations where the sales to retail customers, wholesale customers, and for single wind turbines. Wind farms are included from offshore and onshore wind farms are calculat-
offshore wind farm is available for generation, but the exchanges. Sales are based on readings from Ør- from the month when the wind farm has ed on the basis of the assumption that the genera-
output cannot be supplied to the grid due to mainte- sted's trading systems. Internal sales to Bioenergy reached the commercial operation date (COD) tion from wind farms replaces an equal quantity of
nance or grid interruptions. Wind farms in other coun- are not included in the statement. – C3 is calculated based on actual fuel consump- power generated using fossil fuels.
tries are not compensated for non-access to the grid. tion and power sales multiplied by relevant
2.7 Greenhouse gas (GHG) emissions The carbon emission factor from fossil fuels is calcu-
emission factors. We include all power sales to
New wind turbines are included in the calculation of Direct GHG emissions (scope 1) lated based on an average fossil-fuel mix in the
end customers and use separate emission fac-
availability and load factor once they have passed a The reporting of direct scope 1 emissions is based on specific country. Data is extracted from the Interna-
tors for green and regular power sales
240-hour test for offshore wind turbines and once the the Greenhouse Gas Protocol and covers all direct tional Energy Agency, IEA. Power generation at a
– C4 only includes fuel for helicopter transport.
commercial operation date (COD) has passed for emissions of greenhouse gases from Ørsted: carbon wind farm does not have any direct carbon emis-
Emissions from other transport types are includ-
onshore wind turbines. dioxide, methane, nitrous oxide, and sulphur hexaflu- sions, and no secondary effects are included, from
ed in the emission factors we use for purchased
oride. The direct carbon emissions from the thermal neither CHP plants nor offshore wind farms. The
goods and services
Wind speed heat and power plants are determined on the basis avoided carbon emissions are calculated as the
– C5 is calculated based on actual waste data
Wind speeds for the areas where Ørsted’s offshore of the fuel quantities used in accordance with the EU offshore wind farm’s generation multiplied by the
multiplied by relevant emission factors
and onshore wind farms are located are provided to Emissions Trading System (ETS). Carbon dioxide and emission factor.
Ørsted by an external supplier (except for our new Irish other greenhouse gas emissions outside the EU ETS – C6 is calculated based on mileage allowances
onshore assets where wind speeds are measured on scheme are, for the most part, calculated as energy for employee travel in own cars and GHG emis- The avoided carbon emissions due to the conver-
site). Wind speeds are weighted on the basis of the consumption multiplied by emission factors. sions from plane travel provided by our travel sions of the combined heat and power plants and
capacity of the individual wind farms and consolidat- agent subsequent switch from fossil fuels to biomass are
ed to an Ørsted total for offshore and onshore, re- Indirect GHG emissions (scope 2) – C7 is calculated based on estimates of the dis- calculated on the basis of the energy content of the
spectively. ‘Normal wind speed’ is a historical wind The reporting of indirect scope 2 emissions is based tance travelled and travel type (e.g. car and fuel used at the CHP plants. It is assumed that the
speed average. on the Greenhouse Gas Protocol and includes the train) use of 1 GJ of biomass fuel avoids the use of 1 GJ of
indirect GHG emissions from the generation of pow- – C9 is calculated based on volumes of residual fossil fuels. The upstream carbon emissions (from
Degree days er, heat, and steam purchased and consumed by products, estimated distances transported, and production, manufacture, and transport of biomass)
Degree days are a measure of how cold it has been Ørsted. Scope 2 emissions are primarily calculated relevant GHG emission factors for transport are included in the calculation.
and thus indicate the amount of energy needed to as the power volumes purchased multiplied by – C11 is calculated based on actual sales of gas to
heat a building. The number of degree days helps to country-specific emission factors. Location-based both end users and wholesale as reported in our The following secondary carbon emissions are in-
compare the heat demand for a given year with a emissions are calculated based on average emission ESG consolidation system. The total gas trade is cluded in the calculation:
normal year. factors for each country, whereas market-based divided into natural gas, LNG, and biogas which – Fuel used for production of biomass and conver-
emissions take the green power purchased into have specific up- and downstream emission sion into wood pellets and wood chips.
The number of degree days expresses the difference account and assume that the regular power is deliv- factors. – Fuel used for transport and handling of biomass.
between an average indoor temperature of 17 °C and ered as residual power where the green part has – Back-up fuel used together with biomass fuel at
the outside mean temperature for a given period. The been taken out. The subcategories C8, C10, and C12-C15 are not the power plants.
need for heat increases with the number of degree relevant for Ørsted as we have no greenhouse gas
days. Indirect GHG emissions (scope 3) emissions within these categories. The accounting policies for avoided carbon emis-
The reporting of indirect scope 3 emissions is based
sions follow the principles of the GHG Project Proto-
on the Greenhouse Gas Protocol which divides the
21/21Interim ESG performance report first half year 2021 Appendix
col and the United Nation’s Framework Convention the reporting period. Turnover Risk screenings
on Climate Change (UNFCCC) methodology. The employee turnover rate is calculated as the num- The Responsible Business Partner Programme (RPP)
Certified sustainable wooden biomass sourced must ber of permanent employees who have left the com- team apply a risk-based due diligence framework to
Carbon emissions be certified within at least one of the claim categories pany relative to the average number of permanent identify areas within our code of conduct (CoC) for
Carbon emissions include scope 1 greenhouse gas accepted by the Danish industry agreement on certi- employees in the financial year. business partners where relevant suppliers need to
emissions from thermal heat and power generation. fied biomass. Accepted claim categories are: FSC 100 improve their adherence to the code.
For more details, see ‘2.7 Greenhouse gas emissions’. %, FSC Mix, PEFC 100 %, and SBP compliant. 3.2 Safety
Certified biomass is calculated as the amount of Safety Risk screenings are conducted by RPP based on
2.9 Energy consumption sourced wooden biomass compared to the total Occupational injuries are calculated according to country and category risk on all new sourcing
Direct energy consumption (GHG scope 1) amount of sourced wooden biomass delivered to operational scope. Data from companies wholly or contracts above DKK 3 million. Based on the risk
Includes all energy consumption, including energy individual CHP plants within the reporting period. partly owned by Ørsted, and where Ørsted is responsi- screening evaluation, RPP conducts extended risk
consumption that leads to scope 1 greenhouse gas ble for safety, is included. Occupational injuries and screenings of selected contracts with additional
emissions. Energy consumption includes all fuels Indirect energy consumption (GHG scope 2) lost-time injuries are calculated for both our own em- parameters. Screenings and extended screenings
used at CHP plants (lower caloric values) and other Heat and power purchased and consumed by Ørsted ployees and our suppliers. Data from all Ørsted loca- also take place for coal and biomass suppliers and
energy usage (oil, natural gas, and diesel). is reported for CHP plants, other facilities, and adminis- tions are recognised. top-spend suppliers.
trative buildings. Heat and power consumption ex-
Fuels used in thermal heat and power generation cludes consumption of own generated heat and pow- The lost-time injury frequency (LTIF) is calculated as The Business Ethics Compliance (BEC) team also
Fuels used in thermal heat and power generation at er at the CHP plants. For consumption related to ad- the number of lost-time injuries per one million hours conduct know-your-counterparty (KYC) screenings
the power stations are the total of each fuel type ministration and other processes, we calculate direct worked. The number of hours worked is based on of all new suppliers and business partners to ensure
used for both heat and power generation. consumption on the basis of invoices. 1,667 working hours annually per full-time employee legal compliance.
and monthly records of the number of employees
Sustainable biomass covers all kinds of sustainable Green share of total energy consumption converted into full-time employees. For suppliers, the Risk-screened procurement spend and KYC-
biomass-based fuels used in thermal generation, The green share is calculated as renewable energy actual number of hours worked is recognised on the screened procurement spend are both calculated on
including wood pellets, wood chips, straw, bio oil, sourced (biomass and certified green power) for own basis of data provided by the supplier, access control an annual basis for the reporting year.
and sunflower husk pellets. consumption divided by total energy sourced for own systems at locations, or estimates.
consumption. Due diligence activities conducted
Other energy usage LTIF includes lost-time injuries defined as injuries that Due diligence activities are carried out by our RPP,
Other energy usage covers usage of oil, natural gas, 3.1 Human capital result in an incapacity to work for one or more calen- Health, Safety, and Environment (HSE), and Marine
and diesel. This consumption covers, for example, oil Employees dar days in addition to the day of the incident. Inspection teams, based on the results of individual
for small power generators at building sites, gas Our reporting covers contractually employed employ- In addition to lost-time injuries, TRIR also includes screening and risk assessments.
consumption for heating, and diesel for vessels and ees in all Ørsted companies where Ørsted holds an injuries where the injured person is able to perform
cars. Emissions from flaring and venting carried out ownership interest of more than 50 %. Employees in restricted work the day after the accident as well as The activities are conducted either as desktop
for safety or similar purposes are included. For gas associates are not included. accidents where the injured person has received medi- assessments or inspections or as on-site assessments
treatment and gas storage facilities, the amounts cal treatment. or physical inspections which often include a visit to
are calculated on the basis of pressure and the di- Employee data is recognised based on records from their production facilities by Ørsted or a third party.
mensions of the process equipment that is emptied the Group’s ordinary registration systems. The number Fatalities are the number of employees who lost their
as well as by means of accredited measuring of the of employees is determined as the number of employ- lives as a result of a work-related incident. Permanent Assessments also include potential suppliers (i.e. no
continuous safety flaring. ees at the end of each month converted to full-time disability cases are injuries resulting in irreversible dam- signed contracts yet) as part of the tender process.
equivalents (FTEs). age with permanent impairment which is not expected
Certified sustainable wooden biomass sourced to improve.
Certified sustainable biomass is defined as wooden Employees who have been made redundant are rec-
biomass, i.e. wood pellets and wood chips. Biomass ognised until the expiry of their notice period, regard- 4.1 Supplier due diligence
is measured as sourced wooden biomass delivered less of whether they have been released from all or ESG supplier and business partner due diligence is
to individual combined heat and power plants within some of their duties during their notice period. carried out by different departments at Ørsted.
22/21You can also read


