Investor Presentation - FY2022 First Quarter
←
→
Page content transcription
If your browser does not render page correctly, please read the page content below

Investor
Presentation
FY2022 First Quarter

                       1
Steelcase Q1, 2022
Investment thesis
We believe the office will continue to be
very relevant for innovation, culture, and
collaboration
Industry leader in a changing workplace
environment that we believe provides
growth opportunities
Experienced management team has led
the company through similar previous
cycles
Liquidity position is very strong
2
Steelcase Q1, 2022

We are a respected leader
— Greatest global market share
— $2.6 billion revenue in FY2021
— $185 million adjusted EBITDA in FY2021
— 2.6x total debt/adjusted EBITDA (FY2021 year-end)
— ~11,100 employees (FY2021 year-end)
— ~800 Steelcase dealer locations
— Recognized for innovative design, sustainability leadership and civic engagement
    — Named one of the World’s Most Admired Companies by Fortune for fifteen years
    — Seven-time perfect score recipient of the Human Rights Campaign's Best Places to Work for LGBTQ Equality
    — Named a 2020 Most Responsible Company by Newsweek
    — Recognized by WSJ as a Most Sustainably-Managed Company in 2020
    — Multinational Finalist in the Circulars Awards from the World Economic Forum for circular economy leadership
    — The Steelcase Flex Collection™ received a Product Design Award in the prestigious Red Dot Awards
                                                                                                                     https://webreprints.djre
    — 2019 Breakfast of Corporate Champions recognition for gender parity on our board of directors                  prints.com/57699.html

                                                                                                                         3
Steelcase Q1, 2022

We have a proven track record of managing through a cycle

Adjusted Operating
 Income (Million)                                                                                                                                        Revenue (Billion)
  $300                                                                                                                                  $3.7B                      $4.0

         $3.4B
                                                                                                                                                                   $3.5
  $250
                                                                                                          $3.0B                                  $2.6B             $3.0

  $200
                                 $2.3B                                                                                                                             $2.5

  $150                           Financial                                                                                                      COVID-19           $2.0
                                   crisis                                                                                                       Pandemic
                                                                                                                                                                   $1.5
  $100

                                                                                                                                                                   $1.0

   $50
                                                                                                                                                                   $0.5

    $0                                                                                                                                                             $-
           FY08       FY09       FY10        FY11   FY12        FY13       FY14       FY15         FY16    FY17      FY18        FY19    FY20     FY21     TFQ*
                                                           Adjusted Operating Income ($ Million)           Revenue ($ Billion)
 * TFQ: Trailing Four Quarters
                                                                                                                                                                          4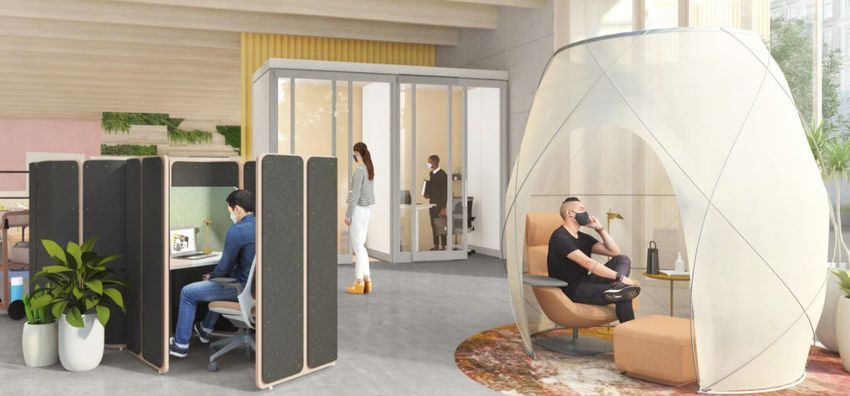
Steelcase Q1, 2022

Our global scale makes us a preferred partner for leading organizations

   STEELCASE Q1 FY22 SEGMENT REVENUE (%)                           GLOBAL OFFICE FURNITURE MARKET REVENUE* ($ IN BILLIONS)
                                           $3.0

              Other
                                           $2.5
             Category
               10%
                                           $2.0

      EMEA
       22%                                 $1.5

                          Americas
                            68%            $1.0

                                           $0.5

                                            $-
                                                     Steelcase       Herman Miller        Haworth           Kokuyo**          HNI**   Knoll
                                             *Most recently published trailing four quarters data and/or internal estimates
                                             **Only furniture segments included
                                                                                                                                              5
Steelcase Q1, 2022

Our global capability allows us to serve customers wherever they are

~800 Steelcase
dealer locations

Over 65 locations
in 17 countries

15 Manufacturing
locations,
including
8 outside North
America

                     WorkLife   Manufacturing   Business     Learning     Sales     Distribution   Innovation
                     Centers      Facilities    Centers    + Innovation   Offices    Centers         Centers
                                                             Centers

                                                                                                                6
Steelcase Q1, 2022

We employ user-based research to drive innovation
                                                Develop insights on work,              Provide products, strategies
   Create a robust research network
                                                workers and the workplace                and customer solutions

   Select Research Partners
   — Center for Healthcare Design – Built
     Environment Network
   — G3ict
   — Huddly
   — IFTF Institute of the Future                         Six-step research
   — Illinois Institute of Technology,                   and design process
     Institute of Design
   — MaRS Innovation Hub
   — Microsoft (Research, Global Real
     Estate and Envisioning Group)
   — Oregon Institute of Technology
   — Philips (Virtual Care)
   — Signify (UVC air purification)
   — Spectrum Health                                                    Sneeze cloud
   — University of Florida Health                                       particle
   — Université Gustave Eiffel                                          transmission
   — University of Melbourne
   — Virginia Tech
   — MIT (Fluid Dynamics of Disease
     Transmission Lab, Pathogen             Example of
     research)                              research
                                            leading to
                                            insights                                                                  7
Steelcase Q1, 2022

Our brands serve leading organizations by creating places that amplify
the performance of their people, teams and enterprise

                                                                       Revenue Mix by
                                                                       Vertical Market

                                                                                          Education
                                                                                            16%

                                                                                                Healthcare
                                                                                                   12%
                                                             Corporate/Other
                                                                  72%

                                                                                                                               8
                                                     Chart represents Americas FY21 percentage of revenue by vertical market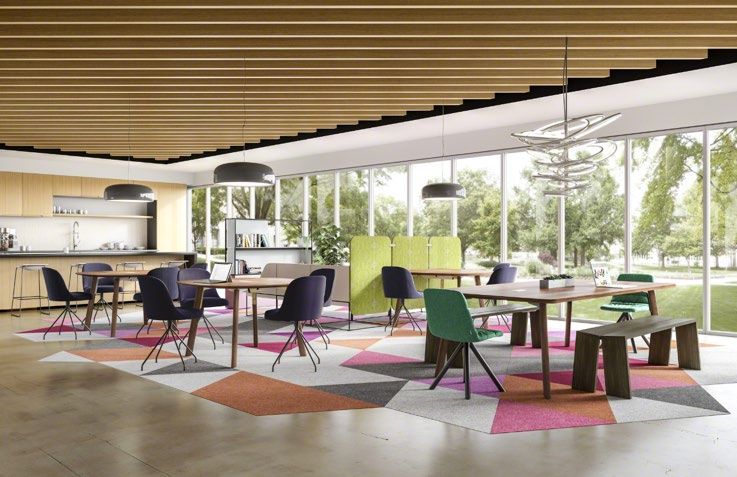
Steelcase Q1, 2022

         Sustainability is a lens for innovation and growth contributing
         to the financial wellbeing of our company                                                                             Our Core Values
                                                                                                                               We believe every team member,
                                                                                                                               in every location, lives our shared
                                                                                                                               Steelcase values.
                                                                                                                               Act with integrity
                                                                                                                               Tell the truth
                                                                                                                               Keep commitments
                                                                                                                               Treat people with dignity and
                                                                                                                               respect
                                                                                                                               Promote positive relationships
                                                                                                                               Protect the environment
                    Environmental                                             Social                      Governance           Excel
                Healthy Planet                                      Healthy People                    Healthy Culture
            Create products and operations                       Cultivate opportunities for people     Curate a culture of
              that are good for the world.                          and communities to thrive.          trust and integrity.   We’re using social innovation to
                                                                                                                               do good in the world
          We're carbon neutral now and
          pushing to go beyond net zero
                                                             We've set goals to increase
                                                             diversity at Steelcase by 2025            >50% of our
                                                                                                       board members
          • Science based targets aligned                    • Build diverse teams that reflect our    are women
            with a 1.5°C climate scenario.                     communities
          • Goal to reduce our own                           • Ensure equitable development
            carbon emissions by 50% by                         opportunities
            2030.                                            • Create a culture of inclusion
                                                                                                                                                          9
Source: Steelcase 2020 Impact Report, United Nations Sustainable Development Goals
Steelcase Q1, 2022

U.S. industry macro-factors have mostly begun to be more supportive
of growth after worsening during COVID-19 pandemic
CORPORATE PROFITS AFTER-TAX (U.S.)                                                                                                                                       NON-RESIDENTIAL FIXED INVESTMENT
                                                                            UNEMPLOYMENT (U.S.)                          THE CONFERENCE BOARD
With IVA and CCA adjustments                                                                                                                                             (U.S.)
                                                                            Unemployment Rate (%)                        MEASURE OF CEO CONFIDENCE (U.S.)                Equipment (In US$, billions)
(Year-over-Year % change)

 10%                                                                     20%                                                                                              1,500
                                                                                                                         80
  5%
  0%                                                                     15%                                             60                                               1,000
 -5%
-10%                                                                     10%                                             40
-15%                                                                                                                                                                       500
                                                                          5%                                             20
-20%
-25%                                                                      0%                                             0                                                   0
   Q1 2015                                                                                                    May 2021        Jan 2015                  May 2021            Q1 2015                          Q1 2021
                                                       Q1 2021             Jan 2015

                                                                                                COVID-19 NEW CASES PER DAY                                   COVID-19 TOTAL ADMINISTERED VACCINES
                                                                                                (per million)                                                (in millions)
ARCHITECTURAL BILLING INDEX (U.S.)                                                        800                                                               180
(Billings & Inquiries)                                                                    700                                                               160
                                                                                          600                                                               140
  80
                                                                                                                                                            120
                                                                            Inquiries     500
                                                                                                                                                            100
  60                                                                                      400
                                                                                                                                                              80
                                                                            Billings      300
                                                                                                                                                              60
  40                                                                                      200                                                                 40
                                                                                          100                                                                 20
  20                                                                                        0                                                                  0
                                                                                                                                                                 Jan 2020                                   May 2021
       Jan 2015                                                     April 2021                   Jan 2020                                   May 2021

                                                                                                                                                                                                                 10
  Sources: BEA, BLS, CEO Conference Board, AIA, Our World in Data
Steelcase Q1, 2022
EMEA industry macro-factors have declined since the COVID-19 pandemic, but were
previously supportive of growth...COVID-19 cases and vaccine trends have improved
GERMANY REAL GDP GROWTH FRANCE REAL GDP GROWTH UK REAL GDP GROWTH
5% 5% 5%
0% 0% 0%
-5% -5% -5%
-10% -10% -10%
-15% -15% -15%
-20% -20% -20%
-25% -25% -25%
Q1 2015 Q1 2021 Q1 2015 Q1 2021 Q1 2015 Q1 2021
HARMONIZED UNEMPLOYMENT RATE COVID-19 NEW CASES PER DAY COVID-19 TOTAL ADMINISTERED VACCINES
(seasonally adjusted) (per million) (in millions)
25% 1,200
45
20% 1,000 40 U.K.
35 Germany
800
15% Spain 30
600 25 France
10% 20
France Spain
Eurozone 400 15
5% France
10
Germany 200 Germany 5
Spain
U.K. 0
0% 0
Jan 2015 April 2021 Jan 2020 May 2021 Jan 2020 May 2021
11
Sources: Eurostat, Energy Information Administration, Our World in DataSteelcase Q1, 2022
The conversation around the outlook for the physical office is changing
Bank of America gives WFH
Morgan Stanley CEO Sees a Google to Invest $7
employees a Labor Day deadline
Future for the Bank With Billion in Bet on Post-
to return to the office
‘Much Less Real Estate’ Pandemic Office
Half of Facebook workers Adobe CEO says Wall Street 61% of
could work remotely within
offices provide some Workers Returning to
boost to productivity
10 years that remote work lacks Office by September
Twitter makes WFH a Amazon invests $1.4B into JP Morgan gets rid of
permanent change for new offices in U.S. tech Mask Mandate for
some employees hubs Vaccinated U.S. Staff
Early COVID More recent
12
Sources: Bloomberg, Wall Street Journal, The GuardianSteelcase Q1, 2022
Extreme work from home (WFH) strategies are not viable
Productivity Collaboration Wellbeing
Productivity decreased by: Collaboration decreased by: Wellbeing decreased by:
Lower employee engagement Less time spent working with Non-ergonomic home
others workspaces
Lack of proximity and social
accountability Unnatural conversation flow Longer workdays
during virtual meetings
Suboptimal home offices Feeling socially isolated
Lack of serendipitous
interactions
13
Sources: Steelcase COVID-19 Global Study, April 2020, Gensler’s U.S. Work from Home Survey 2020Steelcase Q1, 2022
Global leaders anticipate more of their workforce will be working in a hybrid model
23% 72% 5%
In Office Hybrid Work From
Home
14
Sources: Steelcase Global Report: Changing Expectations and the Future of WorkSteelcase Q1, 2022
Five key things people need emerged from our research
Safety
to be safe and feel safe
Steelcase research . . .
Belonging since March 2020
inclusion, trust and shared purpose
Productivity 8+
Primary Studies
32,000
Surveys + Conversations
to focus and collaborate
Comfort
physical, cognitive and emotional
10
Countries
8,000
Floorplans Analyzed
Steelcase Research
Control
March 2020 – Ongoing
more control over where
and how they work
15
Sources: Steelcase Global Report: Changing Expectations and the Future of WorkSteelcase Q1, 2022
We have identified a new set of design principles to create compelling environments
Me + We Fixed to Fluid Open + Braiding
Enclosed Digital + Physical
Equally support team and Multi-modal spaces support More enclosed “me” and more Increased video use in “me” and
individual work multiple purposes + modes of work open “we” spaces “we” spaces for those remote and
physically present
Allow for quick shifts between Adaptable spaces: Highly mobile Provide a range of individual
working alone and together furniture, power, technology and privacy + control options
space division
16
Sources: Steelcase Global Report: Changing Expectations and the Future of WorkSteelcase Q1, 2022
Our product development efforts are focused on supporting our customers as they return
to the office or the classroom, or as they connect from home
Open Space Collaboration Closed Personal Space
Home Office Learning
17Steelcase Q1, 2022
Our international markets provide opportunities for revenue growth and profit
improvement
EMEA Asia Pacific (APAC)
• We believe we can gain market • Certain APAC markets are leading
share as customers return to the the global economic recovery and
office and we leverage our return to the office
product development investments • We are leveraging our global
• We continue to focus on gross product development portfolio to
margin improvement initiatives bring new solutions to our APAC
• We have fitness initiatives aimed customers
at improving our operating • We are increasing our marketing
expense leverage investments to support our Work
• We have built new capabilities to Better research
serve the work from home market • We have built new capabilities to
serve the work from home market
18Steelcase Q1, 2022
Our investments in the business generated strong return on invested capital before
impact of COVID-19 pandemic in fiscal 2021
ADJUSTED RETURN ON INVESTED CAPITAL (ROIC) & ADJUSTED EBITDA ($M)
(% Adjusted Net Income of Average Capital)
Adj ROIC Adj EBITDA
16.0% $400
14.3%
14.0% 13.3% $350
12.0%
12.0% $300
10.9%
10.0% $250
8.0% $200
6.0% $150
5.0%
4.6%
4.0% $100
2.0% $50
0.0% $0
FY17 FY18 FY19 FY20 FY21 TFQ
19Steelcase Q1, 2022
We have generated strong cash flows to fund growth investments
and shareholder return
CASH FLOW FROM OPERATIONS AND ADJUSTED EBITDA MARGIN CAPITAL EXPENDITURES VS. DEPRECIATION AND AMORTIZATION
($ MILLIONS) ($ MILLIONS)
Cash Flow From Operations
$400 Adjusted EBITDA Margin 10% Capital Expenditures D&A
$100
8%
$300
6%
$200
4%
$100
2%
$0
$0 0% FY17 FY18 FY19 FY20 FY21 TFQ
FY17 FY18 FY19 FY20 FY21 TFQ
QUARTERLY DIVIDENDS PAID PER SHARE DIVIDENDS AND SHARE REPURCHASES
($ MILLIONS)
$0.16 Dividends
Repurchases
$0.12
$100
$0.08
$0.04
$0.00
Q1 Q1 $0
FY21 FY17 FY18 FY198 FY20 FY21 TFQ
FY16
20Steelcase Q1, 2022
Our balance sheet remained strong in Q1 and provides stability
through business cycles
Capital Allocation Philosophy
Q1 FY22, $ MILLION
— Reinvestment in the business
— Acquisitions
$1,500
— Dividends
— Opportunistic share repurchases Cash
$1,000
Equity
Credit Credit facility covenant information
Facility
COLI (1) maximum leverage ratio covenant, which is measured by the ratio of
$500 COLI indebtedness less liquidity to trailing four quarter adjusted EBITDA (as
Debt defined in the credit agreement) and is required to be less than 3:5:1
Cash
Cash (2) minimum interest coverage ratio covenant, which is measured by the ratio
of trailing four quarter adjusted EBITDA (as defined in the credit
agreement) to trailing four quarter interest expense and is required to be
$0
Liquidity Profile Capital Base no less than 3:0:1.
As of May 28, 2021, we were in compliance with all covenants under the 21
facility.Appendix
Learn more
22Appendix
Forward-looking statements
From time to time, in written and oral statements, we looking statements involve a number of risks and
discuss our expectations regarding future events and uncertainties that could cause actual results to vary from
our plans and objectives for future operations. our expectations because of factors such as, but not limited
to, competitive and general economic conditions
These forward-looking statements discuss goals, intentions domestically and internationally; acts of terrorism, war,
and expectations as to future trends, plans, events, results governmental action, natural disasters, pandemics and
of operations or financial condition, or state other other Force Majeure events; cyberattacks; the COVID-19
information relating to us, based on current beliefs of pandemic and the actions taken by various governments
management as well as assumptions made by, and and third parties to combat the pandemic; changes in the
information currently available to, us. Forward-looking legal and regulatory environment; changes in raw material,
statements generally are accompanied by words such as commodity and other input costs; currency fluctuations;
“anticipate,” “believe,” “could,” “estimate,” “expect,” changes in customer demands; and the other risks and
“forecast,” “intend,” “may,” “possible,” “potential,” “predict,” contingencies detailed in our most recent Annual Report on
“project,” “target,” or other similar words, phrases or Form 10-K and our other filings with the Securities and
expressions. Although we believe these forward-looking Exchange Commission. We undertake no obligation to
statements are reasonable, they are based upon a number update, amend or clarify forward-looking statements,
of assumptions concerning future conditions, any or all of whether as a result of new information, future events or
which may ultimately prove to be inaccurate. Forward- otherwise.
23Appendix
Segment revenue and earnings
AMERICAS – REVENUE EMEA – REVENUE OTHER CATEGORY – REVENUE
(US$ millions) (US$ millions) (US$ millions)
$2,673
$2,470
$2,232 $2,194 $670
$617
$1,849 $1,891 $524 $535 $381
$504 $511 $338 $356
$297
$236 $244
FY17 FY18 FY19 FY20 FY21 TFQ FY17 FY18 FY19 FY20 FY21 TFQ FY17 FY18 FY19 FY20 FY21 TFQ
AMERICAS – ADJUSTED OPERATING INCOME EMEA – ADJUSTED OPERATING INCOME (LOSS) OTHER CATEGORY –OPERATING INCOME MARGIN
MARGIN * MARGIN * (Percent of Revenue)
(Percent of Revenue) (Percent of Revenue) 1.5%
10.3%
10.8%
8.2% 8.5% 9.0% 6.3%
6.8% 7.1% 4.7% 4.0%
-1.1%
0.1%
-2.7% -2.4%
-2.9%
-3.7% -1.4%
FY17 FY18 FY19 FY20 FY21 TFQ FY17 FY18 FY19 FY20 FY21 TFQ FY17 FY18 FY19 FY20 ** FY21 TFQ
* Operating income restated due to implementation of ASU No. 2017-07, Compensation - Retirement Benefits (Topic 715). Please see Q1 FY19 10-Q for more information.
** Q4 FY20 included a ~$21M gain on the sale of PolyVision in the Other Category 24Appendix
Select segment statistics (as of February 26, 2021)
END OF FISCAL YEAR 2021 AMERICAS EMEA OTHER CATEGORY
Number of Steelcase dealer locations ~ 400 ~ 340 ~ 60
Employees – non-manufacturing ~ 2,700 ~ 1,400 ~ 800
Employees – manufacturing ~ 4,200 ~ 1,200 ~ 800
Number of primary manufacturing locations Michigan – 2 France – 1 China – 1
Alabama – 1 Germany – 1 Malaysia – 1
Mexico – 2 Spain – 1 India – 1
Texas – 1 Czech Republic – 1
Maine - 1 U.K. – 1
FY21 VERTICALS IN THE AMERICAS SEGMENT
15%
FY21 PRODUCT MIX FY21 LONG-TERM EMPLOYEE BENEFIT
10% OBLIGATIONS FUNDING STATUS
($ millions)
5%
Total Obligation $164
25% Other
0% Deferred
Tax Asset
Healthcare
Education
Manufacturing
Financial Services
Information
State/Prov/Local
Insurance Services
Professional
Other
Energy
Government
Technology
Technical /
30% Seating
Federal
$170
Gov
$119
45% Systems/ After-tax
Storage Obligation
Product Mix Assets (COLI) Liabilities
25Appendix
Historic shares outstanding
SHARES (IN MILLIONS)
180
160 Class A Shares Class B Shares
140
120
25.6
100
80
90.1
60
40
14.1 139.2
20
0
FY98 FY99 FY00 FY01 FY02 FY03 FY04 FY05 FY06 FY07 FY08 FY09 FY10 FY11 FY12 FY13 FY14 FY15 FY16 FY17 FY18 FY19 FY20 FY21 Q1
FY22
26Appendix
Historical market data
ESTIMATED U.S. OFFICE FURNITURE SHIPMENTS
(USD billions)
$20.0
$15.0
$10.0
$5.0
$-
1997 1998 1999 2000 2001 2002 2003 2004 2005 2006 2007 2008 2009 2010 2011 2012 2013 2014 2015 2016 2017 2018 2019 2020
EUROPEAN OFFICE FURNITURE CONSUMPTION
(EUR billions)
€ 12
€ 10
€8
€6
€4
€2
€0
1997 1998 1999 2000 2001 2002 2003 2004 2005 2006 2007 2008 2009 2010 2011 2012 2013 2014 2015 2016 2017 2018 2019
27
Sources: 1997-2015: internal Steelcase estimates, 2015-2020: BIFMA, CSILAppendix
Non-GAAP financial measures
This presentation contains certain non-GAAP financial measures. A “non- (3) adjusted Earnings Before Interest, Taxes and Depreciation and Amortization
GAAP financial measure” is defined as a numerical measure of a company’s (EBITDA), which represents EBITDA, excluding restructuring and goodwill and
financial performance that excludes or includes amounts so as to be different intangible asset impairment charges, (4) adjusted Earnings Before Interest Taxes
than the most directly comparable measure calculated and presented in
and Depreciation and Amortization (EBITDA) margin, which represents adjusted
accordance with GAAP in the statement of income, balance sheet or
statement of cash flows of the company. Pursuant to the requirements of EBITDA as a percentage of revenue, (5) total debt to adjusted EBITDA ratio, which
Regulation G, the company has provided a reconciliation of non-GAAP represents total debt divided by adjusted EBITDA and (6) adjusted return on
financial measures to the most directly comparable GAAP financial measure. invested capital (ROIC), which represents income before income tax expense,
The non-GAAP financial measures used within this presentation are: (1) excluding interest expense, restructuring costs and goodwill and intangible asset
adjusted operating income (loss), which represents operating income (loss), impairment charges, less income tax expense at an assumed long-term effective tax
excluding restructuring costs and goodwill and intangible asset impairment rate, divided by average capital (defined as the average of total debt and
charges, (2) adjusted operating income (loss) margin, which represents shareholders’ equity at the beginning and end of the applicable period). These
operating income (loss) margin, excluding restructuring costs and goodwill measures are presented because management uses this information to monitor and
and intangible asset impairment charges,
evaluate financial results and trends. Therefore, management believes this
information is also useful for investors.
ADJUSTED OPERATING INCOME
$ Million FY08 FY09 FY10 FY11 FY12 FY13 FY14 FY15 FY16 FY17 FY18 FY19 FY20 FY21 TFQ
Operating Income/(Loss)
$203 $1 ($12) $52 $97 $59 $166 $137 $170 $196 $155 $184 $257 $43 $64
as Restated*
Restructuring Costs - $38 $35 $31 $31 $35 $7 $41 $20 $5 - - - $28 $28
Goodwill and intangible
$21 $65 - - - $60 $13 - - - - - - $18 -
asset impairment charges
Adjusted Operating Income $225 $107 $27 $83 $124 $151 $180 $178 $190 $201 $155 $184 $257 $89 $92
* Operating income restated due to implementation of ASU No. 2017-07, Compensation
- Retirement Benefits (Topic 715). Please see Q1 FY19 10-Q for more information.
28Appendix
Non-GAAP financial measures
AMERICAS ADJUSTED OPERATING INCOME MARGIN *
(Percent of Revenue)
FY17 FY18 FY19 FY20 FY21 TFQ
Operating Income
10.7% 8.2% 8.5% 9.0% 5.2% 5.6%
Margin as Restated *
Restructuring Costs
0.1% - - - 1.6% 1.5%
(Benefits)
Adjusted Operating
10.8% 8.2% 8.5% 9.0% 6.8% 7.1%
Income Margin
* Operating income restated due to implementation of ASU No. 2017-07, Compensation
- Retirement Benefits (Topic 715). Please see Q1 FY19 10-Q for more information.
29Appendix
Non-GAAP financial measures
EMEA ADJUSTED OPERATING INCOME (LOSS) MARGIN *
(Percent of Revenue)
FY17 FY18 FY19 FY20 FY21 TFQ
Operating Income (Loss)
(4.1%) (2.7%) (1.1%) 1.5% (6.3%) (2.5%)
Margin as Restated *
Goodwill and intangible
- - - - 3.4% -
asset impairment charges
Restructuring Costs 0.4% - - - - -
Adjusted Operating Income
(3.7%) (2.7%) (1.1%) 1.5% (2.9)% (2.5%)
(Loss) Margin
* Operating income restated due to implementation of ASU No. 2017-07,
Compensation - Retirement Benefits (Topic 715). Please see Q1 FY19 10-Q for
more information.
30Appendix
Non-GAAP financial measures
ADJUSTED EBITDA MARGIN and TOTAL DEBT / ADJUSTED EBITDA
$ Million FY17 FY18 FY19 FY20 FY21 TFQ
Revenue $3,032 $3,055 $3,443 $3,724 $2,596 $2,670
Income before income
$196 $162 $164 $245 $26 $42
tax expense
Interest Expense $17 $18 $38 $27 $27 $26
Depreciation and amortization $60 $66 $82 $86 $86 $83
Restructuring costs $5 - - - $28 $28
Goodwill and intangible asset impairment charges - - - - $18 -
Adjusted EBITDA $279 $245 $283 $358 $185 $179
Adjusted EBITDA Margin 9.2% 8.0% 8.2% 9.6% 7.1% 6.7%
(% of Revenue)
Total Debt $297 $295 $487 $484 $484 $484
Total Debt / Adjusted EBITDA 1.1 1.2 1.7 1.4 2.6 2.7
31Appendix
Non-GAAP financial measures
ADJUSTED RETURN ON INVESTED CAPITAL (ROIC)
$ Million FY17 FY18 FY19 FY20 FY21 TFQ
Income before income tax expense $196 $162 $164 $245 $26 $42
Interest Expense $17 $18 $38 $27 $27 $26
Restructuring costs $5 - - - $28 $28
Goodwill and intangible asset impairment charges - - - - $18 -
Adjusted Income before income tax expense $218 $180 $201 $273 $99 $96
(1)
Assumed Long-Term Effective Income Tax Rate % 36.0% 34.5% 27.0% 27.0% 27.0% 28.0%
Adjusted Net Income $140 $118 $147 $199 $72 $69
Total Debt $297 $295 $487 $484 $484 $484
Total shareholders’ equity $767 $813 $850 $970 $962 $930
Total Capital $1,064 $1,108 $1,337 $1,455 $1,446 $1,414
Prior Year Total Capital $1,036 $1,064 $1,108 $1,337 $1,455 $1,610
Average Capital $1,050 $1,086 $1,223 $1,396 $1,451 $1,512
Adjusted Return on Invested Capital (ROIC)
13.3% 10.9% 12.0% 14.3% 5.0% 4.6%
(Adjusted Net Income as a % of Average Capital)
(1) Assumes 10 months at 36% and 2 months at 27% as after U.S. Tax Reform
32© 2020 Steelcase Inc. Trademarks used herein are the property of Steelcase Inc. or of their respective owners. 33
You can also read