Investor Presentation Material - Fourth Fiscal Period (Ended July 2020) Ticker Symbol: 3493 ITOCHU Advance Logistics Investment Corporation
←
→
Page content transcription
If your browser does not render page correctly, please read the page content below
Ticker Symbol: 3493
ITOCHU Advance Logistics Investment Corporation

                                    Fourth Fiscal Period (Ended July 2020)
                                    Investor Presentation Material
                                    (September 14, 2020)

                                                                         0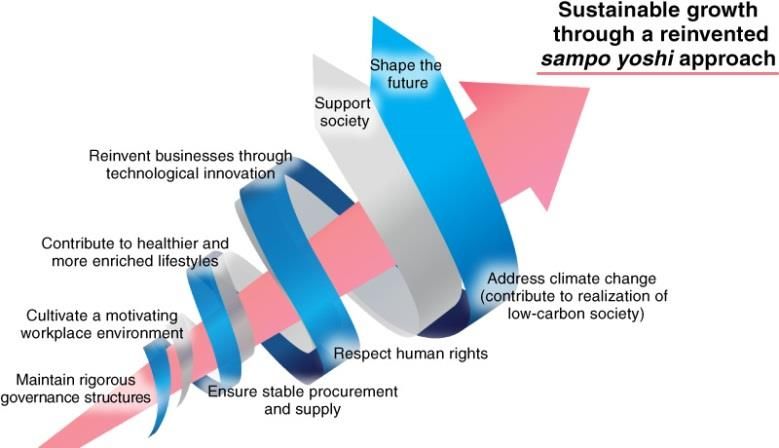
President Message

  With respect to the financial results for the fourth fiscal period, I am pleased to announce that we have yet again
  successfully closed another fiscal period with increased revenue, profit, and distributions.
  And in February 2020, we have launched the first post-IPO equity offering and I believe that the success of the deal is
  largely thanks to the generous support we receive from our stakeholders, including our unitholders.
  As in the fourth fiscal period, we have decided not to hold the financial results briefing session in terms of preventing
  the spread of COVID-19. We are deeply sorry for any inconvenience. We would appreciate it if you could confirm the
  details of our performance by watching the presentation video on our website with this presentation. If you have any
  questions, please feel free to contact us at the details set out at the end of this presentation.
  In the early stages of the spread of COVID-19 this spring, unit prices has dropped quite rapidly and this must have
  caused great concern to out unitholders. However, unit price was V shaped recovery with the market reassessing the
  solid needs for advanced logistics facilities and the stability of management due to factors such as the expansion of
  stay-at-home consumption and e-commerce, the reputation of logistics REITs, and of IAL in particular, has increased
  even more than before the expansion of COVID-19, and now I understand that unitholders‘ expectation for further
  external growth have recently increased. We have secured some properties in our sponsor’s pipeline, which are newly
  developed, 100% occupied and have preferential negotiating rights. The sponsor group continues to be proactive in
  developing new properties and we expect to be able report on candidate pipeline properties in due course. Under the
  unprecedented and unexpected market, we will continue to pay close attention to the external environment for timely
  grasping opportunities and plan for steady external growth and continued internal growth
  Although we have not received any incident reports, which related COVID-19 from our tenants that would have a
  significant impact on their operation, we will continue forward with our management operations without letting up.
  We are fully aware of our mission, “Meet the expectation of our unitholders”, and we will remain committed to making
  aggressive moves in order to be the J-REIT of your choice.
                                                                                                             Junichi Shoji
                                                                                Representative Director, President & CEO
                                                                                     ITOCHU REIT Management Co., Ltd.

                                                                                                                              1
目次

     Response to COVID-19   P.3

     Financial Results      P.5

     Growth Strategies      P.9

     Portfolio              P.22

     Market Overview        P.24

     Appendix               P.27

                                   2
Response to COVID-19

                       3
Response to COVID-19
Response of Tenants and the Asset Management Company against COVID-19
                                                                                                       Efforts to prevent the spread of COVID-19

                                               ・IAL has not been informed so far that COVID-19 infection was found among the tenants of the facilities it owns
                                                 (as of September 14, 2020)
                  Tenant                       ・Ensure basic hygiene practices (handwashing, disinfection, and facemask)
                                                Each tenant is taking different preventive measures, for example: measuring employees’ body temperature; keeping social
                                                distancing at offices and employees’ lounges; and placing division panels, best for its own workplace management

                                               Operation of IAL has been going without any problems even under the current situation
               Asset
                                                 ・IT infrastructure for teleworking has already been established. IRM will continue to invest in various facilities and equipment
            Management
             Company
                                               to be added to improve operational efficiency
                                                 ・All the workers, including the President, have been teleworking half a week

Tenant industry and package composition with stable CF to be expected even under the influence of COVID-19
                                                                                                                                                                                                                                    (as of July 31, 2020)

                                                                                                    Tenant Industry and Package Composition
                                    Tenant Industry (based on annual rent)                                                                                      Major Packages Tenants Handle (based on annual tenants’ rents)* 1
                    ・Recession proof and stable CF with high E-commerce +major 3PL ratio                                                 ・Primarily consumer-related packages and packages resilient and unsusceptible to economic ups and downs
                                                             Manufacturer
                                                 Retail                                                                                                                          Furniture &     Other
                                                             2.3 %                                                                                                               Fixtures        2.3 %
                                                 7.2 %                                                                                                                           1.7 %

                                                                       E-commerce
                                                                        Eコマース                                                                                                                           Various
                                                                                                   E-commerce+                                                                       Clothing
                                                                       39.3 %                                                                                                                           Everyday   Consumer-related package
                                                                                                   major 3PL ratio                                                                   34.2 %             Sundries
                                                   3PL ※ 1

                                                   51.2 %                                             78.1 %                           Breakdown of major clothing:                                     45.8 %            96.0 %
                                                                                                                                       ・Sportswear
Breakdown of retailors:                                                                                                                                                                     Foods &
                                                                                                                                       ・Shoes
・Discount supermarket                                                                                                                  ・Underwear
                                                                                                                                                                                            Beverages
・EDWIN, ITOCHU Group                                                                                                                   ・Jeans                                               16.0 %

 *1 The calculations of packages are based on what we heard from respective tenants. Accordingly, different types of packages may be handled at some part of space
                                                                                                                                                                                                                                                            4
Financial Results

                    5
Highlights
Launch the first post-IPO public offering / Increase Revenues, Profits and Distributions
Operational Highlights
Unrealized gains
Appraisal value NAV per unit
Appraisal NOI yield 5.0% Occupancy rate 4th FP (Jul. 2020) 8.0 BN Yen
4th FP (Jul. 2020) 90.9 BN Yen 4th FP (Jul. 2020) 118,511 yen (ratio of unrealized gain 9.7%)
Actual NOI yield 5.2%
(based on acquisition price) 99.9% (+2.1%)
3rd FP (Jan. 2020) 6.2 BN Yen
3rd FP (Jan. 2020) 64.2 BN Yen 3rd FP (Jan. 2020) 116,026 yen (ratio of unrealized gain 10.7%)
Forecast Distributions
・In the 4th FP, achieved the increase dividends (+1.3%) over the previous fiscal period by minimized expanses related to general meeting of unitholders and the first post-IPO public offering
3rd FP (Jan. 2020) 4th FP (Jul. 2020) 5th FP (Jan. 2021) 6th FP (Jul. 2021)
+1.3% (+30 yen)
2,395 2,425 2,497 2,508 2,407 2,420
2,382
272
269 294 +1.8% 287 280
+0.4% +0.5% 310
(+43 yen) (+11 yen) (+13 yen)
2,126 2,088 2,138 2,217 2,236 2,110
実績
Actual 前回予想
Previous forecast 実績
Actual 前回予想
Previous forecast 今回予想
Forecast Previous forecast
2020年1月6日発表 今回予想
Forecast
(announced on Jan. 6, 2020)
(announced on Mar. 16, 2020)
2020年3月16日発表 (announced on Mar. 16, 2020)
2020年3月16日発表 想定巡行期
(After adjustment of temporary effect based on the
(第5期予想をもとに一時効果調整)
forecast of 5th FP)
Highlights of Initiatives and Measures
Maintained LTV after repayment of consumption tax loan at the 30% level
Acquired two quality properties through the first post-IPO public (based on total assets) after the first post-IPO public offering (Forecast as of the
External offering and improved unitholder value
Financial
end of the 5th fiscal period after repayment of consumption tax loans: 39.6%)
Growth Strategies
Expanded the asset size by 56% to 84.1 billion yen (based on acquisition Financing capacities when increasing LTV (based on total assets) to 45% are 8.5
price) billion yen
Increase in revenue due to rent increase Strengthen governance through revision of the asset management fee structure
Internal Generated new profits by thorough cost reduction and roof rental Implement green finance (green loan, green bond etc.)
ESG
Growth (effective utilization of assets) to improve NOI Promote the working from home to prevent the spread of COVID-19
*1 Consumption tax loans refer to loans to be repaid before their maturity dates with consumption tax refund for asset acquisition. The forecast as of the end of the 5th fiscal period (after repayment of consumption tax loans) assumes the prepayment of the relevant consumption tax loans.
*2 Please refer to page 7 and the following pages for the definitions of terms and calculation methods described on this page. 6
Financial Results of the 4th Fiscal Period (Jul. 2020)
DPU FFO per Unit
4th fiscal period (Jul. 2020) Actual 2,425 yen 4th fiscal period (Jul. 2020) Actual 3,465 yen
vs forecast +43 yen (+1.8%) / period on period +30 yen (+1.3%) vs forecast +64 yen (+1.9%) / period on period +44 yen (+1.3%)
3rd fiscal period 4th fiscal period
(Jan. 2020) (Jul. 2020) Breakdown of Difference
(4th FP forecast vs 4th FP actual)
Forecast
(announced on Actual Difference
Actual
(MN Yen) Mar. 16, 2020) (B) (B) − (A) 【Operating revenues】
(A)
Decrease in utility revenues -6
Operating revenues 1,759 2,405 2,399 -5 【Operating income】
Decrease in utility expenses +6
Operating income 839 1,173 1,193 +19
Increase in repair expenses -1
Ordinary income 760 1,015 1,047 +31 Decrease in property and
city planning taxes +1
Net income 759 1,014 1,046 +31 Decrease in insurance expenses +1
Increase in asset management fees -5
DPU
(including surplus cash distribution (SCD))
2,395 yen 2,382 yen 2,425 yen +43 yen Decrease in administrative
service fees +3
Decrease in public accountants and
DPU (excluding SCD) 2,126 yen 2,088 yen 2,138 yen(※) +50 yen tax accountants’ fees +1
SCD per unit 269 yen 294 yen 287 yen -7 yen Decrease in expenses related to
general meeting of unitholders +8
FFO 1,221 1,653 1,684 +30 【Ordinary income】
FFO payout ratio 70.0% 70.0% 70.0% - Decrease in interest expenses +9
Decrease in expenses for issuance
Ratio of SCD to depreciation 20.8% 22.4% 21.9% -0.5 pt cost of new investment units +1
FFO per unit 3,421 yen 3,401 yen 3,465 yen +64 yen
AFFO* 1,213 1,628 1,671 +42 ※ DPU (excluding SCD) is calculated by dividing Net
Income (excluding reserve for temporary difference
adjustments) by investment units.
AFFO payout ratio 70.5% 71.1% 70. 5% -0.5 pt
AFFO per unit 3,398 yen 3,351 yen 3,438 yen +87 yen
* FFO is calculated by adding depreciation costs for the applicable fiscal period to net income (excluding gain or loss on the sale of real estate).
AFFO is calculated by deducting capital expenditure from FFO. The AFFO formula has been changed and the AFFO for 3rd FP actual and 4th FP forecast(announced on Mar. 16, 2020) is calculated on this
formula respectively. (Previously, AFFO was calculated by deducting capital expenditures from FFO, and adding loan-related non-cash expenses.)
FFO (AFFO) payout ratio is calculated by dividing the sum of total distributions and total surplus cash distributions by FFO (AFFO), rounded to the first decimal place.
7
Earning Forecasts for the 5th Fiscal Period (Jan. 2021) and
the 6th Fiscal Period (Jul. 2021)

                                                4th fiscal period        5th fiscal period               6th fiscal period           Breakdown of Difference
                                                   (Jul. 2020)             (Jan. 2021)                      (Jul. 2021)           (4th FP actual vs 5th FP forecast)

                                                    Actual          Forecast          Difference            Forecast         【Operating revenues】
  (MN Yen)                                           (A)              (B)              (B) − (A)                             IMP Inzai (20% quasi-co-ownership interest)
                                                                                                                             contributes for 5th FP
                                                                                                                              Increase in rent revenues               +58
  Operating revenues                                       2,399          2,456                   +57               2,456     Increase in utility revenues             +5

  Operating income                                         1,193          1,190                    -2               1,129    Decrease in insurance income                  -6

  Ordinary income                                          1,047          1,087                   +40               1,026    【Operating income】
                                                                                                                             IMP Inzai (20% quasi-co-ownership interest)
  Net income                                               1,046          1,086                   +40               1,025    contributes for 5th FP
                                                                                                                              Increase in utility expenses       -5
  DPU                                                                                                                         Increase in building management
                                                     2,425 yen        2,508 yen               +83 yen          2,420 yen      expanses                           -1
  (including surplus cash distribution (SCD))
                                                                                                                              Increase in depreciation         - 16
     DPU (excluding SCD)                             2,138 yen        2,236 yen               +98 yen          2,110 yen      Increase in asset management fees -17

                                                                                                                             Increase in property and
     SCD per unit                                       287 yen        272 yen                    -15            310 yen
                                                                                                                             city planning taxes                           -1
                                                                                                                             Increase in administrative
  FFO                                                      1,684          1,741                   +57               1,680    service fees                                  -5
                                                                                                                             Decrease in expenses related to
    FFO payout ratio                                      70.0%          70.0%                       -             70.0%     general meeting of unitholders                +1
                                                                                                                             Decrease in attorney’s fees                   +3

    Ratio of SCD to depreciation                          21.9%          20.2%                 -1.7pt              23.0%     【Ordinary income】
                                                                                                                             Decrease in expenses for 1st post-IPO public
                                                                                                                             offering
    FFO per unit                                     3,465 yen        3,583 yen              +118 yen          3,457 yen      Decrease in borrowing
                                                                                                                              related expenses                   +9
  AFFO                                                     1,671          1,732                   +61               1,659     Decrease in expenses for issuance
                                                                                                                              cost of new investment units      +21
    AFFO payout ratio                                     70.5%          70.4%                 -0.1 pt             70.9%      Decrease in temporary expenses +13

                                                                                                                             Increase in interest expenses                 -4
    AFFO per unit                                    3,438 yen        3,563 yen              +125yen           3,415 yen
                                                                                                                             Interest on tax refund                        +3

                                                                                                                                                                                8
Growth Strategies
9Implemented Measures and Change of Unit Price
Unit price rose above NAV per unit due to the implemented measures.
After the first post-IPO public offering, unit price performed relatively well among
J-REITs specializing in logistics facilities. Launched the first
(Yen) (unit)
本投資法人
Unit price of IAL post-IPO public offering
180,000 30,000
物流特化型REIT
J-REITs specializing in logistics facilities
東証REIT指数
TSE REIT Index
at a premium on NAV
160,000 25,000
140,000 20,000
7
120,000 15,000
4th FP (July 2020)
6 NAV per unit:118,511 yen
Price / NAV:1.36x
5
100,000 3rd FP (Jan 2020) 10,000
4 NAV per unit:116,026 yen
3 Price / NAV:1.09x
1 2 2nd FP (July 2019)
NAV per unit:113,026 yen
80,000 Price / NAV:0.91x 5,000
1st FP (Jan 2019)
NAV per unit:109,848 yen
Price / NAV倍率:0.80x
Trading volume of IAL (right axis)
60,000 0
2018/9 2018/11 2019/1 2019/3 2019/5 2019/7 2019/9 2019/11 2020/1 2020/3 2020/5 2020/7
1 2 3 4 5 6 7
Announced
Announced Awarded the “Green Star” Announced
Acquired additional acquisition Obtained analyst
acquisition of two (with GRESB rating being Issued green bonds inclusion in MSCI
credit rating of investment units by coverage
new properties “three stars”) (December 12, 2019) Japan Small Cap Index
(March 15, 2019) ITOCHU corporation (June 14, 2019)
(March 14, 2019) (September 10, 2019) (May 12, 2020)
(March 26, 2019)
※ Changes in TSE REIT Index and J-REITs specializing in logistics facilities are indexed based on IAL’s initial public offering price, 103,000 yen, with IAL’s listing day as the start date. J-REITs specializing in logistics facilities are weighted for market capitalization.
10Strategic Roadmap
By steadily continuing measures, aim for long-term stable management which improves unitholder value
Actual Future
4th FP 5th FP 6th FP 7th FP
(Jul. 2020) (Jan. 2021) (Jul. 2021) (Since Jan. 2022)
Forecast
(including SCD)
2,508 yen Forecast
Actual
2,420 yen Continuous EPU (DPU) growth
DPU
Steady DPU 2,425 yen
growth through external and internal
growth as well as LTV control
4-5% DPU growth through external
and internal growth
Inclusion in
MSCI Japan Small Cap Index Respond flexibly while closely observing the Aim to be included into major indices
Construction of a impact of COVID-19 and market conditions Consider acquiring properties using loans Current target:
External
growth
Property acquisition
portfolio suitable 9 properties (capital costs, etc.)
for stable mid- to
through PO about 200 billion yen
(25.2 BN Yen) 84.1 BN Yen Awareness of improving liquidity
long-term
management
Effective utilization of the bridge scheme (steady progress)
(pipeline, other real estate, third-party properties / land, etc.)
Reduction in multi-electricity charge and Work with ITOCHU to renew tenants, retenant as well as conclude longer-term lease agreements and increase rents
insurance expenses
Pursuit of
Internal
/ Utilization of unused parking lots
growth
tenant stickiness Roof rental for solar panels, further reduction in insurance expenses, promotion of green lease agreements, etc. Continuous focus on raising rents,
and NOI Fixed interest rate increasing NOI and reducing
improvement based on swap agreement expenses
Credit rating: A+ (stable) (JCR) Focus on rating upgrade through dialogue with rating agencies
Sound financial
strategies
Financial
management Forecast Upper target over the medium to
Actual Consider introducing
enabling 39.6% long term:
40.6% commitment line
withstand long- 50%
term operations Total asset Current upper target: 45%
LTV
Acquisition of GRESB / BELS Focus on raising external assessment, such as GRESB (additional acquisition for properties not certified for DBJGB and BELS)
Borrowing Green loans
ESG loans / issuance of the investment corporation bonds (green bonds, etc.)
Focus on continuously expanding
ESG
Promotion of Promoting the working from home
sustainability Initiatives for green lease with tenants (installing LED lighting / reducing electricity charge of BTS facilities) initiatives with reference to
Employee investment unit investment program external assessment such as
Revision of the asset management fee Revision to the asset management fee ESG ratings
Applied new fee percentages from the 5th fiscal period
structure of the AM company structure of the Asset Management Company
11External Growth
Strategies Steady Expansion of the Asset Size through Selective Investment in Quality Properties
Carefully select quality properties that do not damage the quality and profitability of portfolio, and acquire at appropriate level of NOI yield
in each area
Considering the possibility of entering the economic downturn phase, we are strongly conscious of building a portfolio focusing on locations and tenants (long-term contracts)
that can be expected to generate long-term stable cash flow.
Sponsor Development Properties Third-party Properties
Utilize the sponsor support and continue to acquire properties at appropriate level of NOI yield by area
Identification of asset securitization
Properties owned / developed by the ITOCHU Group: 7 properties with total floor area of 191,394㎡ needs utilizing
Preferential negotiation right Preferential negotiation right Preferential negotiation right the ITOCHU Group’s network
New property
Logistics real estate capable of realizing tenant
i Missions Park Yoshikawa Minami
stickiness and long-term stable earnings
27,872㎡ 35,230m2 Total floor area:approx. 17,848㎡ (actively consider areas other than Kanto and
26,938m2
Groundbreaking:Apr. 2022(planned) Kansai)
i Missions Park Tokyo-Adachi i Missions Park Kahiwa 2 i Missions Park Inzai 2
Completion:Sep. 2023(planned)
(30% quasi-co-ownership interest)
Preferential negotiation right Preferential negotiation right Other real estate (process centers, etc.)
i Missions Park Atsugi 2
Total floor area:approx. 15,482㎡
Groundbreaking:May. 2021(planned)
Completion:July. 2022(planned) Properties with potential for
10,300m2 57,724m2 generating relatively high yield
i Missions Park Miyoshi i Missions Park Ichikawa Shiohama
disclosed pipeline new pipeline
By using the features of the quality properties with stable cash flow, proactively utilize the bridge scheme depending on the conditions
Pay close attention to the market conditions, etc., and acquire properties by appropriately combining equity, debt and cash in hand according to the situation
1.36
1.09
0.91
0.80 ・Improving the cost of capital
・Aim the external growth by timely grasping the
opportunity.
2019年1月期
1st FP
(Jan. 2019)
2nd FP
2019年7月期
(Jul. 2019) 2020年1月期
3rd FP
(Jan. 2020)
4th FP
2020年7月期
(Jul. 2020)
12Portfolio Map
Metropolitan Inter-City Expressway
6.3%
Around Tokyo
Gaikan
Expressway
Kuki Shiraoka JCT IMP Moriya 2
Tsukuba JCT
7.3% Around National
Route 16 and
IMP Moriya Tokyo Gaikan
IMP Noda EXPWY
Sakado west
smart IC
National Route 16 93.7%
Around National
Yawara IC Route 16
Tsurugashima JCT
IMP Kashiwa 2 80.6%
Iwatsuki IC IMP Yoshikaminami
Ibaraki
Kashiwa IC
Kawagoe IC
Saitama
IMP Miyoshi Nagareyama IC
Kawaguchi JCT Gaikan EXPWY
Miyoshi Smart IC IMP Kashiwa
IMP Misato
Misato JCT
IMP Tokyo Adachi IMP Inzai Taiei JCT
Adachi Iriya IC IMP Inzai 2
Misato south IC
Oizumi JCT Kouhoku JCT
Narita
Itabashi JCT Kosuge International
Kumanocho JCT
JCT
Keiyo Ichikawa IC Chiba airport
Wangan Ichikawa IC
Tokyo Sakura IC
Hachioji IC Takaido IC
Nishi-Shinjuku JCT
Koya JCT Miyanogi JCT Chiba north IC
IMP Ichikawa Shiohama
Ohashi JCT IMP Chiba-Kita
Kasai JCT Tokyo
Hachioji Tatsumi JCT Disney Resort
JCT
Tokyo IC
Chiba east JCT
Ooi JCT
Sagamihara Tokai JCT Chiba port
IC National Tokyo Bay
Route 129
Haneda airport
Sagamihara
Aikawa IC
Yokohama Machida IC Kawasaki Ukishima JCT
Central area
Atsugi IC IMP Atsugi
Daikoku JCT
Shin-hodogaya IC
Ebina JCT
Kanagawa Honmoku JCT
Sodegaura IC
13Internal Growth Strategies (1)
Long-term Stable Cash Flow Based on ITOCHU Corporation’s Leasing Capabilities
Secure long-term stable profitability by timely grasping the customer’s location strategy and needs through
the ITOCHU Group’s network. Also lease the entire building to a quality tenant on a long-term basis for several facilities
fundamental policy on leasing
Long-term, stable cash flow realized based on lease contracts with quality tenants
(as of July 31, 2020)
Long-term contracts with quality tenants based utilizing tenant stickiness Implemented measures for generating revenue
Tenant industry (based on annual rent) Remaining lease term *(based on annual rent)
Manufacture 2.3 % Less than 1 year 5.6 % Rent increase
Retail 7.2 % 1 year or more
to less than 3 years
Renewal of lease contract with a tenant, whose term
E-commerce will expire in the 5th FP, with increased rent
3PL *1 + major 3PL ratio Average period 9.7 %
51.2 % (End of the 3rd FP) E-commerce 6.2 years Rooftop lease at I Missions Park Inzai
69.2% 39.3 %
3 years or more
to less than 5 years Since Sep. 2020, lease of rooftop for solar panel will be
7 years or more
implement.
The major 3PL*2
78.1 % 62.4 % 20.0 %
5 years or more
38.7 % to less than 7 years
2.3 %
Timing of Lease Expiration(based on annual rent)
35.0% 32.3%
30.0% Renewal of lease contract
(Tenant equivalent to approximately 2.3% of annual rent)
25.0% 22.1%
20.0%
15.0%
8.4% 9.7%
10.0% 6.9% 7.0%
4.8%
5.0% 3.4% 2.3% 3.2%
0.0%
1月期
Jan. 7月期
Jul. 1月期
Jan. 7月期
Jul. 1月期
Jan. 7月期
Jul. 1月期
Jan. 7月期
Jul. 1月期
Jan. 7月期
Jul. 1月期
Jan. 7月期
Jul. 1月期
Jan. 7月期
Jul. 1月期
Jan. 7月期
Jul. 1月期
Jan. 7月期
Jul. 1月期
Jan. 7月期
Jul. 1月期
Jan. 7月期
Jul. 1月期
Jan. 7月期
Jul. 1月期
Jan. 7月期
Jul.
2021 2022 2023 2024 2025 2026 2027 2028 2029 2030 2031 2032 2033
* Regarding tenant whose term will expire in the 5th FP, the lease expiration is calculated based on new contract period.
14Financial Strategies (1)
Establishment of Strong Financial Base Enough for Long-term Asset Management
Extended the maturity dates, fixed the interest rates, and expanded the lender base
Continued financial management with consideration for financial capacities
Financial Highlights (as of Jul. 31, 2020)
Issuance of investment (Total asset) LTV Borrowing capacity (Assuming LTV can be
corporation bonds (Green bonds) increased up to 45%) Average debt cost
Term: 5 years
39.6% 8.5 BN Yen 0.47% (annual basis)
(as of the end of the 5th FP)
Interest rate: 0.300% per annum (after repayment of consumption tax loans) (as of the end of the 5th FP)
(after repayment of consumption tax loans)
Interest-bearing debt Long-term debt / Fixed interest ratio Long-term issuer rating (JCR) Average life of debt outstanding
36,153 MN Yen 95.8% A+ (stable) 4.9 years
Diversified Interest-bearing Debt
More Diversified Interest-bearing Debt
(All debt are Unsecured and non-guaranteed) Longer borrowing periods and fixed interest ratio
Sumitomo Mitsui Banking
三井住友銀行 28.7% Borrowing
Corporation Ratio
amount
みずほ銀行
Sumitomo Mitsui Trust Bank, Ltd. 18.9%
三井住友信託銀行
Mizuho Bank, Ltd. 17.4%
Short-term loans payable 1.513 MN Yen 4.2%
三菱UFJ銀行
MUFG Bank, Ltd. 14.1%
日本政策投資銀行
Mizuho Trust & Banking Co., Ltd. 4.9%
Long-term loans payable
みずほ信託銀行
Development Bank of Japan Inc. 3.9% 33,140 MN Yen 91.7%
(fixed interest rate)
Nippon Life Insurance Company 2.8%
The Norinchukin Bank 1.9% Investment
1,500 MN Yen 4.1%
Corporation Bonds
The Bank of Fukuoka 1.9%
Shinsei Bank, Ltd. 1.4%
Total 36,153 MN Yen 100.0%
Investment Corporation bonds 4.1%
15Financial Strategies (2)
Solid Cash Management in Preparation for various uses
Continue to secure and to utilize funds appropriate way for enhancing unitholder’s value
Maturity Ladder
(MN Yen) ■Borrowing ■Investment corporation bonds
7,000 6,620
6,000 5,300 5,500
5,020
5,000
✓ After the 7th FP (Jan. 2022), no major
3,950 4,000 refinancing will occur until 13th FP (Jan.
4,000
2025).
3,000
1,750
2,000 1,513 1,500 ✓ Aim to further enhance financial stability
1,000
1,000 and improve the external credit rating
by dispersing repayment date through
0
Jul.
7月期 Jan.
1月期 Jul.
7月期 Jan.
1月期 Jul.
7月期 Jan.
1月期 Jul.
7月期 Jan.
1月期 Jul.
7月期 Jan.
1月期 Jul.
7月期 Jan.
1月期 Jul.
7月期 Jan.
1月期 Jul.
7月期 Jan.
1月期 Jul.
7月期 Jan.
1月期 borrowing with external growth
2021 2022 2023 2024 2025 2026 2027 2028 2029 2030
* Ratios are rounded to the first decimal place. Borrowings include the borrowings scheduled to be made on March 31, 2020.
Cash Management
utilize funds in hand in a flexible manner Comparison of FFO Payout Ratios for J-REITs Specializing in Logistics Facilities
FFO The lower the FFO payout ratio, the higher the amount of cash in hand retained
Distribution policy with a guideline set at “70% of FFO” 101% 101%
Ability to select the use of funds that will most contribute
Depreciation to enhancing unitholder value and utilize funds in hand in 82% 82% 80% 79%
a flexible manner 70% 70% 69%
Maintenance of property LTV Control
quality Repayment of interest-bearing
Total
Capital expenditure debt
Net Income amount of
distribution
Leveling of the total DPU
DPU Growth Company A Company B Company C Company D Company E Company F Company G IAL Company H
Adjustment of Surplus Cash
property acquisition
Distribution ※ Calculated based on the most recent securities report disclosed by each investment corporation as of the date of
Unit buybacks
(used for timely finance) this document. The payout ratio of the investment corporation which sold properties during the relevant fiscal
period may be higher than that for the normal fiscal period.
16Initiatives for ESG : Basic Policy
Strong commitment to ESG initiatives
GRESB Real Estate Assessment
In recognition of its strong commitment to ESG, approximately one year after its listing,
awarded “Green Star” status by GRESB Real Estate Assessment
and granted “three-star” in the GRESB Rating
Timely implementation of measures
at an early stage
The Asset Management Company’s sustainability-related basic policy
E Environment S Society G Governance
1 Focus on human resources development
2 Respect for human rights and promote 1• Comply with laws and regulations and
1 Promote energy (decarbonization) and
reforms in the way of working prevent fraud
resource conservation 3 Share sustainability policies with suppliers 2• Timely and accurately disclose
2 Utilize environmental certification
4 Cooperate with tenant companies information to unitholders
3• Build appropriate relationships with
5 Coexist with society, especially in areas stakeholders such as the ITOCHU Group
where facilities are located
ITOCHU Group’s Commitment
The United Nations Global Compact TCFD (Task Force on Climate-related
ITOCHU Corporation participated in April 2009
Financial Disclosures)
ITOCHU Corporation participated in
TCFD Consortium in May 2019
17Initiatives for ESG (E) Environmental Initiatives
Proactive Promotion of Green Financing Energy Consumption Reduction and Resources Saving
• Filed a revised shelf registration statement on November 22, 2019,
and issued IAL’s first green bonds on December 12, 2019.
Enjoyed robust demand from a wide range of investors
Had the framework evaluated by a third-party institution, JCR, LED lighting Installing water-saving toilet system
and received the highest “Green 1 (F)” status in the “JCR
Green Finance Framework Evaluation”
• Used green loans partially for the public offering made in January
2020
Solar panels Greening parking lots
Active Acquisition of External Environmental Certification
★★★★★ 3 properties
★★★★ 1 property
(i Missions Park Inzai and other 3 properties)
Promoting CO2 emissions reduction in
Raising awareness
cooperation among tenants based on
★★★★★ 1 property through posters, etc.
applicable law* (administrative report)
★★★★ 5 properties
(i Missions Park Inzai and other 4 properties)
Total floor area basis (m2) ・Post-acquisition
DBJ Green Building BELS
91.0% 40.3%
Total 399,290.54m2 Total 399,290.54m2
Certified properties 363,371.75m2 Certified properties 161,050.44m2
Installing LED based on green lease agreements
* Act on Advancement of Integration and Streamlining of Distribution Business. 18Initiatives for ESG (S) Social Contribution
ESG Initiatives with Suppliers Coexistence with Local Communities
Support for education Helping people with disabilities
Distribution of sustainability guidebooks to major business partners, including property
management companies
Annual survey on their sustainability-related initiatives
Cooperation with Tenant Companies
Statement of ESG-related clauses in lease agreement (Green lease clause)
Revision of lease agreement format The ITOCHU Ethical
Enhancement of the system to pursue ESG initiatives in cooperation with tenants, such Foundation Purchasing
as environmental performance data management and sharing Participate in donation campaigns by ITOCHU Purchase from the ITOCHU group company that
Foundation hires people with disabilities
Tenant satisfaction survey which aims for fostering the healthy development of
children
Implemented since 2020 Volunteer activities Consideration to local communities
Understand how tenants use their current facilities and utilize it for facility operation
and equipment improvement
Ensuring employee safety
An individual specification was adopted whereby
employees enter the building via elevator access to
the second floor directly from the parking lot. This ITOCHU Baseball Community
ensures safety by creating separate lines of School Cleanup
movement for pedestrians and trucks Participated as volunteers in the baseball classes As a member of its community, IRM has its
for children with disabilities, held by ITOCHU employees participate in community cleanup in
Corporation the neighborhood.
Initiatives for Employees
Support for acquiring expertise
TOKYO Work-Style Reform Declaration Measures against COVID-19
In collaboration with the ITOCHU Group, actively support for study session / correspondence course
Approved as a company committed to “TOKYO Work-Style for employees
For reduction of infection risks,
Reform Declaration,” a program promoted by the Tokyo
Metropolitan Government ・Study session for obtaining the qualification
1. wearing masks, installing
Improve ・ Hourly paid leave disinfections, splash prevention of real estate transaction agent
employees’ ways Allowing employees to take leaves on an partitions in conference rooms and
The ITOCHU Group holds a study session every
of taking leave hourly basis shoe cleaning mats at the entrance
week inviting outside lecturers
・Sliding working hours Several employees of the Asset Management
Improve 2. promoting the working from home
employees’ ways Allowing employees to adjust starting and Company also participate in it
and flex time
of working finishing times of daily working hours
19Initiatives for ESG (G)
Amend Management Fees to Further Align Interests with Unitholder
Implemented amendment the management fee structure to further align interests
with unitholder
Further enhanced commitment of the Asset Management Company towards Earning per unit (EPU) growth
Management fee structure committing to
resolving challenges imposed on IAL Current Proposed change
Plan to apply new percentage from the 5th FP (Jan. 2021)
Reduce the percentage by half
Expand the asset size which is Management Total assets ×0.2%
Total assets×0.1% (upper limit)
relatively small fee I (upper limit)
Maintain and further expand
property value through Management NOI of rental business × 5.0% NOI of rental business×5.0%
successful leasing and fee II (upper limit) (upper limit)
continuous cost saving
Enhance EPU and distribution Income before income taxes ×
Management Income before income taxes ×
per unit (DPU) to meet Adjusted EPU×0.005%
fee III Adjusted EPU×0.005% (upper limit)
investors’ expectation (upper limit)
Uniformly apply the lower percentage;
Abolish asset disposition fees in case of loss-
Asset Asset disposition price ×1.0% incurring transaction
disposition fee (upper limit) Disposition price × 0.5% (upper limit)
(0.5% only for disposition of assets to interested parties) (0% where loss on asset disposition is incurred)
• Halve the upper limit of percentage applicable to calculation of the “Management fee I” (i.e., portion linked to total assets )
• Change the percentage applicable to calculation of “Management fee III” linked to EPU within the upper limit* (with the upper limit unchanged)
thereby lowering the percentage of “Management fee III” to total management fees.
(The amended total management fees are expected to be the same level as the estimated total management fees for the 5th fiscal period (Jan. 2021))
• Halve the percentage applied to calculation of asset disposition fees for disposition of assets to third parties other than interested parties.
In addition, abolish the asset disposition fees if loss on asset disposition is incurred.
* The actual percentage applicable is scheduled to be resolved by IAL’s Board of Directors meeting within the upper limit 20Initiatives for ESG (G)
Investment Unit Holing Program for Sponsor and Asset Management Company Employees
Proactively promote alignment of interests of the sponsor, ITOCHU Corporation, with those of unitholders
ITOCHU Corporation's investment ratio in IAL
ITOCHU Corporation acquired additional ITOCHU Corporation maintains its
investment units of investment ratio of approx. 7% even after
IAL in the market the first post-IPO public offering
5% 7.0% 7.0% 6.9%
(as of IPO) (as of the end of Jul. 2019) (as of the end of Feb. 2020) (as of the end of Jul. 2020)
Align interests of the Asset Management Personnel structure mainly consisting of
Company’s employees with those of unitholders employees not seconded from sponsors
• Full-time directors of the Asset Management Company Personnel structure of asset management companies
started utilizing the cumulative investment unit investment
program* (as of Sep. 1, 2020)
• As for non-director employee investment unit ownership Of which, employees seconded
program has been introduced Total from the ITOCHU Group
• Facilitate the alignment of interests of unitholders with those Full-time Director 2 0
of the Asset Management Company’s directors and employees
Employees 13 2
Total 15 2
• Representative director, president & CEO has resigned from sponsor and joined the Asset
Management Company. No seconded employees are appointed to serve positions of general
manager or above
• One employee is seconded from ITOCHU Corporation and one from ITOCHU Property Development
21Portfolio
22Acquisition of Quality Properties Further Improves the Portfolio
Further improved the quality portfolio which is characterized by long-term stability achieved
through selective investment, tenant stickiness, and strong sponsor support (as of Jul. 31, 2020)
Portfolio with Young and Long-term Contracts
Strong Sponsor Support Conveniently Located Properties with Quality Tenants
Realty and Group-wide
Convenient Young Long-term lease
Logistics (R/L) Merchant Channel Properties Quality tenants
(M/C) platform location contract
platform
Properties developed by sponsor Location Remaining lease term
(based on acquisition price) (based on acquisition price) (based on annual rent)
Less than 1 year 5.6 %
Others
Ken-O EXPWY 6.3 % 1 year or more
Around Tokyo to less than 3 years
0.9 % Gaikan EXPWAY
9.7 %
Around National
98.7 % 7.3 % Route 16 and Tokyo Average period
Gaikan EXPWY
(End of the 3rd FP) 5.6 years
91.0% (End of the 3rd FP)
99.1 % Developed by sponsor
(End of the 3rd FP)
7 years or more
62.4 % 6.2 years
3 years or more
to less than 5 years
99.1 % 93.7 % Around National
Route 16 20.0 %
86.4 % 5 years or more
to less than 7 years
2.3 %
The ITOCHU Group and the Group customer tenant Property age Tenant industry
(based on annual rent) (based on acquisition price) (based on annual rent)
Others
More than 7 years Manufacturer 2.3 %
19.1 % 7.2 % Retail 7.2 %
Average
property age E-commerce
3PL *1
The ITOCHU Group 73.2 % 3.6 years + major 3PL ratio
8.0 % (End of the 3rd FP) More than 1 year 51.2 % E-commerce
More than 3 years (End of the 3rd FP)
to 3 years or less 69.2%
80.9% 39.3 %
The ITOCHU Group
customers
to 7 years or less
33.3 % 3.5 years 59.5 % (End of the 3rd FP)
72.9 % 78.1 %
The major 3PL*2
38.7 %
*1 Ratios are rounded to the first decimal place.
*2 3PL stands for third-party logistics, which is defined as a firm or a third party that offers a comprehensive logistics innovation to shippers from product orders and inventory management, and is entrusted with comprehensive logistics services.
*3 Major 3PLs mean 3PLs with consolidated sales exceeding 100 billion yen including such 3PLs.
*4 Remaining lease term for the 5th FP (Jan 2021) is calculated based on the contract period after the re-signing of the lease agreement.
23Market Overview
24Market Overview (1) Supply / Demand Balance of Logistics Facilities
Logistics market in Kanto / Kansai area
Vacancy Rate and Supply and Demand Balance in Kanto Area Vacancy Rate by Metropolitan Area
(Thousands of m2) (%) (%)
3,500 6
12
3,000 5
10
2,500
4 8
2,000 Vacancy rate has remained low in Kanto area.
3 6
1,500 In National Route 16 where had new supply
2 4
1,000 continued, vacancy rate has improved significantly to
500 1 2 less than 1%.
0 0 0
2015 2016 2017 2018 2019 2020 2021 (year) Jan. Apr. Jul. Oct. Jan. Apr. Jul. Oct. Jan. Apr. Jul. Oct. Jan. Apr. Jul.
(Estimate)
(予測) (Estimate)
(予測) 2017 2017 2017 2017 2018 2018 2018 2018 2019 2019 2019 2019 2020 2020 2020
New supply
新規供給(左軸) New demand
新規需要(左軸) Vacancy rate
空室率(右軸)
(left axis) (left axis) (right axis) 臨海エリア
Bay area 外環道エリア
Tokyo Gaikan EXPWY area
国道16号エリア
National Route 16 area 圏央道エリア
Ken-O EXPWY area
Vacancy Rate and Supply and Demand Balance in Kansai Area Vacancy Rate by Kansai Area
(Thousands of m2) (%)
1,400 14 (%)
18
1,200 12 16 In Kansai area remains a low vacancy rate
1,000 10 14
12
against the backdrop of strong demand while
800 8 large supply is scarce.
10
600 6 8 It continued to improve vacancy rate in Kansai
400 4 6
4 Bay area, and it remains stable and low vacancy
200 2
2 rate in Kansai Inland area despite large supply.
0 0 0
2015 2016 2017 2018 2019 2020 2021 (year) Jan. Apr. Jul. Oct. Jan. Apr. Jul. Oct. Jan. Apr. Jul. Oct. Jan. Apr. Jul.
(予測) (Estimate)
(Estimate) (予測) 2017 2017 2017 2017 2018 2018 2018 2018 2019 2019 2019 2019 2020 2020 2020
New supply
新規供給(左軸) New demand
新規需要(左軸) Vacancy rate
空室率(右軸)
(left axis) (left axis) (right axis) 関西臨海エリア
Kansai Bay area 関西内陸エリア
Kansai Inland area
Source: K.K. Ichigo Real Estate Service
In addition to existing portfolio, pipeline properties are also located in Kanto area where
the supply / demand balance remains stable
25Market Overview (2) Trends in E-Commerce Related Indicators
Expansion of e-commerce and 3PL markets increases delivery frequency and smaller parcels
Market Size of Online Shopping E-commerce Ratio of Major Countries
(TN Yen)
25.0%
25 Eコマース売上高
E-commerce sales
20.4%
20.0% 18.8%
20
15.0%
15 11.8%
10.4%
10 10.0%
7.9%
5.4% 4.9%
5 5.0%
2.7%
0 0.0%
South
Taiwan
Japan
Malaysia
Singapore
Korea
China
India
U.S.A
中 韓 米 台 日 シ イ マ
2010 2011 2012 2013 2014 2015 2016 2017 2018 2019 国 国 国 湾 本 ン ン レ
(FY) ガ ド ー
ポ シ
ー ア
ル
Source: Outline of the E-Commerce Market Survey (Ministry of Economy, Trade and Industry) Source: Outline of the E-Commerce Market Survey (Ministry of Economy, Trade and Industry)
Changes in the Number of Packages by Home Delivery
and the Volume of Domestic Cargo Transport Changes of the 3PL Market in Japan
(100 MN Yen)
(100 MN Tons) 国内貨物輸送量(左軸)
Volume of domestic cargo transport (left axis) (100 MN units) 3PL sales
3PL売上高
30,000
70 宅配便取扱個数(右軸)
Number of packages by Home delivery (right axis) 50
60 25,000
40
50 20,000
40 30
15,000
30 20
10,000
20
10 5,000
10
0 0 0
2006 2007 2008 2009 2010 2011 2012 2013 2014 2015 2016 2017 2018
(FY) (FY)
Source: Traffic Statistics (Ministry of Land, Infrastructure, Transport and Tourism)
FY2018 Survey of the number of packages by home delivery
(Ministry of Land, Infrastructure, Transport and Tourism) Source: OGI-BIZ (Rhinos Publications, Inc.)
26Appendix
27Basic Strategies (1)
Build a growth spiral based on collaborative growth relationships
By taking advantage of the support provided by the sponsor group, which has a rich history of developing
and acquiring logistics real estate (Reality and Logistics Platform) and a network of approximately 100,000
clients (Group-wide Merchant Channel Platform)
ITOCHU Group’s
business platform
strengthened
through IAL
ITOCHU Advance Logistics Investment Corporation ITOCHU Corporation
Ownership / Management Development / Leasing
Number of Properties Owned ITOCHU Group’s Two Business Platforms
Collaborative Realty and Goup-wide Merchant
v growth Logistics (R/L) Channel (M/C)
Platform Platform
IMP Inzai IMP Noda IMP Kashiwa 2
relationships
Properties Owned / Developed by ITOCHU Corporation
IMP Kashiwa IMP Moriya IMP Chiba-Kita
IAL’s growth supported by IMP Kashiwa 2 IMP Inzai 2
utilizing the ITOCHU
IMP Atsugi IMP Misato IMP Moriya 2
Group’s business platforms
IMP Tokyo-Adachi IMP Ichikawa Shiohama IMP Miyoshi
28Basic Strategies (2)
A dual business platform that provides the foundation for the collaborative growth relationships
Realty and Logistics (R/L) Platform Group-wide Merchant Channel (M/C) Platform
1 Strength in land purchases, facility development and leasing of logistics real 1 Extensive customer network covering 100,000 companies
estate, honed through accumulated development experience since FY2004 2 A wide business domain covering upstream to downstream
2 Experience as a logistics operator merchant channels
3 Utilization of expertise gained in J-REIT management 3 Strong presence in consumer-related businesses
Real Estate & Logistics function of General Products & Realty Company of ITOCHU General trading company that has transactional relationships at
Corporation, which has integrated responsibility for 1 , 2 and 3 the management level encompassing 1 , 2 and 3
Land purchases, facility Merchant channels
1
development and leasing
Developing facilities
Utilizing the viewpoint
suitable for long-term
of a logistics operator, Logistics Logistics Logistics
ITOCHU Corporation ITOCHU Property asset and property
leveraging the network Development, Ltd. Supplier Manufacturer Retailer Consumer
management
of customers Structure for land purchases, facility
development and leasing from two
closely connected sponsors
Group Strength of ITOCHU Corporation
General
Products
& Realty
Metals & Company
2 Logistics operation 3 Asset and property management Minerals
Food
Company
Company
ITOCHU Corporation ITOCHU LOGISTICS CORP. ITOCHU REIT ITOCHU Urban Energy &
Management Co., Ltd. Community Ltd. Textile
Chemicals
Utilization of asset and property Company
Leveraging their expertise as Company
a logistics operator management expertise of Advance
Residence Investment Corporation The ITOCHU Group
ICT &
Machinery Financial
Company Business
Company
Providing logistics solutions The 8th
Company
29The ITOCHU Group
The ITOCHU Corporation has the Construction, Realty & Logistics Division, which is a single organization responsible for handling both the real estate development
business and the logistics solutions business. By bringing together the human resources of the two business sectors, the ITOCHU Group has built a system which
takes integrated responsibility for land purchase, development, leasing and asset and property management in the field of logistics real estate
ITOCHU Corporation includes optimization of value chain and smart distribution systems in its FY 2019-2021 Medium Term Management Plan
ITOCHU Corporation
Integrated Management System for Real Estate Development and Logistics Solutions
Building a foundation for next-generation logistics initiatives
Realty and Logistics (R/L) Platform
ITOCHU Corporation
Land purchase and development Leasing Logistics operations • In collaboration with Mercuria Investment Co., Ltd., ITOCHU
(1) Purchase of land optimally suited for logistics Leasing leveraged through customer (1) Identify leasing needs by networking with other logistics operators Corporation formed a fund to invest in innovation areas in real
(2) Facility development in line with tenant needs (2) Feed expertise in logistics operations into logistics real estate development estate and logistics sectors, with an aim to actively deliver services
generated by the fund to tenants
Overall management coordinating all Group companies
Second largest unitholder
As of April 1, 2020, an existing team
specializing in acquisition of land for Development
ITOCHU
logistics facilities was further Leasing Corporation Investment Fund management
enhanced by being incorporated in (Partner) and Investment
the newly established "General /
Logistics Business Division" Land purchase
Asset and Outside
property management Investors BizTech Fund
Investment
ITOCHU Property Development, Ltd. ITOCHU Urban Community Ltd.
Land purchase and development Management Next-generation initiatives in logistics
(1) Purchase of land optimally suited for logistics real estate (1) Expertise in the operation and management of logistics real estate
(2) Facility development in line with tenant needs (2) Expertise in the management of J-REIT properties
Advancement and labor saving
ITOCHU REIT Management Co., Ltd. • Warehouse: Robot, Material handling, Drone
Asset management
• Transportation: driver matching, IoT delivery hub,
automatic driving, RFID
(1) Expertise in J-REIT management
(2) Investor relations based on long-term holding and management of
assets
30About the Investment Corporation and the Asset Management Company
Structure Investment Corporation Custodian General Administrative Agent
(for institutional administration / calculation / accounting)
ITOCHU Advance Logistics Investment Corporation
Sumitomo Mitsui Trust Bank, Limited
Master Lease and
Property Management Company General Unitholders Meeting
General Administrative Agent
(for tax payment)
ITOCHU Urban Community Ltd. Board of Directors
Deloitte Tohmatsu Tax Co.
Executive Director: Junichi Shoji
Supervisory Director: Soichi Toyama
Supervisory Director: Tsuyoshi Dai Transfer Agent
Sponsors Mizuho Trust & Banking Co., Ltd.
Accounting Auditor
①
ITOCHU Corporation
Administrative Agent
PricewaterhouseCoopers Arata LLC (of Investment Corporation Bonds)
②
ITOCHU Property Development, Ltd.
Sumitomo Mitsui Trust Bank, Limited
(1) Sponsor Support Agreement / Leasing Management
Agreement
(2) Sponsor Support Agreement Asset Management Company
ITOCHU REIT Management Co., Ltd.
Shareholder’s Meeting
Overview of the Asset Management Company As of the end of Jul. 2020 Corporate Auditors
Company name ITOCHU REIT Management Co., Ltd. Board of Directors
Established February 15, 2017
Capital 200 million yen Investment Committee Compliance Committee
ITOCHU Corporation 80% President
Shareholders
ITOCHU Property Development, Ltd. 20%
Main business Investment management Compliance Officer
Number of employees 19 (of which, officers (part-time): 4)
Financial Instruments Business License, Director of the Compliance & Risk
Internal Audit Department Management Department
Kanto Finance Bureau, (Kinsho) Registration No. 3027
Building Lots and Building Transactions Business License,
Licenses and
Governor of Tokyo (1) No. 100434
registrations
Discretionary Transaction Agent License, Minister of Land,
Investment & Asset General Affairs & Human
Finance & Planning Department
Management Department Resources Department
Infrastructure, Transport and Tourism, Registration No.
121
31Incorporation of Quality Properties toward More Solid Portfolio
Continue to build a long-term stable portfolio by additionally acquiring new assets ( As of July 31,2020 )
Book value
Acquisition Appraisal Unrealized Appraisal Total floor Property Occupancy
Property at the end of
Category Property name Location price value gains NOI yield area age rate
No. the period
(MN Yen) (MN Yen) (MN Yen) (%) (m2) (years) (%)
(MN Yen)
Bld. A: 3,909.97
L-1 i Missions Park Atsugi Atsugi city, Kanagawa 5,300 5,233 5,850 616 5.0 7.9 100
Bld. B: 15,387.63
L-2 i Missions Park Kashiwa Kashiwa City, Chiba 6,140 6,013 6,840 826 5.1 31,976.44 5.4 100
L-3 i Missions Park Noda Noda City, Chiba 12,600 12,329 13,800 1,470 4.9 62,750.90 4.5 99.5
Tsukuba Mirai City,
L-4 i Missions Park Moriya 3,200 3,114 3,460 346 5.2 18,680.16 3.3 100
Ibaraki
properties
Acquired
L-5 i Missions Park Misato Misato City, Saitama 6,100 5,995 6,940 945 5.0 22,506.53 3.0 100
L-6 i Missions Park Chiba-Kita Chiba City, Chiba 2,600 2,564 2,850 285 5.3 9,841.24 2.7 100
L-7 i Missions Park Inzai Inzai City, Chiba 27,810 27,265 29,800 2,534 5.1 110,022.51 2.4 100
Tsukuba Mirai City,
L-8 i Missions Park Moriya 2 750 754 849 94 6.6 6,779.95 25.6 100
Ibaraki
i Missions Park Kashiwa 2
117,435.21
L-9 (70% quasi-co-ownership Kashiwa City, Chiba 19,600 19,672 20,600 927 4.8 1.9 100
(82,204.64)
interest)
Total / Average 399,290.54
84,100 82,941 90,989 8,047 5.0 3.5 99.9
(364,059.97)
(4th fiscal period (July. 2020))
*1 Book value at the end of the fiscal period and unrealized gains are rounded down to the nearest unit.
*2 Appraisal NOI yield is based on acquisition price. Figures are rounded to the first decimal place.
*3 For i Missions Park Kashiwa 2, the figure in parentheses under total floor area is calculated in proportion to IAL’s quasi-co-ownership interest to the property rounded
down to the second decimal place.
*4
*5
Property age rounded to the first decimal place.
Occupancy rate indicates the ratio of leased area to leasable area, rounded to the first decimal place. 32Income Statement and Balance Sheet
4th fiscal period (July 2020)
(Thousands of Yen)
Income Statement 4th Fiscal Period (Thousands of Yen) (Thousands of Yen)
From February 1, 2020
Balance Sheet 4th Fiscal Period 4th Fiscal Period
to July 31, 2020 As of July 31, 2020 As of July 31, 2020
Operating revenues Assets Liabilities
Rental revenues 2,366,156 Current assets Current Liabilities
Other rental revenues 33,514 Cash and deposits 1,233,358 Accounts payable 16,672
Total operating revenue 2,399,671 Cash and deposits in trust 3,050,151 Short-term loans payable 1,513,000
Operating expenses Accounts receivable-trade 60,980 Accounts payable-other 75,008
Property related expenses 877,123 Accounts receivable - Accrued expenses 341,586
Asset management fees 278,081 Consumption taxes receivable 1,439,041 Consumption taxes payable 863
Asset custody fees / Administrative service Prepaid expenses 47,426 Income taxes payable -
9,455 Other 1
fees Advances received 448,662
Directors' compensation 2,640 Total current assets 5,830,960 Other 4,020
Other operating expenses 38,745 Non-current assets Total current liabilities 2,399,813
Total operating expenses 1,206,045 Property, plant and equipment Noncurrent liabilities
Operating income 1,193,626 Buildings in trust 49,331,346 Investment Corporation Bonds 1,500,000
Non-operating income Accumulated depreciation (1,677,956) Long-term loans payable 33,140,000
Interest income 15 Buildings in trust, net 47,653,390
Structures in trust 1,752,077 Tenant leasehold and security deposits -
Interest on refund -
Subsidy income - Accumulated depreciation (135,774)
Tenant leasehold and security deposits in trust 1,184,544
Total non-operating income 15 Structures in trust, net 1,616,302
Machinery and equipment in trust 1,405,699 Other 2,697
Non-operating expenses
Accumulated depreciation (79,439) Total noncurrent liabilities 35,827,242
Interest expenses on loans payable 78,571
Machinery and equipment Total liabilities 38,227,055
Interest expenses on investment 1,326,260
2,225 in trust, net
corporation bonds
Tools, furniture and fixtures in trust 2,084 Net assets
Amortization of investment unit issuance 20,687
Accumulated depreciation (323) Unitholders' equity
Amortization of investment corporation
1,276 Tools, furniture and fixtures in trust, net 1,760 Unitholders' capital 49,968,443
bond issuance costs
Borrowing related expenses 27,736 Construction in progress in trust -
Deductions from unitholder’s capital
Other 16,088 Land in trust 32,344,067
Total property, plant and equipment 82,941,782 Reserve for temporary difference
Total non-operating expenses 146,586 (7,142)
Intangible assets adjustments
Ordinary income 1,047,055 Other deductions from unitholder’s capital (279,642)
Income before income taxes Software 3,662
1,047,055
Total intangible assets 3,662 Total deductions from unitholder’s capital (286,785)
Income taxes-current 865
Investments and other assets
Income taxes-deferred 2 Unitholders’ capital, net 49,681,657
Lease and guarantee deposits 10,000
Total income taxes 868 Surplus
Long-term prepaid expenses 157,618
Net income 1,046,187 Unappropriated retained earnings
Deferred tax asset 12 1,046,383
Accumulated earnings brought forward 196 (undisposed loss)
Total investments and other assets 167,630
Unappropriated retained earnings Total surplus 1,046,383
1,046,383 Total noncurrent assets 83,113,074
(undisposed loss) Total unitholders' equity 50,728,041
Deferred assets
Total net assets 50,728,041
Investment corporation bond issuance costs 11,061
Total liabilities and net assets 88,955,097
Total deferred assets 11,061
Total assets 88,955,097 33Revenue and Expenditure for Each Properties
4th fiscal period (July 2020) (Thousands of Yen)
Property number L-1 L-2 L-3 L-4 L-5 L-6 L-7 L-8 L-9
i Missions i Missions i Missions i Missions i Missions i Missions
i Missions i Missions i Missions
Property name Park Park Park Park Chiba- Park Park Total
Park Atsugi Park Noda Park Inzai
Kashiwa Moriya Misato Kita Moriya 2 Kashiwa 2
Number of operating days
182 days 182 days 182 days 182 days 182 days 182 days 182 days 182 days 180 days -
in the 4th fiscal period
(A) Total revenues
408,708 2,399,671
from property leasing
Rental revenues 393,511 2,366,156
Other rental revenues 15,197 33,514
(B) Total property-related
175,366 877,123
expenses
Taxes and public dues 40,003 160,284
- - - - - - - -
Property management fees 20,598 38,259
Utility expenses 14,616 23,313
Repair expenses 977 8,072
Insurance expenses 1,219 7,333
Trust fees 250 1,903
Others 9 39
Depreciation 27,824 45,461 97,691 29,813 39,064 16,554 232,452 7,607 141,446 637,916
(C) Income from property
103,573 108,103 233,342 62,680 113,454 52,559 439,529 19,628 389,676 1,522,548
leasing (A) - (B)
(D) NOI (= (C) + depreciation) 131,398 153,564 331,034 92,494 152,518 69,113 671,982 27,236 531,122 2,160,464
* For properties other than i Missions Park Noda, items other than depreciation, leasing business gains and losses, and leasing business NOI are undisclosed as IAL was not able to obtain the tenant’s consent.
Figures are rounded down to the nearest thousand yen.
34Overview of Appraisal Value
As of the end of the 4th fiscal period (July 2020)
Unrealized
Acquisition Book value Appraisal Direct cap
gains
Category Property No. Property name Location price (A) value (B) rate
(B)-(A)
(MN Yen) (MN Yen) (MN Yen) (%)
(MN Yen)
L-1 i Missions Park Atsugi Atsugi city, Kanagawa 5,300 5,233 5,850 4.4 616
L-2 i Missions Park Kashiwa Kashiwa City, Chiba 6,140 6,013 6,840 4.5 826
L-3 i Missions Park Noda Noda City, Chiba 12,600 12,329 13,800 4.4 1,470
Tsukuba Mirai City,
L-4 i Missions Park Moriya 3,200 3,114 3,460 4.7 346
Ibaraki
Logistics real estate L-5 i Missions Park Misato Misato City, Saitama 6,100 5,995 6,940 4.3 945
L-6 i Missions Park Chiba-Kita Chiba City, Chiba 2,600 2,564 2,850 4.7 285
L-7 i Missions Park Inzai Inzai City, Chiba 27,810 27,265 29,800 4.6 2,534
Tsukuba Mirai City,
L-8 i Missions Park Moriya 2 750 754 849 4.9 94
Ibaraki
i Missions Park Kashiwa 2
L-9 Kashiwa City, Chiba 19,600 19,672 20,600 4.4 927
(70% quasi-co-ownership interest)
Total
84,100 82,941 90,989 - 8,047
(As of the end of the 4th fiscal period)
* Book value and unrealized gains and losses are rounded down to the nearest unit.
35Status of Unitholders
4th fiscal period (July 2020)
Number of unitholders and units by type of unitholders Major unitholders (Top 10 unitholders)
Percentage
Investment No. of
Unit holders Ratio Ratio of units
units (unit) Name units
issued and
held
outstanding
Individuals and others 10,647 96.0% 69,109 14.2% 1 Custody Bank of Japan, Ltd. (Trust Account) 81,061 16.7%
The Master Trust Bank of Japan, Ltd.
2 69,498 14.3%
Financial institutions (Trust Account)
(including securities 129 1.2% 315,578 64.9%
companies) 3 ITOCHU Corporation 33,635 6.9%
Custody Bank of Japan, Ltd.
Other domestic entities 214 1.9% 44,904 9.2% 4 29,148 6.0%
(Securities Investment Trust Account)
The Nomura Trust and Banking Co., Ltd.
5 11,980 2.5%
(Investment Trust Account)
Foreign entities 100 0.9% 56,409 11.6%
6 Mitsubishi UFJ Morgan Stanley Securities Co., Ltd. 10,732 2.2%
Total 11,090 100.0% 486,000 100.0%
7 The Hachijuni Bank, Ltd. 9,782 2.0%
Breakdown by number of unitholders Breakdown by number of units 8 The Shinkumi Federation Bank 9,480 2.0%
Foreign entities
Foreign entities Individuals and
0.9%
11.6% others
Other domestic 14.2%
entities Individuals and
Other domestic 9 THE HYAKUJUSHI BANK, LTD. 9,124 1.9%
1.9% entities
others
9.2%
96.0%
Financial 10 BNYMSANV RE GCLB RE JP RD LMGC 7,029 1.5%
institutions Financial institutions
1.2% 64.9%
Total (top 10 unitholders) 271,469 55.9%
* Percentages are rounded to the first decimal place.
36You can also read