Investors information pack - September 2019 - PA Housing
←
→
Page content transcription
If your browser does not render page correctly, please read the page content below

Investors information pack
        September 2019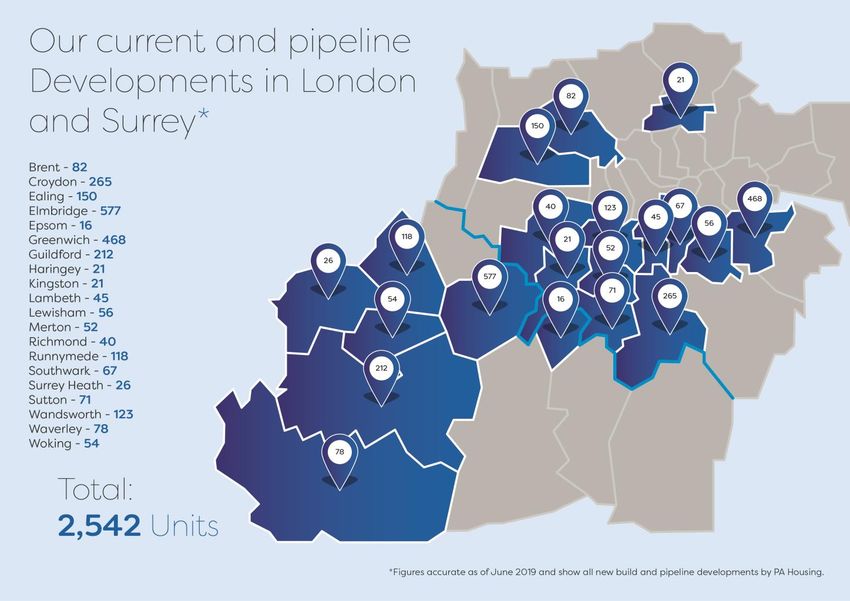
Disclaimer
The information contained in this investor presentation including the presentation slides and any related speeches made or to be made by the management of Paragon Asra
Housing Limited (“PA”), any questions and any answers thereto or any related verbal or written communications in respect thereof (the “Presentation”) has been prepared to
assist interested parties in making their own evaluation of PA. This presentation is believed to be in all material respects accurate and does not purport to be all-inclusive.
This Presentation and its contents are strictly confidential, are intended for use by the recipient for information purposes only and may not be reproduced in any form or further
distributed to any other person or published, in whole or in part, for any purpose. Failure to comply with this restriction may constitute a violation of applicable securities laws. By
reading this Presentation, you agree to be bound by the following limitations. Neither PA nor any of its representative directors, officers, managers, agents, employees or advisors
or their respective affiliates, advisors or representatives, makes any representations or warranty (express or implied) or accepts any responsibility as to or in relation to the
accuracy or completeness of the information in this Presentation (and no-one is authorised to do so on behalf of any of them) and (save in the case of fraud) any liability in
respect of such information or any inaccuracy therein or omission therefrom is hereby expressly disclaimed, in particular, if for reasons of commercial confidentiality information on
certain matters that might be of relevance to a prospective purchaser has not been included in this Presentation.
No representation or warranty is given as to the achievement or reasonableness of any projections, estimates, prospects or returns contained in this Presentation or any other
information. Neither PA nor any other person connected to it shall be liable (whether in negligence or otherwise) for any direct, indirect or consequential loss or damage suffered
by any person as a result of relying on any statement in or omission from this Presentation or any other information and any such liability is expressly disclaimed. This
Presentation includes certain statements, estimates and projections prepared and provided by the management of PA with respect to the anticipated future performance of the
group. Such statements, estimates and projections reflect various assumptions by PA’s management concerning anticipated results and have been included solely for illustrative
purposes. No representations are made as to the accuracy of such statements, estimates or projections or with respect to any other materials herein. Actual results may vary from
the projected results contained herein.
This Presentation is made to and is directed only at persons who are (a) “investment professionals” as defined under Article 19 of the Financial Services and Markets Act 2000
(Financial Promotion) Order 2005, as amended (the “Order”) or (b) high net worth entities falling within article 49 (2) (a) to (d) of the Order (all such persons together being
referred to as “relevant persons”). Any person who is not a relevant person should not act or rely on this Presentation or any of its contents. Any investment or investment activity
to which this Presentation relates is available only to and will only be engaged in with such relevant persons.
The information presented herein is an advertisement and does not comprise a prospectus for the purposes of EU Directive 2003/71/EC (as amended) (the “Prospectus
Directive”) and / or Part VI of the Financial Services and Markets Act 2000. This Presentation does not constitute or form part of, and should not be construed as, an offer to sell,
or the solicitation or invitation of any offer to buy or subscribe for, bonds in any jurisdiction or an inducement to enter into investment activity. No part of this Presentation, nor the
fact of its distribution, should form the basis of, or be relied on in connection with, any contract or commitment or investment decision whatsoever. Any purchase of bonds should
be made solely on the basis of a final prospectus to be prepared in connection with the bonds (which will supersede the Presentation in its entirety), which will contain the
definitive terms of the transactions and be made public in accordance with the Prospectus Directive and investors may obtain a copy of such final document from the National
Storage Mechanism.
The distribution of this Presentation and other information in certain jurisdictions may be restricted by law and persons into whose possession this Presentation or any document
or other information referred to herein comes should inform themselves about and observe any such restrictions. Any failure to comply with these restrictions may constitute a
violation of the securities laws of any such jurisdiction. This Presentation and any materials distributed in connection with this Presentation are not directed to, or intended for
distribution to or use by, any person or entity that is a citizen or resident or located in any locality, state, country or other jurisdiction where such distribution, publication,
availability or use would be contrary to law or regulation or which would require any registration or licensing within such jurisdiction. PA does not accept any liability to any person
in relation to the distribution or possession of this presentation in or from any jurisdiction.

2

PA Housing Overview
Key Credit Highlights Areas of Operation
A3
23,100 G1 / V1
(Stable)
homes rating
Moody’s
Turnover £1.6bn
£160m Housing
2018/19 Assets
39% 2.08x
Gearing
Operating Interest
40%
Margin Cover
Traditional general needs provider operating across
London, Surrey and the East Midlands
Growing shared ownership portfolio with no current private
sales activity (7% of turnover from all sales 18/19)
Organic growth plan of 5,700 homes over 10 years (2.6%
pa)
800 peripheral units sold to other Housing Associations
Paragon issued £250m bond (of which £25m retained) in
2015
3
Our Heritage
• Family First founded to provide housing and support for
Formed in 2017 through the merger of teenage mothers in Nottingham
1965
Paragon and asra
Paragon’s roots were in stock transfer from • Richmond-upon-Thames Churches Housing Trust (RuTCHT)
incorporated
Elmbridge Borough Council (Surrey) 1967
asra was created as a Black and Minority
• Leicester Housing Association (LHA) is founded
Ethnic organisation 1973
asra’s history and legacy remains important
• asra Greater London Housing Association (AHA) founded to
to PA. We work to ensure that no one is provide homes for Asian people in need
1984
excluded from our homes or from
employment with us for any unjustifiable • Elmbridge Housing Trust (EHT) is established as a Large
Scale Voluntary Stock Transfer from Elmbridge Borough
reason 2000 Council
Full business integration completed within
two years of merger • LHA, asra and Family First form LHA-ASRA Group
2006
£4 million recurring savings delivered through
the merger • Paragon Community Housing Group (PCHG) is founded when
EHT and RuTCHT join together
2007
Well positioned to consider future merger
opportunities where viewed as strategically
• AHG and PCHG amalgamate and PA Housing is born.
beneficial 2017
4
Our Purpose, Values and Objectives

     Purpose                 Values               Objectives
Passionate about       • Always do the right   • Focus on customer
delivering more          thing                   services
affordable homes and   • There when you need   • Harmonised and
great services           us                      effective culture and
                       • We never give up        structures
                                               • Growth to provide
                                                 more homes

5
Northolt, Ealing
                            Overview

Anvil Road, Lower Sunbury
Demand for Homes in Key Localities
PA Units                                               Median Terraced House Price (source: ONS)
 6,000                                                   800,000

 5,000
                                                         600,000
 4,000

 3,000                                                   400,000

 2,000
                                                         200,000
 1,000
                                                              0
     0

Median 2 Bedroom Monthly Rent vs PA Average (source: Valuation Office Agency)

     1,800
     1,600
     1,400
     1,200
     1,000
         800
         600
         400
                                                        48%             49%
                     45%                    34%
         200                     62%                                                59%
           0
 7             Elmbridge   Leicester   Richmond   Greenwich        Kingston   Nottingham
Areas of Operation

                                           Waiting list numbers
    16,000
    14,000
    12,000
    10,000
     8,000
     6,000
     4,000
     2,000
         0
               Elmbridge       Leicester      Richmond   Greenwich   Kingston   Nottingham

    Source: Local authority waiting lists June 2019
8
Simple Corporate Structure

                                  Paragon Asra Housing Ltd
                                     (asset holding RP)

                Franklands Park Ltd
              (small operations JV to
            manage an estate in Surrey)

                                   Paragon Development and      asra Construction
     Paragon Treasury plc          Construction Services Ltd       Services Ltd
    (bond issuance vehicle)           (legacy construction     (active construction
                                       services company)       services company)

9
Board Members
Hattie Llewelyn-Davies (Chair) Wayne Morris
Long career in housing / homelessness Former Chief Executive at Spectrum HG
OBE for services to homeless people Over 30 years sector experience
Sunday Times Non-Exec of the Year 2019 Vice-Chair at Yarlington HG
Anne Turner (Chair, Audit & Risk Committee) Katie Lyons
Was FD at Orbit HG for many years Solicitor and Notary Public
Sits on two other large HA Boards Works in local government
Member of SHPS Employers’ Committee Earlier career at Canary Wharf Group / Airbus
David Edwards (Chair ACSL / PDCSL / N&R Cmee) Steve Amos
Chartered Surveyor Former Head of Social Housing at Barclays
Member of CIH Policy Advisory Committee 30 years sector financing experience
Director positions at LAs / govt agencies Served on Board at Funding Affordable Homes
Chris Cheshire (Chair, Customer Services Cmee) Curtis Juman
Chartered Construction Manager Qualified accountant, currently FD at Ofcom
Over 30 years in HA / property sector Previous roles at Deloitte, Westminster Abbey
Now runs his own consultancy Board experience at other HAs and elsewhere
David Hunter (Chair, Development & Assets Cmee) Dilip Kavi (Chief Executive)
Retired Chartered Accountant Worked in housing sector since 1995
Career at PwC followed by private equity work Joined Paragon as CEO in 2011
Several charity / social enterprise non-exec roles Earlier career in automotive industry
10Opportunities and Challenges
Financial stability and resilience
Strong Board and effective Executive Team
Staff buy-in to deliver excellent services
Excellent Resident Council and scrutiny teams
Measured growth in areas of high demand
Rent certainty from 2020 is positive
Housing high on the political agenda
But…….
Health & Safety compliance hurdles are
Brexit-led uncertainties
increasing
11PA and ESG
EPC ratings Average SAP rating: 70 (band C)
1% 1% Homes with solar: 470
8% A
‘C’ rated window / door upgrades this year: 892 homes
19% £5.5m investment
B
‘A’ rated central heating upgrades this year: 1,085 homes
C £3.7m investment
33% D Insulation upgrades this year: 1,303 homes
£1.6m investment
E
38% F/ Strategy in place to address lower performing EPC properties
G Ongoing project to install LED lighting in all communal areas
Hardship fund to support customers facing fuel poverty
We undertake numerous projects, work with equality organisations, and hold
Accreditations events in-house and across our communities to raise awareness of inequality and
to ensure inclusion for all:
• We train employees in equality, diversity and inclusion best practice, on topics as
varied as autism awareness, welfare benefits advice, and deafness awareness
• Many staff are multi-lingual. We offer documents in more than 10 languages.
Some staff use British Sign Language
• We support victims and survivors of domestic abuse, working with charities that
run refuges. One of our schemes is a supported mother and children unit
• We have adopted the NHF Commitment to Refer on homelessness
• Mental health first aid training is now given to all line managers
• All recruitment (including at Board and Executive level) is in accordance with
established best practice, aiming to recruit the best possible people regardless of
background
12‘Team Purple’ out and about
Business Operations
Staff Diwali celebrationsHousing Stock and House Price Trends
Age Profile of Stock Terraced House Price Trends (source: ONS )
£’s
Greenwich, Kingston, Nottingham
2007+ 4,192 900,000 England and Wales Elmbridge
Richmond upon Thames Greenwich
2003-2006 1,181
800,000 Kingston upon Thames
1996-2002 1,609
700,000
1991-1995 1,813
600,000
1983-1990 2,761
Richmond 500,000
1976-1982 2,244
Leicester
400,000
1967-1975 1,564
Elmbridge
1950-1966 2,226 300,000
1930-1949 1,075 200,000
1900-1929 1,118
100,000
Pre 1900 882
0
2016
2000
2001
2002
2003
2004
2005
2006
2007
2008
2009
2010
2011
2012
2013
2014
2015
2017
2018
0 1000 2000 3000 4000 5000
Number of Units
14 Source: ONS (median prices for terraced houses)Demographics and Tenure Mix
Customers by Ethnicity Staff by Ethnicity
1% 1%
3%
3% 3%
4%
6% White British
White British
Asian 8%
11% Asian
Black
Black
White other
61% Mixed race
16% Mixed race
27% 56% White other
White Irish
Other
Other
Number of Customers Occupying Each Home Tenure mix
Social rent
832 828 Affordable rent
7% Sheltered / supported
Other rented
7% 1422
One person Non-social rented
365 1425 Shared ownership
33% Two people Leaseholders
11% 331
Three people Managed for others
Owned not managed
Four people
2522 13131
14% Five people
Six + people
28% 2203
15Rent Collection and Sector Considerations
2018/19 2017/18
Gross Rent Arrears 3.41% 3.56%
Universal Credit Arrears 5.15% n/a
Void Rent Loss 1.19% 0.91%
Average Re-Let Time 29.5 days 29.8 days
Universal Credit:
1,700 UC cases to date
Projected total 9,000
Experience to date is short term arrears spike, then arrears tail off towards normal levels as interventions take hold
Fire Safety:
43 ‘high rise’ buildings
2 are ACM clad and 3 are HPL clad
Of the above, 4 are 9 stories or smaller of which 2 are only partially clad on the top 2 storeys and 1 is being decanted
prior to remodelling. The other building has a full sprinkler system. All our buildings have fully appropriate safety
regimes in place
Modest additional capex to address changing health and safety compliance environment
16Achievements Since Merger
(1) Management & Infrastructure (2) Stock (3) Finance
ICT harmonisation delivered Strong progress made on stock £3.8m recurring savings
rationalisation – aim to reduce achieved
Senior management structure from 74 LA’s to 60
reviewed and new Leadership Plentiful lines of liquidity
Team established First phase of Woolwich maintained
regeneration rolled out
Finance, HR, Communications (including new office and tenant £160m derivatives portfolio
teams established in Leicester training scheme) efficiently managed
All staff employed on same Stock investment increased to Robust financial business plan in
terms & conditions enhance stock condition – place
£33m extra spend over 5 years
Fully mobile workforce – our Moody’s A3 Stable rating
staff can log-on from anywhere Continued focus on resident maintained
health and safety management
Integration monitored by a Bank / investor relations building
Critical Friend (RSM) in advance of next financing
17Achievements Since Merger
(4) Performance (5) Service (6) Digitalisation
Operational KPIs have been Extra investment in stock over Channel shift: 34% (i.e.
strong and consistent since next 5 years to equalise stock customers using digital rather
amalgamation condition than the phone)
Strong results culture supported New repairs arrangements for Total registrations: 8,400 / Active
by investment in IT London launched in February users: 7,400
Customer satisfaction is our Single PA Housing Contact Payments via digital last 12
priority – improving trend but Centre from February 2019 months: £5m
more work to do
Investment in staff App Repairs raised online growing
rapidly – 11% of all online
Introduction of data analytics to transactions
improve customer service
£1m investment in more
customer facing staff
18One Woolwich, Greenwich
Development
Railton Place, WeybridgeDevelopment Programme
Split by Location Split by Tenure
10% 5%
London Affordable / Social Rent
South East (Surrey) Shared Ownership
50% 40%
40% Midlands Market Sale
55%
Projected Programme and Considerations
Targeting 5,700 new homes over the next 10 years
Limited growth in Central London activity
Maintaining geographic diversification
Supply and demand fundamentals remain positive
Mortgage availability remains strong in our localities
Close monitoring by Board and Exec
Exit / mitigation strategies regularly reviewed – sale vs tenure flip
Liquidity impact of a ‘zero sales’ environment rigorously tested and monitored
20Current Pipeline – London and Surrey 21
Spend projections – next 5 years
Committed £m                                              Uncommitted £m

70                                                        300
                                                                Land bank
                               Private sale

60                                                              Private sale
                               Shared ownership           250
                                                                Shared ownership
                               Social / affordable rent
50
                                                          200   Social / affordable rent

40
                                                          150
30

                                                          100
20

                                                           50
10

 0                                                          0
     19/20     20/21   21/22     22/23        23/24              19/20         20/21       21/22   22/23   23/24

22
Breakdown of Current / Pipeline Activity
(> 50 units per local authority area only)
On site Pipeline
S106 Land led Rent SO S106 Land led Rent SO
Croydon 1 1 12 29 0 6 24 200
Greenwich 1 0 85 20 1 1 239 124
Merton 0 1 21 31 - - - -
Southwark 0 1 18 39 0 1 3 7
Wandsworth 6 0 3 105 2 0 3 12
Elmbridge 4 2 87 54 0 9 316 120
Guildford 1 0 42 18 2 1 105 47
Brent - - - - 0 2 42 40
Ealing - - - - 0 1 105 45
Lewisham - - - - 0 2 10 46
Sutton - - - - 0 1 16 55
Runnymede - - - - 0 3 106 12
Waverley - - - - 1 0 54 24
Woking - - - - 1 0 36 18
Totals 13 5 268 296 6 27 1,059 750
23Unit Delivery Track Record
800
Private sale
700
Shared Ownership
600
Rent
500
400
300
200
100
0
2014/15 2015/16 2016/17 2017/18 2018/19
24Shared Ownership Sales Track Record
Total Shared Ownership Contribution to PA Shared Ownership Proceeds & Profits per Sale
20 120 180,000 50%
18 160,000
100
16 40%
140,000
14
Proceeds / profits £m
80 120,000
Proceeds / profits £
Sales volumes
12 30%
100,000
Margin
10 60
80,000
8 20%
40 60,000
6
4 40,000
10%
20
2 20,000
0 0 0 0%
2014/15 2015/16 2016/17 2017/18 2018/19 2014/15 2015/16 2016/17 2017/18 2018/19
Total proceeds Total profits Number of sales (RHS) Proceeds per sale Profits per sale Avg sales margin (RHS)
25Finance, Treasury, Risk
Management
Stanley Works, Thornton HeathFinancial Results – Headlines
2018/19 2017/18
Turnover £160m £165m
of which Sales £11m (7%) £19m (12%)
Operating Surplus £62m £65m
Operating Margin 39% 40%
Social Housing Lettings Margin 33% 36%
Net Surplus £39m £33m
Free Cash £15m £20m
Housing Assets £1.642bn £1.637bn
Debt £709m £689m
27Sector Scorecard – Comparison
(based on 2018 results and RSH benchmark data)
EBITDA MRI Gearing
250% 60%
50%
200%
40%
150%
30%
100%
20%
50%
10%
0% 0%
28Sector Scorecard – Comparison
(based on 2018 results and RSH benchmark data)
Operating Margin – Overall* Operating Margin – SH Lettings
40% 45%
35% 40%
35%
30%
30%
25%
25%
20%
20%
15%
15%
10%
10%
5% 5%
0% 0%
29 *Defined by the regulatorFinancial Golden Rules (results per 2019 accounts)
Inherent financial strength / resilience
Stable treasury position
Financial planning increasing in sophistication
Investment decisions from position of choice
Significant asset cover capacity (c.£1bn)
Project to deliver next phase of growth funding
commencing in 2019
30Treasury Policy & Bank Covenants
Cash To cover 2 months Net Cash Requirement (3 months during Brexit). NCR = no sales
Liquidity To cover 18 months Net Liquidity Requirement. NLR = sales @ 50%
Aspirational maximum in 1 year 10%
Debt maturity Aspirational maximum in a 5 year period 40%
Minimum WAM 10 years
Derivatives Sufficient security / liquidity to cover 50bps adverse movement (current value: £11m)
Hedging 50% to 90% hedged at all times
Broad commonality achieved across all bank lenders
o Interest cover 110% (our golden rule: 150%)
Bank Covenants o Gearing 65% (our golden rule: 55%)
Significant headroom within financial projections
31Debt Maturity Profile
£’s
800,000 Weighted Average Maturity
RCF Term loans Bond 13.4 years
700,000
Weighted Average Cost of Capital
4.0%
600,000
Current Headroom
500,000 £182m / 2 years
400,000
300,000
200,000
100,000
0
32Security and Hedging Positions
Chargeable Assets - Security Value c.£2.6bn (Jul 19) Interest Rate Exposure (Jul 19)
Uncharged Floating
£0.7bn 24%
(estimated)
Charged Fixed
£1.9bn
76%
Valuation of Charged Stock by Region (£ms) Amount (£ms) Proportion
EUV-SH MV-T OMV Bond issue 225.0
Elmbridge 380 48 1,200 Debentures 36.4
Greenwich 27 75 175
Embedded swaps 121.6
Kingston-upon-Thames 21 59 100
Standalone IRS 160.0
Leicester 33 188 240
Fixed-rate 543.0 76%
Nottingham 13 33 50
Richmond-upon-Thames 10 213 420 Floating-rate 169.2 24%
All other areas 62 699 1,240
Total: 546 1,315 3,425
33Our Primary Corporate Risks
Fire Safety
Customer Satisfaction
Asset Management / Stock Condition
Cyber Security
Value for Money
Universal Credit
Sales
We stress test the above against our financial plan, plus:
Brexit
Operating environment (political + economic)
34Closing Summary
PA is a traditional general needs HA with a conservative Board
We have a steady growth plan which will not over-stretch us financially
Our treasury position is tightly controlled; we are not seeking to innovate with our treasury
instruments
Market sales comprise a very small part of our activities and is not a key growth area for PA
Shared ownership is a product which works well for us in the right locations
We have a strong focus on excellent customer service
We see ourselves as a low risk organisation and we are seeking long-term relationships
35Addendum: additional information in response to questions from investors
Development programme

The table on the following page provides a breakdown of our current development programme, including schemes
currently on site and schemes in the firm pipeline. It shows, for each local authority area where we plan to develop at
least 50 units, the tenure split between rented and shared ownership accommodation and the site split between Section
106 and land led.

37
Development programme
                      Rented                      Shared Ownership
              S106             Land led         S106           Land led
 Croydon              12                   24            7                222
 Greenwich           239                   85          115                 29
 Merton                -                   21            -                 31
 Southwark             -                   21            -                 46
 Wandsworth            6                    -          117                  -
 Elmbridge           100                  303           26                148
 Guildford           133                   14           53                 12
 Brent                 -                   42            -                 40
 Ealing                -                  105            -                 45
 Lewisham              -                   10            -                 46
 Sutton                -                   16            -                 55
 Runnymede             -                  106            -                 12
 Waverley             54                    -           24                  -
 Woking               36                    -           18                  -
 Totals              580                  747          360                686

38
Future new build rented accommodation
The table below summarises our business plan assumptions in respect of future new build rented accommodation, in
particular the split between social and affordable rent and the Social Housing Grant (‘SHG’) subsidy. It should be noted
that on an ongoing basis, we seek opportunities to maximise social rent new build volumes and this is contingent on the
availability of SHG. Therefore, over time it is likely that a proportion of the assumed affordable rent units at zero grant
shown below will be replaced with social rent units supported by additional SHG.
2019/20 2020/21 2021/22 2022/23 2023/24
Social rent units 4 42 17 0 0
Social rent SHG £2.7m £1.5m £0.2m £nil £nil
Affordable rent units 149 270 281 523 435
Affordable rent SHG £nil £nil £nil £nil £nil
Within the business plan, affordable rent levels are typically set at around 60 per cent of market rent (varying around this
average depending on locality).
39Property sales performance
The graph below sets out the average time taken in weeks to sell new build shared ownership
properties at our fully sold development schemes over the past four years. The schemes are
presented in chronological order so that the trend over time can be observed (blue line).
50
45
40
35
30
25
20
15
10
5
0
40Flood risk
The chart below represents a current assessment of the flood risk distribution of
our properties, prepared by our insurers Zurich Insurance Plc
1%
4%
4%
Normal
7%
Maginally increased
Medium
High
84%
Extreme
41Aluminium Composite Material Cladding PA has properties at four blocks with ACM cladding For all four blocks, PA is not the freeholder and holds only a leasehold interest in a proportion of the units, under Section 106 development agreements Two of these blocks are less than six storeys high and are therefore not classed as ‘high rise’ Austen House in Guildford is a six storey block with cladding to the top two storeys and the stairwell. PA has a leasehold interest in 62 units out of the 172 total units at the block Ensign House in Southwark is a nine storey block with cladding at all levels. PA has a leasehold interest in 40 units out of the 75 total units at the block Neither of the above blocks are charged as security against the 2015 bond issue PA liaises closely with the freeholders of these blocks to understand plans for rectification of the ACM cladding, and in the meantime we ensure that appropriate safety regimes are in operation 42
Customer Satisfaction

PA measures its customer satisfaction on an ongoing basis and across all aspects of our service. Headline results as at
August 2019 are summarised below.

Overall satisfaction                     81%
Moving in experience                    100%
Universal Credit service                  96%
MyPA digital app                          91%
New customer experience                   88%
Cyclical works                            87%
Planned maintenance                       87%
Tenancy sustainment service               84%
Repairs service                           79%

43
Business plan stress testing
PA performs a range of business plan stress test scenarios which are aligned with our corporate risk register. By way of
illustration, we have summarised below the input assumptions and the associated mitigating actions for two scenarios.
Housing market crash Disorderly Brexit
Sale prices reduced by 20% from 2019 to 2024 LIBOR gradually increases to 8% by 2022
Additional property sales costs of £1m pa Sale values gradually reduce to 30% below base by 2021
All properties take 24 months to sell Rent arrears gradually increases to 7.5% by 2021
Affordable rents reduce by 3% pa from 2020 to 2025 Bad debts gradually increase to 4% by 2021
Cost inflation gradually increases to 6.5% by 2021
Mitigating actions
Uncommitted development reduced by 75% from 2021 Mitigating actions
80% of affected properties converted to market rent Programme of asset disposals generating proceeds of
Management cost savings of £1.5m pa £5m pa from 2019
Land bank sold off at 60% of cost price Uncommitted development removed from 2021
High value asset disposals generating £12m proceeds Operating cost savings of £2m pa from 2020
in 2021 Capital maintenance costs reduced by £2m pa from 2020
For all scenarios, the modelled mitigating actions are sufficient to return business performance to relatively normal levels
with full loan covenant compliance. Further details on our stress testing regime can be provided on request.
44Further questions For further questions about the contents of this information pack, or for further information about any aspect of PA Housing’s operations, please contact Simon Hatchman (Executive Director – Finance) at email: simon.hatchman@pahousing.co.uk Office: 0116 257 6786 Mobile: 07720 087108 45
You can also read


