Jonas EBI - Enterprise Business Intelligence
←
→
Page content transcription
If your browser does not render page correctly, please read the page content below

Jonas EBI - Enterprise
           Business Intelligence

Page | 0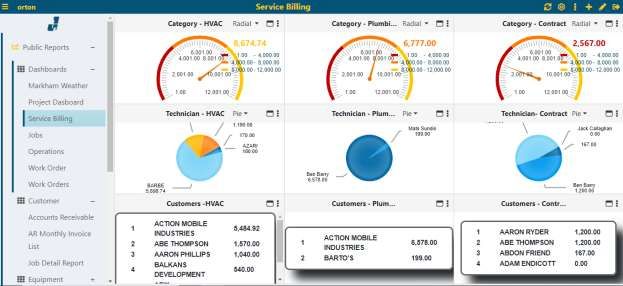
Jonas Enterprise Business Intelligence: Introduction

                                  Introduction
Key features of the Jonas Enterprise Business Intelligence module include the following:

   •   Create Reports/Dashboards based on SQL views that reside in DataMart

   •   Group and filter information upon creating/editing reports/dashboards or on the fly
       as desired

   •   Dashboard Components available

       o   Columnar Reports

              o   Tabular / Drilldown – Allows for up to three levels of drilldown information

              o   Matrix- Allows users to drill through to information from a single data cell

       o   Charts & Gauges – Create Graphical Representation of the data

       o   Top List

       o   Web Links

   •   Add and filter calculation columns as required

   •   Drill into Matrix, Charts, Gauges and Top List to see data

   •   Security

       o   Creation or display of reports/dashboards is by role and/or user

       o   Reports/Dashboards can be shared across users or only for a single user

       o   Menus can be altered to move reports/dashboards within folders or create new
           folders

   •   Allow export of reports/dashboards to Excel and/or PDF format based on component
       type

   •   The application can be run on

       o   A Windows desktop/laptop as well as Android and Apple devices

Page | 1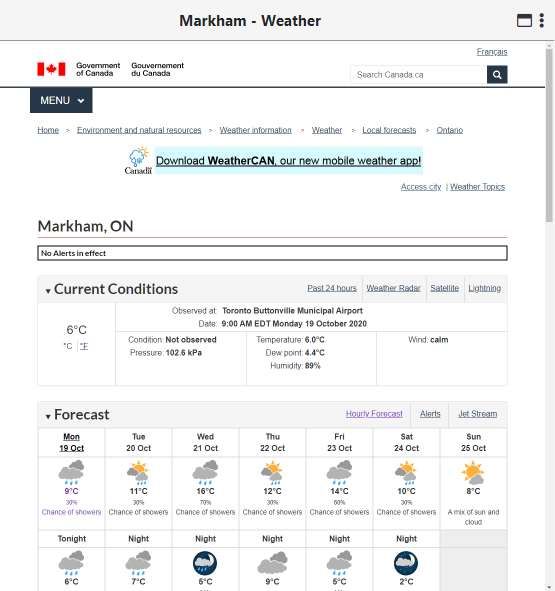
Enterprise Business Intelligence
Table of Contents
Introduction ............................................................................................... 1
Launching the Application ............................................................................. 4
Logging In / Logging Off ............................................................................... 6
Menu Options ............................................................................................. 7
  Custom Menu Setup – Reports Menu Editors ................................................. 9
  Security ................................................................................................ 11
  Assigning Access to Business Categories .................................................... 13
  Assigning Access to Reports ..................................................................... 14
  Data Sources and Defaults ....................................................................... 15
  Data Sources (Internal Only) .................................................................... 22
  DS Hierarchy Setup (Internal Only) ........................................................... 23
Interacting with Reports/Dashboards ............................................................ 24
  Navigating Report/Dashboard Panes .......................................................... 24
Creating / Editing a Report/Dashboard .......................................................... 26
  Configuration/Data Sources ...................................................................... 28
  Data Sources - Views Selection ................................................................. 31
  Data Sources - Views Options ................................................................... 32
  Report / Dashboard Placement.................................................................. 37
  Report/Dashboard - Properties.................................................................. 38
  Settings– Tabular/Details ......................................................................... 40
  Settings - Matrix .................................................................................... 45
  Settings: Graph/Gauge ............................................................................ 50
  Top List................................................................................................. 54
  Web Link ............................................................................................... 54
Navigating Reports/Dashboards ................................................................... 55
  Date Range ........................................................................................... 56
  Export Excel & PDF ................................................................................. 57
  Grouping, Sorting, Columns, Filtering ........................................................ 58

Page | 2
Rebuilding Cache .................................................................................... 59
Working with Components .......................................................................... 60
  Tabular/ Drilldown Reports ....................................................................... 60
  Matrix Reports ....................................................................................... 61
  Graphs.................................................................................................. 62
  Gauges / Top Lists .................................................................................. 63
  Web Links ............................................................................................. 64

Page | 3
Launching the Application
Launching EBI is accomplished in one of several ways:
• From the Windows Start menu:
• From the Windows Desktop Icon:
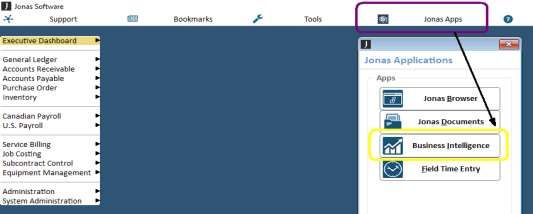
• Within Jonas Core via the Jonas Apps menu and Business Intelligence option button
when using the Jonas Classic or Windows Dropdown menu styles from Versions
12.7+:
• Through Jonas Apps Portal
Page | 4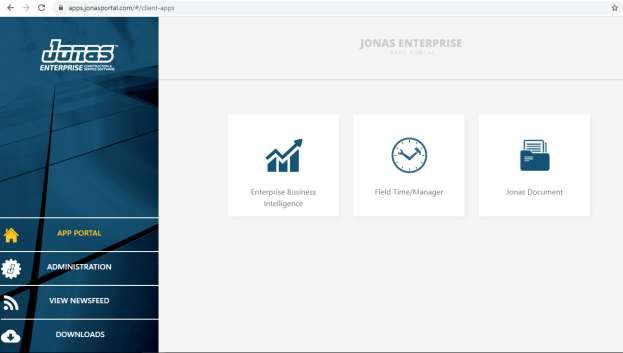
Page | 5
Logging In / Logging Off
Logging In

   •   User ID and Password are defined in Jonas

   •   Client ID will be supplied by your Jonas Installer/Consultant

Logging Off

Click the button     in the top-right corner to ‘Logoff’. The application will
then return to the Login screen.

Page | 6
Menu Options
The report menu on the left can be toggled off and on by clicking the horizontal     line
icon. The middle of the top pane will display the name of the report/dashboard currently in
use.

Clicking the ‘+’ to the right of each menu option will display the reports/dashboards to
choose from, as well as sub-folders that will drill down into other related reports.

Public Reports are accessible by all users, while My Reports are ones that are that are
private and available to only the current user.

Note:
Access to various reports and dashboards will depend on your security settings.

The Icons on the right side on the main screen have various effects on the report/dashboard
shown on the screen as well as administrative functions

                                          Note:
   In this section we will review administrative options. For reporting / dashboard
             options please refer to ‘Intercting with Reports/Dashboards’

Clicking on the     icon will display the menu for the Reports Menu Editor where users
can create, re-name, and remove folders from the Public / My Reports menus. Users can
also customize the display order of folders and reports.

Page | 7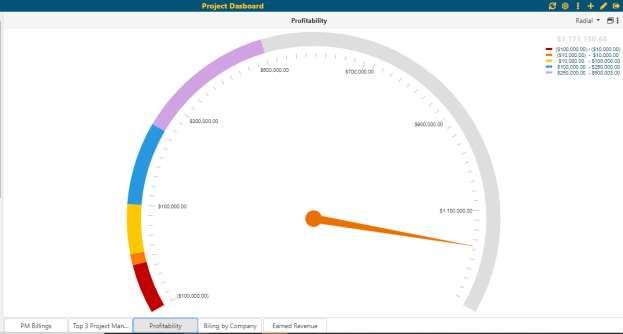
Note:
To edit the Public Reports folder, a user must have Administrator access set in their
profile.

Administrators will also see an Administration menu with EBI setup sub-menus as shown
below:

Page | 8
Custom Menu Setup – Reports Menu Editors
To access the Custom Menu Setup options, go to the top left corner of the screen and click

the settings icon     . Then click My Reports or Public Reports to open. The Menu editor
allows you to create, re-name, remove, and re-arrange folders. Reports that have not been
designated as Public will be listed under the folder names that you have saved them in.

Note:
Users with View access will be permitted to open the Public Reports Menu
Editor, but will not have the ability to make changes.

Expand/Collapse All

These buttons are used to collapse or expand all folders at once.

Up/Down

Page | 9
Click on (select) a folder, then use the Up and Down buttons to move selected reports or
folders up or down in the viewable list.

Other Options

You can also create a New Folder and/or Remove or Rename them at any time. Hitting
OK will accept your changes or you can press Cancel to exit without saving the change.

Note:
Folders containing reports cannot be removed until they are empty.

Page | 10
Security
Users with Administration access will see the Administration menu option.

As an administrator, you will be able to assign business categories, views, and reports that
you want users to have access.

Page | 11
Select (highlight) the user and then press the Edit button. A list of business categories are
shown which you can assign for access.

If you want to set a user as an administrator, turn on the ‘Administrator’ switch and ensure
the ‘Disabled’ switch is set to NO.

To disable a user from logging into EBI, set the Disable switch to ‘Yes’. To assign View Only
access to a user, set both switches to NO.

Note:
The Disabled switch should only be turned on (set to YES) when you want to
prevent the user from logging in to EBI. If both the Administrator and Disabled
switches are set to YES, then the user’s role will be set to ‘Disabled.’

Page | 12
Assigning Access to Business Categories
Select the checkboxes for the business categories that you want to give access to for this

user. Press the Arrow      icon next to each category to drill down to individual report
access.

Business Category View:

Drill-down View of Reports:

Page | 13
Assigning Access to Reports
After drilling-down to the Report view of a Business category, click the Report button
to list the reports and dashboards associated with it.

After clicking the Report button, the Reports assignment window will display. If a checkbox
is grey, this means the report includes other views that this user does not have access to.

After selecting (check-marking) the report, click OK to save and return to the previous
screen. If you do not want to save, click Close.

Note:
You will only need to do this for existing reports. For new reports in this business
category, the user will have access automatically.

Page | 14
Data Sources and Defaults
This screen will allow users with Administrator access to change defaults for
customizations, document attributes, calculations and schedule caching of Data Sources.

The Current Queues button will display a screen displaying the current schedule for
updating Data Sources.

Page | 15
Enter text in search box at top left to find all Data Sources with that text in the Name.

On each Data Source, there are four available options

   •   Customizations

   •   Document Attributes

   •   Calculations

   •   Cache Schedules

When users create a report with View access, the default setting in each of these options
will apply to the report. Created reports allow users (who have access) to edit and override
these settings in the report editor. Only Administrators have rights to change the default
settings for Data Source.

Page | 16
The Customizations icon allows for setting defaults for the Column Title, Type and Format.

Page | 17
The Document Attributes icon will set default matches between columns and Jonas
Document attributes, used to pull in documents into the bottom pane of a Report view. Any
reports created will allow users (that have access) to edit and override these settings in the
report editor.

Page | 18
The Calculations icon will allow for adding of calculations used as columns in reports. Any
report created will allow users (that have access) to edit and override these settings.

Page | 19
The Cache Scheduling icon allows for setting a schedule to have reports build into cache
at a pre-determined time. Using scheduling effectively will dramatically improve
performance within EBI. It is best to set schedules based on the likelihood of how these
views will be used in reports and when people will likely access them (hourly, daily, monthly
etc.). If scheduling is on, the user will have access to rebuild the reporting cache on the fly
and will get notice once complete.

The reports and users affected by scheduling this Data Source will be show on the right.
There are three recurrence patterns: Daily, Weekly, and Monthly.

Daily: the user may select Every Day or Weekday, and decide how often the caching
happens. When selecting the Specific option, choose the Start time and Until time, as well
as the interval time between each caching as shown above.

Weekly: allows the user to customize the days and times when caching will occur.

Page | 20
Monthly: users can specify which day of the month to build the cache either with a specific
day of the month, or an interval (i.e. the first Friday of every month). You can also select
the time of the day to start building the cache.

Page | 21
Data Sources (Internal Only)

For Jonas Internal Admins only (when logging in as GJSYSTEM).

This screen will allow Jonas administrators to change friendly names (alias). Administrators
can also change the Business Category that a data source is tied to.

Page | 22
DS Hierarchy Setup (Internal Only)
This screen is for advanced users that may have their own data sources (SQL Views) setup
and they want to create or change relationships for purposes of accessing drilldown reports.

All views are listed in the column ‘Data Source’. The ‘Parent’ column shows which view is
set as the current view’s parent. In ‘Parameters,’ user can choose the columns to build the
relation between two views.

Page | 23
Interacting with Reports/Dashboards

          Navigating Report/Dashboard Panes

Once a report/dashboard selected from the menu on the left, the report / dashboard will
display.

The screen will show up to nine sections consisting of component types Report (Tabular or
Matrix), Graph, Gauge, Top List or Web Link

The Icons on the right side on the main screen have various effects on the report/dashboard
shown on the screen

Clicking on the     icon will refresh the report and/or dashboard

Clicking on the icon    will display a drop-down list with various options to export, delete
reports or dashboards. You can also take a snapshot or rebuild the report cache.

Page | 24
• ‘Delete’ will delete the report and/or dashboard
• ‘Set as Default’ will set this report/dashboard to display when you log in to EBI and
also as the dashboard in the ‘Jonas Enterprise’ menu
• ‘Snapshot’ will take a screen shot of the screen with the report/dashboards
elements as you see the, .It will export it to a PDF.
• ‘Export All’ will export the reporting, graphical components to Excel and/or PDF
dependent on type and amount of data
• ‘Rebuild Cache’ will rebuild cache for all views that used in this report/dashboard
and will let you know this task is scheduled. Users will get a message once the
report/dashboard is updated and ready to view (Note: this option is only available for
views that have been scheduled by an Administrator)
Page | 25Creating / Editing a Report/Dashboard When users open a report/dashboard, clicking the or will display the Dashboard/ Report Edit screen to allow the user to create or edit the report/dashboard The initial screen when creating a report/dashboard will look as below This is the main screen where you create or edit a report/dashboard. There are a number of steps in creating or editing a report/dashboard. They are as follows • Configuration and Data Sources selection • Report/Dashboard Placement • Selected Report/Dashboard Properties Page | 26
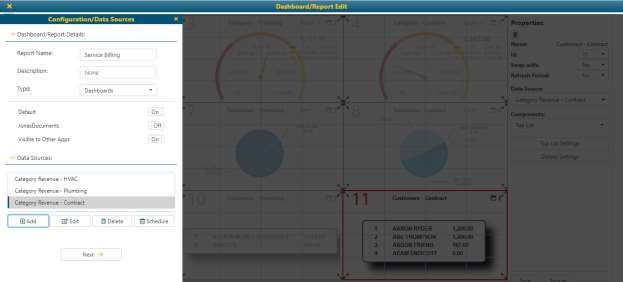
When editing a report/dashboard the initial screen will look as follows as clicking on left
hand pane for ‘Configuration/Data Sources’ will pop the ‘Configuration and Data
Sources’ window for editing.

Page | 27
Configuration/Data Sources

Options that need explanation are as follows:

•   Report Name allows up to 25 characters

•   The Type is the menu folder where you place this report under

•   If Default is selected, then this report will be the one launched when the user logs in to
    EBI or Jonas Enterprise menu

•   If Jonas Documents is selected, you will be able to view documents in
    report/dashboard

Page | 28
• If Visible to Other Apps is selected then this report/dashboard will available for
viewing in other Jonas Applications (built for future use)
• Data Sources (Options on Configuration)
▪ Add/Edit will bring up Data Sources screen to add a new Data Source or edit a
selected Data Source for this report/dashboard
▪ Delete will delete a selected Data Source for this report/dashboard
• The Scheduling icon allows for setting a schedule to have reports build into
cache at a pre-determined time. Using scheduling effectively will dramatically
improve performance within EBI. It is best to set schedules based on the
likelihood of how these views will be used in reports and when people will likely
access them (hourly, daily, monthly etc.). If scheduling is on, the user will have
access to rebuild the reporting cache on the fly and will get notice once complete
▪ The reports and users affected by scheduling this Data Source will be show on
the right. There are three recurrence patterns: Daily, Weekly, and Monthly.
▪ Daily: the user may select Every Day or Weekday, and decide how often the
caching happens. When selecting the Specific option, choose the Start time and
Until time, as well as the interval time between each caching as shown above.
▪ Weekly: allows the user to customize the days and times when caching will
occur.
Page | 29▪ Monthly: users can specify which day of the month to build the cache either with
a specific day of the month, or an interval (i.e. the first Friday of every month).
You can also select the time of the day to start building the cache.
Page | 30Data Sources - Views Selection
Options that need explanation are as follows:
• DS Name is the name of the Data Source that a user will define
• Copy From - This will be available if a user is Adding a Data Source and wants to copy
from an existing Data Source in this report/dashboard.
Note:
This us helpful in situations where I want to see multiple reports/dashboards
based on the same data but with a different filter or date range for eaxple
• Business Category – Use this to decide which types of data you are looking at
• First – One view must be selected here and is used as a Data Source in this
report/dashboard. Choosing a Second and Third is only relevant when building a
Tabular Drill Down Report
Page | 31Data Sources - Views Options The Customization option allows you to control the column Title to display in the current report, as well as the Type of data. The Format will allow choices for date fields and numbers. Page | 32
The Document Attributes tab will set attributes that used to pull in documents of a
current report into the bottom pane in grid view when selected Jonas Documents icon

The Filters option will allow you to set up default filters on the fields. There are two types
of filters in EBI. One is Report Filter, in which a user selects the column and condition to
create a filter. The other is Source Filter, where users type in the condition in the SQL
query. Verify can check the syntax and Clear removes current filters in the Source Filter.

In Grid view, the report viewer can set or change filters that are set up in Report Filter. The
Source filter is invisible in grid view and only users who have edit permissions can change it.

Page | 33
Date Range – You can define a default date range for this report for the First Data Source

Use this to filter report information by a certain field, Range (which you can select from the
drop-down menu such as Current Week, Month or Year-To-Date etc), or a Custom Range
which can be set using the From: and To: fields Press OK to apply the filter and re-display
the report with the filter applied.

The Calculations option will allow you to create new fields that are calculations.

Page | 34
The left section of the screen is the list of all Calculation column names. Clicking one of
them will highlight the selection and the corresponding formula will be displayed in the right
section of the screen.

   •   Click the Add(+) button to add a new calculation

   •   The Edit (Pencil) Button will let users edit a selected row

   •   Remove(X) will remove a selected row

Note:
EBI does not save any changes until you click ‘OK’

Select the column and click Edit (or click Add to create a new column) then the Edit
Calculated Column dialog will open.

Page | 35
• Column Title and Formula are required
• Insert Field allows users to select fields that are available within this data source
• Insert Operator will allow for selection of useful functions.
• Users can manually type in a formula if they know the field names and functions.
SQL functions and operators are allowed in a formula, which is dependent on your
SQL server version.
• The Verify button checks for syntax (i.e. spelling of fields, the use of operators)
• Once created, the field will be available to select as a column for display in the report
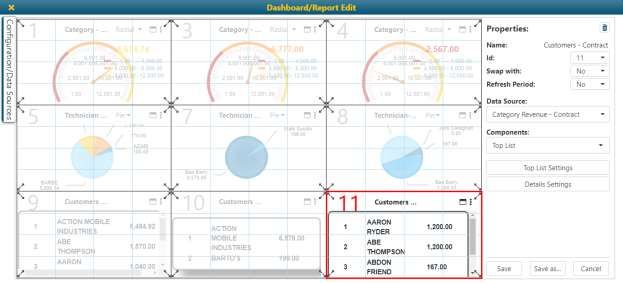
Page | 36Report / Dashboard Placement When adding a New report/dashboard the screen will default to a Tabular component sized for the entire screen. Note: Components consist of Tabular, Matrix and List Reports as wel as Graphs, Thermometers and Radials. A new component Web Link is now included Clicking and dragging the arrows in the corners of that component will let user define the size of the component within the dashboard Page | 37
Report/Dashboard - Properties
On the right hand pane, a user can edit the Properties of a selected component in the
dashboard.

On the right hand pane, a user can edit the Properties of a selected component in the
dashboard. The available options are as follows

•   Swap with – Choosing another component on the dashboard would allow the user to
    swap components with the selected component or Id to move each component to
    another place on the dashboard

•   Refresh Period – User can set a time to refresh=h this component within the
    dashboard

•   Data Source – Select the Data Source that will be used for this component

Page | 38
• Template – This allows the ability to copy a component from one dashboard to another
• Add a template that can be copied into another dashboard
• Select a spot on the dashboard and click Apply to copy in Component
(thus will automatically copy Configuration as well as Settings)
• Remove will delete template from list to reduce clutter of components
available to copy
• Components – Select the report (tabular or matrix), graphical, radial or web link
component. Each of these components are described in detail in next section
• Settings – The options available here will depend on the components selected
• Save – This will save the report/dashboard
• Save as – This will allow the user to copy this report/dashboard to a different name
Page | 39Settings– Tabular/Details When selecting a tabular component then the settings option available (dependent on Data Source selected) may be Main Level Settings, Second Level Settings and Third level Settings. We will review all the properties that are available in Main Level Settings When selecting a Matrix, Graphical, Radial or List component the same options described in this section are available for Detailed Settings Title – The description entered here will be the tile of the component displayed in the report/dashboard Page | 40
Tabular/Details Option: Column
The Columns option is where you select the fields that are visible and change the order of
the fields in the report. When you create a new report, you need to set the columns you
want to view in it. If no columns are selected, the new report will be blank.

Page | 41
Tabular/Details Option: Grouping
The Grouping option allows for the selection of fields to group by and setting of the default
order of the grouping.

When a Group By field is applied, field labels will display on top the report.

Page | 42
Tabular/Details Option: Sorting
The Sorting option allows for the selection of fields to sort in ascending or descending order
by default.

When a Sort field is applied, the sort direction and order will display on top the report.

Page | 43
Tabular/Details Option: Summarize

The Summarize By option will allow you to set up various total calculations dependent on
field type.

Count is available in all types of fields. Min and Max can be used to numeric and date
fields. Avg and Total are only available for numeric fields.

Page | 44
Settings - Matrix
Matrix summarizes detailed data, such as transactions into grouping along the rows and
columns. Clicking on a value in the matrix will display all of the transactions and data that
make up the value.

When selecting a Matrix, this will allow you to select the Static Fields (which are row
labels), Pivot Field (which is a column label) and the Value Field (the value summarized
in each cell.)

   •   Title - Description will be used for title of this component in the report/dashboard

   •   If you choose a date column as the Pivot Field, then you can choose Auto / Year /
       Quarter / Month in Granularity By.

   •   The option Summarize by will add an extra column at the end of report, and
       calculate the Average or Sum of each column.

   •   If Show matrix as Percentage is selected, then the totals will be shown as
       percentages of a line total

Page | 45
Matrix – Granularity by Aging When choosing Aging in Granularity By you will get the following options Aging will allow the user to set Boundaries that will act as columns for the report Page | 46
Matrix - Column Properties
The Columns Properties tab is where you select the fields that are visible and change the
order of the fields in the report. The columns are dynamic based on the data source filters.

The user now has the ability to add filters to the columns

Page | 47
Matrix – Calculations
The Calculations tab is where you can create calculations specific to this matrix.

   •   Click the Add(+) button to add a new calculation

   •   The Edit (Pencil) Button will let users edit a selected row

   •   Remove(X) will remove a selected row

Note:
EBI does not save any changes until you click ‘OK’

Select the column and click Edit (or click Add to create a new column) then the Edit
Calculated Column dialog will open.

Page | 48
•   Column Title and Formula are required

   •   Insert Field allows users to select fields that are available within this data source

   •   Insert Operator will allow for selection of useful functions.

   •   Users can manually type in a formula if they know the field names and functions.
       SQL functions and operators are allowed in a formula, which is dependent on your
       SQL server version.

   •   The Verify button checks for syntax (i.e. spelling of fields, the use of operators)

   •   Once created, the field will be available to select as a column for display in the report

Page | 49
Settings: Graph/Gauge
Graph type: Chart
The Graph option will allow you to set up Graph Type, Graph Title, Series Field (which is
used for multiple series in a chart), and Pivot Field (which is the field that the value
chosen is grouped by) as well as the Value Field (which is the summarized value for each
group). Option Include Graph decides whether the graph shows in the report.
• Choose the chart type in the dropdown list on the right
• If you set a date column as a Pivot Field, then you can choose Auto / Year / Quarter /
Month (Aging for Pie/Donut) in Granularity By
• The option Summarize by allows summarization to be Average rather than just a Sum
• The Top will allow user to show top 3,5,10,20 elements in either ascending or
descending order
• If Show Chart as Percentage is selected, then the label will be shown as percentages
of total
• If Show Total in Title is selected, then the total will show in the title
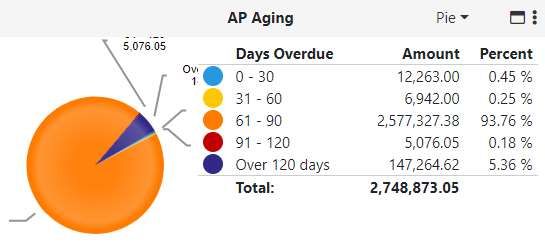
Page | 50Graph type: Pie / Donut
• If you set a date column as a Pivot Field, then you can choose Auto / Year / Quarter
/ Month / Aging in Granularity By
• Aging will allow the user to set Boundaries, Inverse Colors and will give them
ability to setup a Legend shown to the right of the chart. The available options are
as follows
o None – Only show chart
o Simple – Show chart and descriptions
o Include Amount– Show chart, description and amount
o Include Percentage – Show chart, description and percentage
o Full Detail – Show chart, description, amount and percentage
Page | 51• The resulting chart will look similar to this for Full Detail Page | 52
Graph type: Gauge
When users choose Gauge, there are two options of graph: Linear or Radial

Users need to enter the boundary values in gauge and will need to enter at least two values
to build the graph successfully. Input the value in the Input box, and click Add to save the
value. Select a value from the list and click Remove can delete it. The boundary values are
dependent on your report and field value.

   •   Option Inverse Colors can switch the gauge range color

   •   Option Vertical will allow users to have the linear gauge display vertically.

Page | 53
Top List
When users choose Top List then will get a list of elements based on criteria selected

   •   If you set a date column as a Pivot Field, then you can choose Auto / Year / Quarter
       / Month in Granularity By

   •   User can choose Top 3, 5,10, 20 or All in either ascending or descending order

                                     Web Link
When users choose Web Link then user will have an option to put in a title, web link and a
scale (to size the web page)

Note:
EBI will not support all web pages currently.

Page | 54
Navigating Reports/Dashboards After opening a report/dashboard, the following option buttons become available on the right hand corner of each component The icon on the left will allow the user to Maximize the component to fill the entire and the other components would show as tabs that can be selected to view Page | 55
Date Range
Date Range This option helps to restrict the data seen in the component based on the
range of any date that is available in the data source. Clicking the button will open a dialog,
which allows users to choose the date column and range.

This feature is the same as the Data Sources > Date Range, except that the change here
is not saved after a user clicks OK. It will only filter the component while you are currently
viewing it. To save a change in Date Range, please click Apply.

Page | 56
Export Excel & PDF
Based on the component the user may see Export to Excel and Export to PDF options. If
the component is a graph, list or a radial then only the Export to PDF option is available.

If using a tabular or matrix report then user will have an option to Export to Excel. If the
tabular or matrix report includes more than 1000 rows, the report can only be saved as an
Excel file. When drilling into a graph, radial, list or matrix the user will also have the ability
to Export to Excel or Export to PDF

Note:
    o   For tabular drilldown reports, only top level rows can be exported.

Page | 57
Grouping, Sorting, Columns, Filtering Grouping – Grabbing a column and dragging it to the top will group by that column Columns – Columns can be dragged from one position to another Sorting – Clicking on the column header with sort in ascending or descending order. You may click on several columns to perform multiple sorting’s. Filtering – Click on the filter icon to filter data on the fly. If the user chooses Apply from option list then these changes will be saved Page | 58
Rebuilding Cache

Choosing the Rebuild Cache option will rebuild the data source view(s) and redisplay the
component based on the updated data.

Below this, if this data source is on a scheduled rebuild or a user as asked on the fly to
rebuild, then the last rebuild date/time will be displayed

Page | 59
Working with Components
Based on setup, there are three different types of reports: Tabular, Drilldown (with
multiple data sources) and Matrix (with drilldown into details based on the value clicked).

                         Tabular/ Drilldown Reports
Drilldown reports offer multiple columns with the availability to drill down into up to three
levels of detail

For each level of the report, users will have the same setting options as a tabular report.

Page | 60
Matrix Reports These reports offer multiple columns with the availability to drill through into a value to drill into the details that add to that value. The static columns will freeze allowing the user to scroll to the right to see the details while still seeing the static columns on the left Clicking on a value will launch another window with columns from setup. Page | 61
Graphs
Offer multiple options with the availability to drill through into a section of the graph

Page | 62
Gauges / Top Lists
Offer speedometer, thermometer as well as a list with the availability to drill through the
detail (not by section as in a graph)

Page | 63
Web Links
Will display a web link that will auto refresh when opened. Allows user to interact with the
element on the web page.

Page | 64
You can also read