JRC TECHNICAL REPORTS - Mobility and Economic Impact of COVID-19 Restrictions in Italy using Mobile Network Operator Data
←
→
Page content transcription
If your browser does not render page correctly, please read the page content below

JRC TECHNICAL REPORTS

Mobility and Economic Impact
of COVID-19 Restrictions in Italy
using Mobile Network Operator Data

                    A focus on the period
                    November 2020 - Febru-
First Main Title Line First Line
                    ary 2021
                    Vespe M., Minora U., Iacus S.M., Spyratos
Second Main Title Line Second Line
                    S., Sermi F., Fontana M., Ciuffo B., Chris-
                    tidis P.

Third Main Title Line Third Line
                    2021
                        First subtitle line first line
                        Second subtitle line second
                        Third subtitle line third line

                        Forename(s) Surname(s)

                        20xx

                                                              Report EUR xxxxx EN

                                                            EUR 30630 EN
This publication is a Technical report by the Joint Research Centre (JRC), the European Commission's science
and knowledge service. It aims to provide evidence-based scientific support to the European policymaking
process. The scientific output expressed does not imply a policy position of the European Commission. Neither
the European Commission nor any person acting on behalf of the Commission is responsible for the use that
might be made of this publication.

Contact Information
Name: Michele Vespe
Address: Joint Research Centre, Via Enrico Fermi 2749, TP 26B, 21027 Ispra (VA), Italy
E-mail: michele.vespe@ec.europa.eu
Tel.: +39 0332 789154

EU Science Hub
https://ec.europa.eu/jrc

JRC124130

EUR 30630 EN

  PDF       ISBN 978-92-76-32080-7        ISSN 1831-9424        doi:10.2760/241286

Luxembourg: Publications Office of the European Union, 2021

© European Union, 2021

The reuse policy of the European Commission is implemented by Commission Decision 2011/833/EU of 12
December 2011 on the reuse of Commission documents (OJ L 330, 14.12.2011, p. 39). Reuse is authorised,
provided the source of the document is acknowledged and its original meaning or message is not distorted. The
European Commission shall not be liable for any consequence stemming from the reuse. For any use or
reproduction of photos or other material that is not owned by the EU, permission must be sought directly from
the copyright holders.

All content © European Union, 2021

How to cite this report: Vespe M., Minora U., Iacus S.M., Spyratos S., Sermi F., Fontana M., Ciuffo B.,
Christidis P., Mobility and Economic Impact of COVID-19 Restrictions in Italy using Mobile Network Operator
Data, EUR 30630 EN, Publications Office of the European Union, Luxembourg, 2021, ISBN 978-92-76-32080-7,
doi:10.2760/241286, JRC124130.

Contents
Acknowledgements .............................................................................................          1
Abstract ............................................................................................................   2
1 Introduction ..................................................................................................       3
2 Data .............................................................................................................    4
  2.1 Mobility data .............................................................................................       4
  2.2 Additional Data .........................................................................................         5
3 Mobility containment measures in Italy from 6 November 2020 to 31 January 2021:
  the "three-tier" system ...................................................................................           5
4 Impact of restrictions on mobility .....................................................................              6
  4.1 Impact of regional curfew measures from 22 October to 5 November 2020 .......                                     6
  4.2 Impact of national restrictions from 6 November 2020 to 31 January 2021........                                   9
     4.2.1 Regional level ......................................................................................        9
     4.2.2 Province level ...................................................................................... 18
     4.2.3 Local level ........................................................................................... 19
  4.3 Mobility comparison between January 2020 and January 2021 ......................... 20
5 Economic impact analysis ................................................................................ 22
  5.1 Regional impact on GDP ............................................................................. 24
6 Conclusions ................................................................................................... 25
References ........................................................................................................ 26
Annexes ............................................................................................................ 28

                                                            i
Acknowledgements

The authors acknowledge the support of European MNOs (among which 3 Group - part
of CK Hutchison, A1 Telekom Austria Group, Altice Portugal, Deutsche Telekom, Orange,
Proximus, TIM Telecom Italia, Telefonica, Telenor, Tele2, Telia Company and Vodafone) in
providing access to aggregate and anonymised data, an invaluable contribution to the ini-
tiative. The authors would also like to acknowledge the GSMA1 , colleagues from Eurostat2
and ECDC3 for their input in drafting the data request. Finally, the authors would also like
to acknowledge the support from JRC colleagues, and in particular the E3 Unit, for setting
up a secure environment to host and process of the data provided by MNOs, as well as the
E6 Unit (the “Dynamic Data Hub” team) for their valuable support in setting up the data lake.

Authors
Michele Vespe, Umberto Minora, Stefano Maria Iacus, Spyridon Spyratos, Francesco Sermi,
Matteo Fontana, Biagio Ciuffo, Panayotis Christidis.

  1 GSMA is the GSM Association of Mobile Network Operators.
  2 Eurostatis the Statistical Office of the European Union.
  3 ECDC: European Centre for Disease Prevention and Control. An agency of the European Union.

                                                    1
Abstract

This work presents the analysis of the impact of restrictions on mobility in Italy, with a focus
on the period from 6 November 2020 to 31 January 2021, when a three-tier system based
on different levels of risk was adopted and applied at regional level to contrast the second
wave of COVID-19. The impact is first evaluated on mobility using Mobile Network Operator
anonymised and aggregate data shared in the framework of a Business-to-Government
initiative with the European Commission. Mobility data, alongside additional information
about electricity consuption, are then used to assess the impacts on an economic level of
the three-tier system in different areas of the country.

Highlights
  — The varying levels of anti-coronavirus restrictions in different regions adopted in Italy
    has proved effective in systematically reducing mobility;
  — The three-tier system of red, orange and yellow zones had a generalised impact on
    mobility at local, provincial and regional levels depending on the restrictions;

  — Transitions to high-risk red zones resulted in a variation of total movements of -28%
    (-26.2% outward movements) and -36.9% (-40.5% outward movements) when down-
    grading from orange and yellow zones respectively;
  — On average, at regional level, mobility in January 2021 has dropped by 29.9% with
    substantial geographic variation if compared to the one measured in January 2020,
    before any mobility restriction was applied in Italy;
  — There’s a significant geographic heterogeneity in the variation of mobility reduction,
    which is correlated to the pandemic incidence, suggesting an impact of the restrictions
    on mobility proportional to the epidemiological situation;

  — Within the same level of restriction, after an initial period of transition, a systematic
    slight increase of mobility can be observed over time;
  — An impact of the three-tier system on economic activity has been measured. The eco-
    nomic impact shows coherence with the direction of strengthening/weakening of the
    restrictions (e.g. a daily average variation of -0.33% for a yellow to red transition, vs
    +0.24% for a red to orange), and it correlates with the degree of such strengthen-
    ing/weakening (e.g. a daily average variation -0.33% for yellow to red versus -0.15%
    for yellow to orange).

                                               2
1    Introduction
Policy measures aimed at reducing the mobility of the general public had shown to be
choice of governments to tackle the COVID-19 pandemic. They are proven to be generally
effective (Zhou et al., 2020, Aleta and Moreno, 2020, Espinoza et al., 2020), and their ease
of implementation renders them a very important measure for epidemic control. One of the
most refined systems of mobility reduction in place is the Italian one: a ministerial decree
was signed in Italy on 3 November 2020 containing stringent measures to slow COVID-
19 infections4 . The ministerial decree identified three areas at regional level (NUTS25 ),
corresponding to risk scenarios (red, orange and yellow) for which varying measures were
envisaged. Regions are attributed different colours and restrictions depending on a number
of epidemiological factors, and according to the level of pressure on hospitals and intensive
care units. The classification is based on ordinances issued by the Italian Ministry of Health6 .
    Without assessing the epidemiological benefits of these measures, the effects of these
restrictions can be evaluated on mobility (see e.g. (Pepe et al., 2020)) and on the econ-
omy (Oliver et al., 2020). In this work, the assessment of such impacts is approached
through the analysis of mobility insights extracted from aggregate and anonymised mobile
positioning data collected in the framework of a Business-to-Government initiative between
European Mobile Network Operators (MNOs) and the European Commission (see previous
results (Santamaria et al., 2020), (Iacus et al., 2020a), (Iacus et al., 2021a), (Iacus et al.,
2020b), (Iacus et al., 2021b) and (Christidis et al., 2021)). Differently from other mobility
indicators publicly available such as the ones derived by social media, the data analysed in
this work contain indications also on different components with respect to the geographic
area under analysis, notably on internal, outward and inward movements. Moreover, de-
pending on the provider, MNO data are characterised by higher frequency (up to hourly)
and granularity (at municipality or district level), allowing a finer scale analysis with respect
to openly available mobility indicators. These features make the data particularly suitable
for the analysis of the impact of mobility restriction measures.
    In the policy life-cycle, performing this type of analysis is extremely important in order
to monitor the effectiveness of the measures introduced and perform adjustments in case
they did not achieve the expected impacts. This ultimately helps understand what policies
are most effective (Buckee et al., 2020) . For mobility restrictions to be effective in limiting
and slowing down the diffusion of a virus, it is indeed essential that they are able to limit
people movements at least beyond a certain level. Without quantitative evidence that this
is achieved it is impossible to ensure the usefulness of the measure. In the end, mobility
restrictions applied to citizens have several exemptions introduced to allow a sufficient
level of service for the society and the fulfillment of the basic needs of the same citizens.
These exemptions require time to citizens to be fully understood. This may induce a delay
between the measure introduction and the achievement of its objectives and this delay
poses challenges to the intention to limit the diffusion of the virus. Monitoring this delay
can provide timely indications if additional measures need to be applied.
    Another reason for implementing monitoring actions is to understand whether any mea-
sure applied may induce rebound effects that could jeopardise the effectiveness of the
measure itself. As an example, imposing an earlier closure of commercial activities may
induce an increase of mobility and the overcrowding of shops and other commercial areas
before the new closure time, which in turn could even increase the diffusion of the virus.
    Furthermore, another phenomenon that may occur and that monitoring mobility may
help to keep under control is people relaxation to the measures. As already mentioned,
people may need time to understand if and how to use the exemptions to mobility re-
strictions to fulfill their needs. If on the one hand this may delay the effectiveness of the
measure, on the other hand it may also have the opposite effect. People may decide to
initially restrict their mobility to beyond what is needed while relaxing it as soon as a better
understanding of the exemptions is achieved (or as soon as it is understood that no suffi-
  4 The Annex presents a list of legislative provisions that the Italian Government adopted between November

2020 and January 2021 to contain the spreading of COVID-19 pandemic and to manage the epidemiological
emergency.
  5 NUTS: Nomenclature of Territorial Units for Statistics, Regulation (EC) 1059/2003 of the European Parliament

and of the Council of 26 May 2003 on the establishment of a common classification of territorial units for statistics
(NUTS).
  6 http://www.salute.gov.it/portale/nuovocoronavirus/dettaglioContenutiNuovoCoronavirus.jsp?id=5367&area=

nuovoCoronavirus&menu=vuoto

                                                         3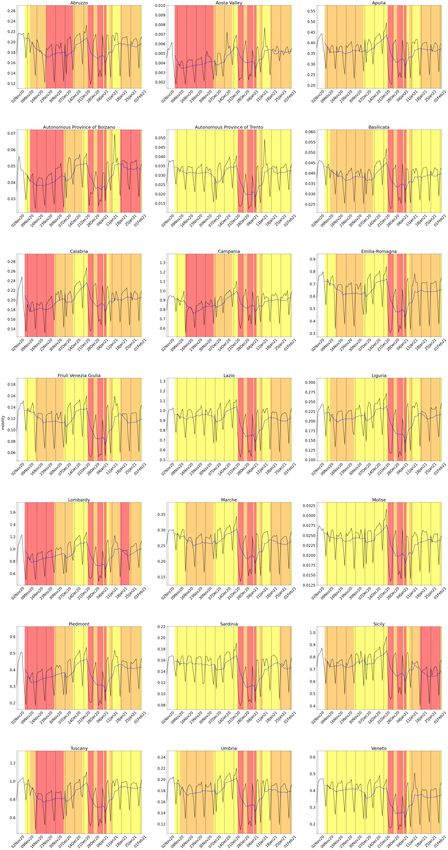
cient enforcement mechanisms are in place). Therefore the initial successful application of
the measure may be compromised by the subsequent relaxation period. Objective of the
present report is to show simple ways in which the data collected in the aforementioned
Business-to-Government initiative may provide extremely useful insights in the mobility
dynamics induced by the various policy measures applied. The case study used in the anal-
ysis is Italy, with specific reference to one of the regions where the virus outbreak has had
the strongest effects, the Lombardy Region.
   The paper is structured as follows. Section 2 introduces the mobility data used to derive
mobility insights. The measures adopted in Italy in the period 6 November 2020 - 31
January 2021 are described in Section 3. The impact of the relevant restrictions at regional
(NUTS2), provincial (NUTS3) and city level mobility are analysed in Sec 4. The impact of the
restrictions on the economy is then estimated using energy consumption data and proxies
on mobility as discussed in Section 5. Finally, concluding remarks are given in Section 6.

2     Data
In this work, insights on mobility are extracted from Mobile Network Operator anonymised
and aggregate data; epidemiological and economy and energy consumption data are also
used.

2.1      Mobility data
Feeding epidemiological meta-population models, understanding the impact of confinement
measures on mobility, as well as the role of mobility during the first phases of the epidemic
were some of the uses identified in early April 2020 when the European Commission asked
European Mobile Network Operators (MNOs) to share aggregate and anonymised mobile
positioning data. Initiated by means of an exchange of letters, the terms of cooperation
between MNOs and the European Commission are outlined by a Letter of Intent7 , which
specifies that insights into mobility patterns of population groups extracted in the framework
of this initiative are meant to serve the following purposes in the fight against COVID-19:
    — “understand the spatial dynamics of the epidemics thanks to historical matrices of
      mobility national and international flows;

    — quantify the impact of social distancing measures (travel limitations, non-essential
      activities closures, total lock-down,etc.) on mobility;
    — feed SIR epidemiological models, contributing to the evaluation of the effects of social
      distancing measures on the reduction of the rate of virus spread in terms of reproduc-
      tion number (expected number of secondary cases generated by one case);
    — feed models to estimate the economic costs of the different interventions, as well as
      the impact of control extended measures on intra-EU cross border flows and traffic
      jams due to the epidemic; and
    — cover all Member States in order to acquire insights relevant to Covid-19 to the entirety
      of the EU.”
   Data from European MNOs gradually began to be shared pro-bono with the European
Commission covering 22 EU Member States plus Norway, on a daily basis, with an average
latency of a few days, and in most cases covering historical data from January 2020 as in
the case of Italy. Differently from mobility data derived e.g. from social media, MNO data
can be processed to provide insights into human mobility at a level of granularity, timeli-
ness, frequency of update, representativity (coverage of large fraction of the population)
and transparency that make this data set uniquely positioned to continuously improve the
response to an evolving emergency situation.
   In compliance with the ‘Guidelines on the use of location data and contact tracing tools
in the context of the COVID-19 outbreak’ by the European Data Protection Board (EDPB,
2020), MNO data shared in the framework of this initiative provide information of collective
behaviours, and not on movements of individuals. Nonetheless, the data provide useful
    7 European   Commission and GSMA partners on Data4Covid - https://www.gsma.com/gsmaeurope/resources/d4c/

                                                       4
insights into human mobility patterns. The data is in the form of Origin-Destination Matrix
(ODM) and describes the number of ‘movements’ that have been recorded from the origin
geographical reference area to the destination one over a specific time period. In general,
an ODM is structured as a table reporting i) reference period (timestamp), ii) area of origin,
iii) area of destination, iv) count of movements. Data quality aspects are deeply linked
to privacy, data security and commercial confidentiality challenges as explained in (Vespe
et al., 2021). Mobility Indicators are then produced by further space-temporal aggregating
and normalising the ODMs provided by MNOs in order to ensure comparability across coun-
tries and operators. The indicators provide a daily time series of mobility according to the
direction of the movements as internal (when it takes place within the same geographical
area), inward (to a geographical areas), outward (from a geographical area), and total.
More information about the Mobility Indicators and their applications can be found in (San-
tamaria et al., 2020). The ‘Staying safe from COVID-19 during winter’ strategy adopted
by the European Commission in December 2020 mentions: “Insights into mobility patterns
and role in both the disease spread and containment should ideally feed into such targeted
measures. The Commission has used anonymised and aggregated mobile network oper-
ators’ data to derive mobility insights and build tools to inform better targeted measures,
in a Mobility Visualisation Platform, available to the Member States. Mobility insights are
also useful in monitoring the effectiveness of measures once imposed.” (COM(2020), 786,
2020). The products are currently expanded to feed early warning mechanisms to detect
anomalies in usual mobility patterns such as gatherings (De Groeve et al., 2020) and (Iacus
et al., 2021b).

2.2      Additional Data
The present work makes also use of epidemiological data on regional number of cumulative
COVID-19 cases from the Italian Department of Civil Protection normalised to the popula-
tion provided by the Italian National Institute of Statistics (ISTAT) as described in Section
4.3. The impact on the economy is estimated using World Bank data for national GDP8 ,
Terna Rete Italia for monthly energy demand9 and Eurostat for NUTS2-level GDP data10 ,
as described in Section 5.

3     Mobility containment measures in Italy from 6 November 2020 to
      31 January 2021: the "three-tier" system
A ministerial decree signed on 3 November 2020 in Italy contained stringent measures to
counter the spread of COVID-1911 . The decree identifies three main areas, corresponding
to three risk scenarios (see Figure 19 in the Annex), for which different measures are en-
visaged: most restrictive (red), slight restrictive (orange) and remaining regions (yellow).
In addition, the measures included a night curfew from 22:00 to 5:00, the closure of swim-
ming pools, gyms, cinemas, theatres and museums, whereas shopping centres were closed
throughout the country at weekends. Transports were also limited to 50% capacity.
   Entering, leaving, or moving within towns or cities was prohibited within red zones.
Movements were authorised for reasons of necessity, such as work, taking children to
school (distance learning applies to the final two years of middle school and high school),
or health. Coffee places, restaurants and most shops were closed, whereas supermarkets,
and pharmacies were allowed to remain open.
   Coffee places and restaurants were closed also in orange zones, whereas shops were
open. In addition, distance learning applies to high-schools and movements were allowed
within towns or cities, but not between them. It was therefore not allowed any movement
across regions.
   In yellow zones, restaurants and bars were open until 18:00, and shops were open.
Shopping centres were closed during weekends. Movements were allowed within the region.
Movements from one yellow region to another were allowed until 1 February 2021, when
    8 https://data.worldbank.org/indicator/NY.GDP.MKTP.CD?locations=IT
    9 https://www.terna.it/it/sistema-elettrico/pubblicazioni/rapporto-mesile
 10 https://ec.europa.eu/eurostat/web/products-datasets/-/tgs00004
 11 The Annex presents a list of legislative provisions that the Italian Government adopted between November

2020and January 2021 to contain the spreading of COVID-19 pandemic and to manage the epidemiological emer-
gency.

                                                       5
these movements were then forbidden. Figure 1 shows the time evolution of the restrictions
for all regions in Italy.
   During the Christmas period and close to the new year, from 24 December 2020 to 10
January 2021, a time-series of transitions was planned uniformly throughout Italy, and the
same restrictions applied in all regions.

Figure 1: Time series of mobility measures taken in all Italian Regions by level of restriction: grey
(before the ministerial decree on 6 November), red (high), orange (medium) and yellow (low).

   On 1 February 2021 Italy eased the restrictions in most regions. With the exception
of only five orange regions, all the others turned yellow. However, it is worth noting that
from the same day onward, unlike the measures taken previously, the movements between
yellow regions were prohibited.

4     Impact of restrictions on mobility
Mobile positioning data are used to quantify the impact on human mobility of regional and
national containment measures adopted to reduce the spreading of the virus. Subsection
4.1 investigates the effect of curfews measures alone, adopted by regional authorities ahead
of the ministerial decree of 6 November 2020. Finally, Subsection 4.2 shows the analysis
of mobility variations in correspondence of the more structured set of restrictions on mo-
bility, which also include curfew measures, of the national three-tier system at different
geographical scales, from the aggregate regional to the city levels.

4.1    Impact of regional curfew measures from 22 October to 5 November
       2020
Before the ministerial decree of 6 November 2020 (described in Section 3), regional au-
thorities together with the Italian Ministry of Health imposed a night curfew in Lombardy12 .
The curfew, valid from 23:00 to 5:00 as of Thursday 22 October 2020, was accompanied
by a set of additional measures calling large shopping centres to be closed at weekends.
The impact of the curfew on human mobility can be clearly observed for Milan province in
Figure 2, which shows a marked drop of overall daily movements (outward + inward move-
ments within the time window 23:00-24:00) ranging from about one third on weekdays to
 12 Decree of the Ministry of Health together with Lombardy Region of 21 October 2020: Further prevention and

management measures for the COVID-19 epidemiological emergency. ORDINANZA AI SENSI DELL’ART. 32 DELLA
LEGGE 23 DICEMBRE 1978, N. 833 IN MATERIA DI IGIENE E SANITÀ PUBBLICA E DELL’ART. 2, COMMA 2 DEL
DECRETO-LEGGE 25 MARZO 2020, N. 19 CONVERTITO CON MODIFICAZIONI DALLA L. 22 MAGGIO 2020, N. 35
https://www.gazzettaufficiale.it/eli/id/2020/10/21/20A05821/sg

                                                     6
over two thirds on Fridays and Saturdays. It is worth recalling that, because of the typical
weekly mobility patterns, e.g. showing internal mobility minima on Sundays ((Santamaria
et al., 2020)), in the attempt to extract mobility trends over different weeks, a given day
should be always compared with the same weekday. This is why in the figure days are
grouped by weekdays, in order to ease their comparison in time. The first three bars for
each weekday are relative to days preceding the entry into force of the curfew. The mobility
reduction in the night hours due to the curfew appears generally more pronounced for Milan
province.

Figure 2: Daily outward and internal mobility (between 23:00 and 24:00) for Lombardy (top) and
Milan province (bottom). The reference period is Thursday 1 October - Thursday 5 November 2020.
On Thursday 22 October, a regional decree entered into force, imposing curfew between 23:00 and
5:00. Percentages show the relative variation of mobility respect to the same weekday of the previous
week. Mobility data for 2 November is missing. The y-axes of the two charts are not in scale with
each other.

    The chart in Figure 3 is an alternative way to visualise the impact of the night curfew
imposed by the regional authorities on mobility in Lombardy (left) and in Milan province
(right). The week before (purple) and that after (orange) the entry into force of the curfew
are compared.

                                                 7
Figure 3: Daily outward and internal mobility (between 23:00 and 24:00) for Lombardy (left) and
Milan province (right). The seven days before the entry into force of the night curfew (purple) are
compared with the first seven days after the entry into force (orange). Percentages show the relative
variation of mobility respect to the same weekday of the previous week. The y-axes of the two charts
are not in scale with each other.
The reduction of mobility in the eleven other provinces in Lombardy was analogous to
that of Milan province, but with a slightly different effect. Figure 3 shows the daily internal
mobility (between 23:00 and 24:00) in Lombardy from 1 October 2020 to 1 February 2021.
The three-tier system entered into force on 6 November extending the night curfew measure
from 22:00 to 5:00, corresponded to an initial further decrease of mobility (internal +
outward) in Lombardy between 23:00 and 24:00. The effect of the additional restrictions
to mobility, adopted at National level to limits the spreading of the virus around Christmas
and the new year’s eve, are evident in the figure.
Figure 4: Daily internal mobility (between 23:00 and 24:00) in Lombardy from 1 October 2020 to 1
February 2021. Internal mobility is disaggregated by province. Labelled days in x-axis are Mondays.
The most pronounced weekly peaks of mobility are indicated by additional labels.
84.2 Impact of national restrictions from 6 November 2020 to 31 January
2021
The impact of the structured set of restrictions on mobility introduced by the national three-
tier system (Section 3) is investigated at different geographical scales, from the aggregate
regional to the city levels.
4.2.1 Regional level
As described in the Data section, the mobility indicators provide a daily time series of the
number of aggregate and anoymised movements of mobile phone users between geograph-
ical areas (see also (Santamaria et al., 2020)). In the following analysis, all indicators are
normalised using a reference value that is common to all granularity levels and mobil-
ity components (i.e. internal, inward and outward). For example, indicators at NUTS2 or
NUTS3 level of internal, inward or outward mobility are all normalised to the same reference
number in all regions or provinces in Italy, allowing for geographical comparison of mobil-
ity across different mobility components. Figures 5, 6, 7, and 8, show the total, internal,
inward, and outward daily mobility trends (respectively) for each region in Italy between 1
November 2020 and 1 February 2021. The same figures also show the succession of the
colour-coded restrictions in each region, which allows to visually relate possible changes in
the mobility trend during the transition from one level of restriction to another (see also
Table 1).
The impact of the different restrictions, the reaction time after the transition, as well as
a generalised progressive increase of mobility within the same colour scheme are clearly
visible in almost all the regions for all the movements components, either intra-regional
and between regions. The link between the type of transition (e.g. from yellow to red
or from orange to yellow) and the extent of variation of mobility can also be observed,
demonstrating a clear effectiveness of the restrictions in reducing mobility. In the following
part, such effect is further analysed quantified.
9Figure 5: Time evolution of colour-coded restrictions in different regions in Italy, their evolution over
time, total mobility (black line) and weekly average mobility (blue line).
10Figure 6: Time evolution of colour-coded restrictions in different regions in Italy, their evolution over
time, internal mobility (black line) and weekly average mobility (blue line).
11Figure 7: Time evolution of colour-coded restrictions in different regions in Italy, their evolution over
time, inward mobility (black line) and weekly average mobility (blue line).
12Figure 8: Time evolution of colour-coded restrictions in different regions in Italy, their evolution over
time, outward mobility (black line) and weekly average mobility (blue line).
13The impact of the different transitions of the three-tier system on mobility is now anal-
ysed over time and across regions in Italy. Such impact is computed by calculating, for
each transition between colors of a region, and for each mobility component, i.e. internal,
outward, inward and total.
The first step is to compute, for each region i in the set of italian regions I, for each
indicator j in the set of indicators that identify the type of movement (internal, inward,
outward or total), for each type of transition k ∈ K is the type of transition index (e.g.
orange to red, red to yellow etc.) and for each replicate of the transition of type k, l ∈ Lk ,
taking into account that the same transition can happen multiple times for the same region
and type of movement, a set of mobility indices pre- and post- the transition, indicated as
pre post
Ĩijkl and Ĩijkl as the arithmetic mean of the indicator k respectively before and after the
transition uniquely identified by i, j, l.
Having these average mobility indices, several possible metrics can be calculated to
describe the impact of the restrictions: in Table 1, the average percentage variation for
each transition type, and for each index, is computed as follows:
post pre
Ĩ·jk· Ĩ·jk·
|I||Lk | − |I||Lk |
post ∗ 100
Ĩ·jk·
|I||Lk |
post post
where Ĩ·jk· is the summation of Ĩijkj over the different i and j, L1 and L2 are the set of
days to and |·| indicates the cardinality of the set.
Transition Internal Inward Outward Total
yellow → orange -18.5% -19.9% -19.9% -18.5%
yellow → red -36.8% -40.5% -40.5% -36.9%
orange → red -28.1% -26.3% -26.2% -28.0%
red → orange +43.1% +38.7% +38.6% +43.0%
orange → yellow +24.7% +26.1% +25.9% +24.7%
Table 1: Overall variation of internal, outward and inward mobility depending on the transitions.
Table 1 is an indication of the overall impact of the transitions on the different type of
movement. It is worth noting that, since the volume of internal movements in the region
is substantially greater than the inward and outward ones, the impact of the restrictions
on total movements is biased towards the internal ones. It is also important to underline
that the transition yellow to orange seems having the lowest impact in relative terms, but
it refers to starting conditions of highest absolute volumes of movements as in yellow risk
(see Figure 5).
In Figure 9 calculations are performed using the following formula:
post pre
Ĩijk· Ĩijk·
|Lk | − |Lk |
post ∗ 100
Ĩijk·
|Lk |
That is the average percentage variation for each transition type, each index, and each
region. It can be seen that a specific transition has a generalised and aligned variation of
mobility, although this is not uniform, pointing to geographic differences. This aspect is
further analysed in Section 4.3.
14Mobility Indicator Regional Variation
300
200
Internal
100
0
−100
300
200
Inwards
100
0 Transition
Orange to Red
Variation (%)
Orange to Yellow
−100
Red to Orange
Red to Yellow
Yellow to Orange
300 Yellow to Red
200
Outwards
100
0
−100
300
200
Total
100
0
−100
Abruzzo
Aosta Valley*
Apulia
Aut. Prov. Bolzano
Aut. Prov. Trento
Basilicata
Calabria
Campania
E−R
Friuli−VG
Lazio
Liguria
Lombardy
Marche
Molise
Piedmont
Sardinia
Sicily
Tuscany
Umbria
Veneto
Regions
Figure 9: Barplot of percent regional variations of mobility indicators: internal, inward, outward and
total (top to bottom).
15By analysing the mobility data, it is clear that the transition into a new restriction regime
in most cases leads to a rapid change in the mobility indicators. When the new phase is
stricter (e.g. from yellow to orange, or from orange to red) mobility falls abruptly, while if
the new phase is more relaxed (e.g. from red to orange, or from orange to yellow) mobility
returns to higher level. Once in a new phase, mobility generally rises with time towards the
levels registered before the new restrictions are enforced. A possible interpretation could
be that the population is quick to adapt to the new restriction situation, but tend to either
comply less or understand better the perimeters and margins of movements allowed by
such restrictions as time passes. A regression analysis at province level (NUTS3) is here
applied to Lombardy mobility indicators shown in Figure 10 to quantify the relaxation effect
during this phase, see Table 2.
Figure 10: Daily internal mobility by province in Lombardy (Oct. 2020 to Jan. 2021). Labelled days
in x-axis are Mondays. The weekly peak of mobility is indicated by additional labels.
Estimate Std. Error t value P r(>|t|)
(Intercept) 0.06932 0.01196 5.794 9.29e-09∗∗∗
Orange→Red -0.08713 0.02266 -3.845 0.000128∗∗∗
Orange→Yellow 0.25205 0.02620 9.620 < 2e-16∗∗∗
Red→Orange 0.14379 0.01742 8.257 4.91e-16∗∗∗
Yellow→Orange -0.28374 0.03852 -7.365 3.80e-13∗∗∗
Yellow→Red -0.33817 0.02265 -14.932 < 2e-16∗∗∗
weekend/bank holiday -0.10483 0.01446 -7.249 8.64e-13∗∗∗
Signif. codes: 0 ‘***’ 0.001 ‘**’ 0.01 ‘*’ 0.05 ‘.’ 0.1 ‘ ’ 1
Residual standard error: 0.2104 on 961 degrees of freedom
Multiple R-squared: 0.4075, Adjusted R-squared: 0.4038
F-statistic: 110.1 on 6 and 961 DF, p-value: < 2.2e-16
Table 2: Regression Analysis of the relaxation effect after the transition to stricter restrictions. The
dependent variable is the percentage change in mobility compared to the previous week.
The dependent variable of the regression model presented in Table 2, is the percentage
change in mobility compared to the week before. The regression model takes into account
the zone colour-code (i.e. level of restriction) on current day and on the same day of the
previous week, as well as whether it is a weekend or bank holiday. The intercept means
that the underlying trend is positive, and it is translated to an approximate 7% increase
on mobility per week while the restrictions remain the same. In other word this means
that people tend to move 1% more per day and this is referred to as the relaxation to the
restrictions.
The trend of mobility reduction and the subsequent increase during the first lockdown in
16Italy in early March 2020 was different if compared to the one observed in the second. As
shown in Figure 11 the drop of mobility was more pronounced in March, as a consequence
of the the stricter measures in place compared to the ones implemented during the three-
tier system. In addition, in March 2020, the same restrictions applied to the whole country
with no regional variations. Compared to the first week (9-16 March) of the first lockdown,
the mobility decreased by 24% in second week (16-22 March), and by a further 11% in the
third week (23-29 March) when it reached its lowest point. From that week (23-29 March)
and onward, mobility started gradually recovering by 3% in the fourth week followed by
another 6% in the fifth week.
Figure 11: Total mobility aggregated at national level during the first lockdown in March 2020 and
the three-tier system from November 2020 to 31 January 2021.
The effects of the ministerial decree setting up the three-tier system are now analysed
in detail for the Lombardy Region, which became a red area. After three weeks, on Sunday
29 November, Lombardy transitioned from red to orange.
Figure 12 shows the daily mobility for the region and its relative variation respect to the
same weekday of the previous week.
The highest relative reductions of mobility appear to be related with festivity:
— -56% (yellow→red): Friday 18 Dec - Friday 25 Dec (Christmas);
— -49% (yellow→red): Saturday 19 Dec - Saturday 26 Dec (St. Stephen’s Day);
— -47% (orange→red): Wednesday 30 Dec - Wednesday 6 Jan (Epiphany);
— -41% (orange→orange): Tuesday 1 Dec - Tuesday 8 Dec (Feast of the Immaculate
Conception).
Only the following highest reduction is not related to a festivity, but to the first Sunday
since the entry into force of the decree:
— -38% (before 3-tier→orange): Sunday 1 Nov - Sunday 8 Nov.
Also the highest relative increases are related to festivity:
— +134% (red→yellow): Friday 1 Jan (New Year’s Day) - Friday 8 Jan;
— +115% (red→orange): Wednesday 6 Jan (Epiphany) - Wednesday 13 Jan;
— +89% (orange→yellow): Tuesday 8 Dec (Feast of the Immaculate Conception) - Tues-
day 15 Dec;
The following highest relative increase of mobility correspond to the first yellow day after
36 days from the entry into force of the decree:
— +44% (orange→yellow): Sunday 6 Dec - Sunday 13 Dec.
17Figure 12: Total daily mobility for Lombardy (bar height) by weekdays and its relative variation
respect to the same day of the previous week. Colours are associated to the three-tier system; grey
bars are relative to days before the entry into force of the decree.
As a general consideration, which holds also for the other Italian regions, the evident
decrease of mobility due to the transition to an higher risk-level tier (i.e. from yellow
to orange or from orange to red), is mitigated throughout the same tier highlighting the
relaxation effect on restrictions as discussed above.
4.2.2 Province level
The three-tier scheme was effective nationally as of 6 November 2020. It is important to
understand to what extent such measures are adopted uniformly at province level.
(a) Risk areas (b) NUTS2 Mobility variation (c) NUTS3 Mobility Variation
Figure 13: Distribution of colour-coded restrictions in Italy following the ministerial decree of 6
November 2020 (a) and variation of total mobility between Monday 27 October 2020 and Monday
10 November 2020 at regional (b) and provincial level (c).
In Figure 13a, the map shows the colours of the regions across the country. As also
illustrated by the first column of Figure 1, on 6 November four regions were set as red zones
(Calabria, Lombardy, Piedmont and Aosta Valley), two orange (Apulia and Sicily) and the
remainder yellow. The effect of the restrictions can be seen in Figure 13b, reporting the
variation of total mobility between Tuesday 27 October and Tuesday 10 November. The
relative drop of mobility is more pronounced for red zones, notably -26.1% in Aosta Valley,
18-25.3% in Piedmont and -23.5% in Lombardy where the largest reduction of number of
movements was registered in Italy at the turn of the entry onto force of the ministerial
decree. In Figure 13c, the relative variation of total movements in the same time period is
shown at NUTS3 level. Provinces are consistently aligned with the measures taken at the
level of their region.
4.2.3 Local level
The impact of the restrictions on mobility enforced at national level with different levels
according to the three-tier systems of regional zones is now analysed at more local level.
Between Tuesday 27 October and Tuesday 10 November 2020, at the turn of the entry
onto force of the ministerial decree identifying Lombardy as a high risk area and therefore
enacting the most stringent measures, data shows an average -23.5% reduction of total
mobility, notably -26% for the province of Milan.
Figure 14: Variation of total mobility between 27 October and 10 November 2020 in the province of
Milan.
Figure 14 illustrates a map of total mobility reduction over different census tracts in the
province of Milan. The distribution of the mobility variation in Figure 18 shows an overall
adherence to the restrictions adopted at regional scale, with a drop of up to -40% in high
population density areas as the city of Milan located in the center of the map, or in proximity
of large commercial centres or shopping areas (e.g. North-East and North-West of Milan,
in the areas of Lainate and Carugate).
19Figure 15: Distribution of total mobility variation between 27 October and 10 November 2020 of
census tracts in the province of Milan.
4.3 Mobility comparison between January 2020 and January 2021
A general decrease in total mobility is observed comparing January 2021 against January
2021 (Figure 16). The mobility in January 2021 during working days (which are usually
when most movement of the week is registered), is in general at the same level of the 2020
mobility during weekend (which instead represent the lowest values of mobility). Figure 16
also shows that the decrease is greater when restrictions in the form of risk zones are most
severe (i.e. when many regions are under red zone restrictions, see also Figure 1).
Figure 16: Comparison between total mobility in January 2020 (solid black line) versus January 2021
(dashed black line) differentiated by risk zones (see Figure 19) components (bar graph).
Table 3 quantifies the variation of mobility in January 2021 compared to the previous
year for each region. A decrease in mobility is observed for all regions, with drops greater
than or equal to 50% for Aosta Valley, Autonomous Province of Trento and Autonomous
Province of Bolzano. The average percentage reduction of mobility per region is -29.9%.
The distribution of mobility variation does not show a clear correlation with the number
of days of high, medium or low restrictions. As an example, the lowest set of mobility
restrictions (5 days of red, 3 days of orange and 23 days of yellow zones) applied to distinct
regions resulted in different mobility variations: -53% in the Autonomous Province of Trento
and -17.3% in Molise.
20Region Variation % Red Orange Yellow Nr cases per
Jan 2020 - Jan 2021 days days days 100k inhabitants
Aosta Valley -57.0% 5 18 8 6236
Aut. Prov. Trento -53.2% 5 3 23 5047
Aut. Prov. Bolzano -50.0% 20 3 8 7541
Veneto -41.6% 5 24 2 6398
Friuli Venezia Giulia -39.3% 5 18 8 5599
Emilia-Romagna -35.4% 5 24 2 4898
Lombardy -34.6% 12 17 2 5366
Piedmont -32.4% 5 18 8 5175
Marche -28.5% 5 18 8 3668
Liguria -27.8% 5 18 8 4569
Apulia -26.0% 5 18 8 3109
Sicily -25.5% 20 9 2 2792
Lazio -24.6% 5 18 8 3569
Tuscany -22.6% 5 3 23 3641
Basilicata -21.2% 5 3 23 2391
Abruzzo -20.9% 5 18 8 3311
Umbria -20.3% 5 18 8 4143
Campania -20.2% 5 3 23 3890
Molise -17.3% 5 3 23 2780
Sardinia -16.1% 5 11 15 2391
Calabria -14.4% 5 24 2 1729
Table 3: January 2021 percentage mobility variation compared to January 2020 for each Italian
region, with number of days of red, orange, and yellow zones in January 2021, and number of
cumulative COVID-19 cases per 100.000 inhabitants as of 31 January 2021.
Figure 17: Relationship between mobility variation between January 2021 and January 2020 in Italian
regions and the total number of COVID-19 cases as of 31 January 2021.
21Nevertheless, as shown in Figure 17, the variation of mobility reduction is correlated to
the number of COVID-19 cases in the different regions provided by the Italian Department
of Civil Protection13 and normalised to the resident population data provided by ISTAT14 .
This suggests a variable impact of the measures depending on the incidence of the virus,
greater where the number of total cases since the start of the pandemic has been greater.
5 Economic impact analysis
Despite being a relative sudden phenomenon, the dramatic impact of the COVID-19 pan-
demic on the world has triggered numerous research efforts aimed at estimating its eco-
nomic impact (see e.g. (van der Wielen and Barrios, 2020, Maliszewska et al., 2020,
Sarkodie and Owusu, 2020,Makridis and Hartley, 2020,McKibbin and Fernando, 2020,Atke-
son, 2020, Maital and Barzani, 2020)). We contribute to this literature by proposing an ad-
mittedly simple but effective method to assess the economic impact of mobility restrictions,
via a nowcasting approach. In order to do so, a simplified analysis of economic impact based
on the relationships between demand of electricity and GDP and electricity and mobility is
performed. GDP monthly estimates are available until August 2020 at World Bank while
energy demand in GWh is available until December 2020 through the monthly report by
Terna15 . As the mobility term, the monthly average of the total mobility indicators ad the
national scale has been used. All values are normalised to their respective levels levels on
January 2020. Table 4 shows the correlation between the three dimensions.
gdp energy mobility
gdp 1 0.81 0.76
energy 0.81 1 0.90
mobility 0.76 0.90 1
Table 4: Spearman correlation coefficient among mobility, energy demand and GDP.
As in (Chen et al., 2020), the relationship between GDP and electricity demand at
monthly frequency and at country level is estimated with the following simple regression:
GDPt = α0 + α1 energyt + α2 energy2 + t , t = Jan19, . . . , Aug20. (1)
The quadratic term seems to captures better the relationship between the two variables.
The results of the regression are reported in Table 5
A similar equation for the demand of electricity and mobility, also at national level, is
then estimated
electricityt = β0 + β1 mobilityt , t = Jan20, . . . , Dec20. (2)
In this case, the additional quadratic term does not give any contribution, hence a simple
linear relationship is adopted. The results are reported in Table 6.
At this point, model Eq. (1) allows to forecast the GDP indicators for September, October,
November and December 2020, and the combination of Eq. (2) and again Eq. (1) allows
to nowcast also January 2021, although it might be noticed that the January 2021 nowcast
is subject to the forecast error in energy demand due to model Eq. (2) times the forecast
error of model Eq. (1). The results are reported in Table 7 with confidence intervals16 .
One could think to use directly the mobility to describe GDP but, in fact, it is not yet known
which portion of mobility reduction corresponds to teleworking, therefore it is assumed that
the demand of electricity is a better proxy of productivity. Also, on the technical side, the
linear and nonlinear models for GDP vs mobility does not, in fact, fit as well as the model
based on energy consumption.
13 ItalianDepartment of Civil Protection, COVID-19 data repository: https://github.com/pcm-dpc/COVID-19
14 Italian National Institute of Statistics - ISTAT, Resident population on 1st January by region: http://dati.
istat.it/Index.aspx?DataSetCode=DCIS_POPRES1
15 Terna Rete Italia is the company that deals with the national electricity grid’s operation, maintenance and
development in Italy.
16 Prediction intervals are 1 percentage point larger on average.
22Dependent variable:
GDP
energy 3.652∗∗
(1.441)
energyˆ2 −0.017∗∗
(0.008)
constant −92.089
(67.248)
Observations 20
R2 0.531
Adjusted R2 0.476
Residual Std. Error 4.275 (df = 17)
F Statistic 9.638∗∗∗ (df = 2; 17)
∗ ∗∗ ∗∗∗
Note: pItalian Gross Domestic Product (Jan 2020 = 100)
100
95
90
85
2019−01 2019−07 2020−01 2020−07 2021−01
Figure 18: Plot of Italian Gross Domestic Product, in relative terms with respect to January 2020:
The blue ribbon represents the 95% confidence interval limits of the nowcast estimates.
5.1 Regional impact on GDP
As seen in Table 3 there are quite relevant regional differences in mobility reduction given
the same policy measures as it is also well known that each region contribute differently to
the national GDP of the country. In order to estimate the change in GDP gain/loss during
the different periods the steps are:
— to estimate the daily energy demand using daily total mobility for region r and model
Eq. (2);
— to estimate the GDP daily variation at regional level via model Eq. (1);
— for each transition from, e.g., yellow → orange, orange → red, etc, to estimate the
average loss/gain of GDP by region and then weighting accordingly to the relative
contribution of each region to the national GDP (see Table 8).
Region Contribution Region Contribution
Abruzzo 1.92% Liguria 2.83%
Aosta Valley 0.28% Lombardy 22.00%
Apulia 4.35% Marche 2.45%
Aut. Prov. Bolzano 1.41% Molise 0.37%
Aut. Prov. Trento 1.16% Piedmont 7.78%
Basilicata 0.71% Sardinia 1.98%
Calabria 1.89% Sicily 5.06%
Campania 6.11% Tuscany 6.67%
Emilia-Romagna 9.15% Umbria 1.27%
Friuli Venezia Giulia 2.16% Veneto 9.26%
Lazio 11.21%
Table 8: Relative contribution of each region to the national GDP for year 2018. The relative contri-
bution were calculated using NUTS2-level Gross Domestic Product data provided by Eurostat.
This way, the bias due to regions that contribute less in terms of GDP but also experience
less mobility reduction or vice-versa is avoided. The results of the analysis are given in
Table 9 in which the average daily GDP variation compared to previous period is reported.
Remark that these are not absolute losses/gain compared to a business as usual situation,
but only with respect to previous stringency measure status, i.e., there is no transition
from white regime to yellow, for example. Further, these are daily effects and have to be
considered cumulatively for the length of the period in each stringency status to get an
overall loss/gain of GDP at national level. We do not go into these details, but we notice
that the effects are consistent with expectations: i) the stronger the stringency measures,
the higher the GDP loss and ii) that there is symmetry in these variations, therefore the
length of each status is a key element to determine the final balance of stringency measures
on GDP.
24Transition GDP average daily % variation
yellow → orange -0.15%
yellow → red -0.33%
orange → red -0.22%
red → orange +0.24%
orange → yellow +0.16%
Table 9: Average daily % variation of Gross Domestic Product compared to the previous status,
depending on the transitions.
6 Conclusions
The present work examines the impact on the mobility and the economy of the restrictive
measures adopted to fight COVID-19 in Italy. The study focuses on the period from 6
November 2020 to 31 January 2021, during which a three-tier system based on different
levels of risk was adopted and applied at regional level during the second wave of the
pandemic. Mobile Network Operator anonymised and aggregate mobility data shared in the
context of a Business-to-Government initiative with the European Commission were used
to quantify the impact of these restrictions on the mobility. Furthermore, mobility data
variations are used as a proxy to estimate the impact of the restrictions on the economy in
different areas of the country.
The analyses were performed at different spatial resolution, from the national and re-
gional up to the city level. The results indicate that the impact observed for larger scale
(i.e. regional), also applies to the smaller ones. For example, the drop of total mobility at
NUTS2 (regional) level is in line with the reduction of mobility at NUTS3 (province) level.
Overall, each restriction (from low-yellow, to high-red), has proved effective in system-
atically reducing the mobility. In particular, transitioning to high-risk red zones resulted
in a reduction of total movements of -28% (-26.2% outward movements) and -36.9%
(-40.5% outward movements) when downgrading from orange and yellow zones respec-
tively. When comparing mobility in January 2021 and January 2020, i.e. during and before
mobility restrictions respectively, the results show a mobility reduction of -29.9% on av-
erage. However, this varies substantially between regions. Despite a limited correlation
between the variation of mobility and the number of days of high, medium or low restric-
tions, the variation of mobility seems correlated to the number of COVID-19 cases in the
different regions, suggesting an impact of the restrictions on mobility in direct proportion to
the epidemiological situation. In other words, with the same level of restriction defined by
the three-tier system, the resulting mobility reduction varies across regions and correlates
with the epidemiological situation.
In general, once a region transits into a zone with further restrictions, after an initial drop,
a systematic slight increase of mobility is observed over time. This relaxation tendency
to the restrictions, can be quantified to an approximate 7% per week while the level of
restrictions remain the same.
A significant impact of the three-tier system on Italian economic activity has been mea-
sured via a nowcasting framework applied on the gross domestic product (GDP), based
on the relationships between demand of electricity and GDP, and electricity and mobility.
The overall variations of GDP depending on each type of transition are coherent with the
strengthening/weakening of the restrictions, ranging from an average daily variation of
-0.33% for a yellow to red transition, to +0.24% for a red to orange one). These varia-
tions have to be taken with several caveats: they are daily average variations, and so, to
obtain an overall loss/gain of GDP at a national level they need to be considered cumula-
tively for the length of the period in which the mobility restriction measure is taken and,
more importantly, they represent a rough estimation, worth of further (and more refined)
mathematical and statistical modelling.
This analysis can be further complemented and extended to other countries covered
by the Business-to-Government data sharing initiative between European Mobile Network
Operators and the European Commission.
Finally, the results can be used by national and local authorities to better design and
implement targeted policies and measures that balance between the socio-economic impact
of the mobility restriction and their epidemiological outcome.
25References
Aleta, A. and Moreno, Y., ‘Evaluation of the potential incidence of covid-19 and effectiveness
of containment measures in spain: a data-driven approach’, BMC medicine, Vol. 18, 2020,
pp. 1–12.
Atkeson, A., ‘What will be the economic impact of covid-19 in the us? rough estimates of
disease scenarios’, Tech. rep., National Bureau of Economic Research, 2020.
Buckee, C. O., Balsari, S., Chan, J., Crosas, M., Dominici, F., Gasser, U., Grad, Y. H.,
Grenfell, B., Halloran, M. E., Kraemer, M. U. et al., ‘Aggregated mobility data could help
fight covid-19’, Science (New York, NY), Vol. 368, No 6487, 2020, pp. 145–146.
Chen, S., Igan, D., Pierri, N. and Presbitero, A. F., ‘Tracking the economic impact of covid-19
and mitigation policies in europe and the united states’, IMF: Special Series on COVID-19,
Vol. May 6, 2020, pp. 1–10.
Christidis, P., Ciuffo, B., Vespe, M. and Cardarelli, V., ‘Movilidad en andalucía durante la pan-
demia de covid-19 (enero 2021)’, Tech. Rep. KJ-NA-30598-ES-N (online), Joint Research
Centre (JRC) - European Commission, Luxembourg (Luxembourg), 2021. .
COM(2020), 786, ‘Communication from the commission to the european parliament and
the council, staying safe from covid-19 during winter’. https://ec.europa.eu/health/sites/
health/files/preparedness_response/docs/covid-19_stayingsafe_communication_en.pdf,
2020.
De Groeve, T., Annunziato, A., Galbusera, L., Giannopoulos, G., Iacus, S., Vespe, M.,
Rueda-Cantuche, J., Conte, A., Sudre, B. and Johnson, H., ‘Scenarios and tools for locally
targeted covid-19 non pharmaceutical intervention measures, JRC122800’, Tech. Rep. KJ-
NA-30523-EN-N, Joint Research Centre (JRC) - European Commission, Luxembourg (Lux-
embourg), 2020. .
EDPB, ‘Guidelines 04/2020 on the use of location data and contact tracing tools in the con-
text of the covid-19 outbreak’, 2020. Available at https://edpb.europa.eu/our-work-tools/
our-documents/linee-guida/guidelines-042020-use-location-data-and-contact-tracing_en.
Espinoza, B., Castillo-Chavez, C. and Perrings, C., ‘Mobility restrictions for the control of
epidemics: When do they work?’, Plos one, Vol. 15, No 7, 2020, p. e0235731.
Iacus, S. M., Santamaria, C., Sermi, F., Spyratos, S., Tarchi, D. and Vespe, M., ‘Human
mobility and covid-19 initial dynamics’, Nonlinear Dynamics, Vol. 101, No 3, 2020a, pp.
1901–1919.
Iacus, S. M., Santamaria, C., Sermi, F., Spyratos, S., Tarchi, D. and Vespe, M., ‘Mapping
mobility functional areas (MFA) using mobile positioning data to inform covid-19 policies,
JRC121299’, Tech. Rep. KJ-NA-30291-EN-N, Joint Research Centre (JRC) - European Com-
mission, Luxembourg (Luxembourg), 2020b.
Iacus, S. M., Santamaria, C., Sermi, F., Spyratos, S., Tarchi, D. and Vespe, M., ‘Mobility
functional areas and covid-19 spread’, arXiv preprint arXiv:2103.16894, 2021a.
Iacus, S. M., Sermi, F., Spyratos, S., Tarchi, D. and Vespe, M., ‘Anomaly detection of mobile
positioning data with applications to covid-19 situational awareness’, Japanese Journal of
Statistics and Data Science, Mar 2021b. ISSN 2520-8764. . URL https://doi.org/10.1007/
s42081-021-00109-z.
Maital, S. and Barzani, E., ‘The global economic impact of covid-19: A summary of research’,
Samuel Neaman Institute for National Policy Research, Vol. 2020, 2020, pp. 1–12.
Makridis, C. and Hartley, J., ‘The cost of covid-19: A rough estimate of the 2020 us gdp
impact’, Special Edition Policy Brief, 2020.
Maliszewska, M., Mattoo, A. and Van Der Mensbrugghe, D., ‘The potential impact of covid-19
on gdp and trade: A preliminary assessment’, World Bank Policy Research Working Paper,
2020.
26You can also read