JUNE 2020 NYSE American: NOG - NYSE American: NOG - cloudfront.net

Page created by Stephen Coleman
 
CONTINUE READING
JUNE 2020 NYSE American: NOG - NYSE American: NOG - cloudfront.net
NYSE American: NOG

  JUNE 2020

NYSE American: NOG
JUNE 2020 NYSE American: NOG - NYSE American: NOG - cloudfront.net
FORWARD LOOKING STATEMENTS
                                                                                                                                                 NYSE American: NOG

 This presentation contains forward-looking statements regarding future events and future results that are subject to the safe harbors created under the
 Securities Act of 1933 (the “Securities Act”) and the Securities Exchange Act of 1934 (the “Exchange Act”). All statements other than statements of
 historical facts included in this presentation regarding Northern’s financial position, business strategy, plans and objectives of management for future
 operations, industry conditions, and indebtedness covenant compliance are forward-looking statements. When used in this presentation, forward-looking
 statements are generally accompanied by terms or phrases such as “estimate,” “project,” “predict,” “believe,” “expect,” “continue,” “anticipate,” “target,”
 “could,” “plan,” “intend,” “seek,” “goal,” “will,” “should,” “may” or other words and similar expressions that convey the uncertainty of future events or
 outcomes. Items contemplating or making assumptions about actual or potential future sales, market size, collaborations, and trends or operating results
 also constitute such forward-looking statements.
 Forward-looking statements involve inherent risks and uncertainties, and important factors (many of which are beyond our company’s control) that could
 cause actual results to differ materially from those set forth in the forward-looking statements, including the following: the effects of the COVID-19
 pandemic and related economic slowdown, changes in crude oil and natural gas prices, the pace of drilling and completions activity on Northern’s current
 properties, infrastructure constraints and related factors affecting Northern’s properties, Northern’s ability to acquire additional development
 opportunities, changes in Northern’s reserves estimates or the value thereof, general economic or industry conditions, nationally and/or in the
 communities in which Northern conducts business, changes in the interest rate environment, legislation or regulatory requirements, conditions of the
 securities markets, Northern’s ability to raise or access capital, changes in accounting principles, policies or guidelines, financial or political instability,
 health-related epidemics, acts of war or terrorism, and other economic, competitive, governmental, regulatory and technical factors affecting Northern’s
 operations, products and prices.
 Northern has based these forward-looking statements on its current expectations and assumptions about future events. While management considers
 these expectations and assumptions to be reasonable, they are inherently subject to significant business, economic, competitive, regulatory and other
 risks, contingencies and uncertainties, most of which are difficult to predict and many of which are beyond Northern’s control. Northern does not
 undertake any duty to update or revise any forward-looking statements, except as may be required by the federal securities laws.

                                                                                                                                 Northern Oil & Gas, Inc. - May 2020   2
JUNE 2020 NYSE American: NOG - NYSE American: NOG - cloudfront.net
NYSE American: NOG

I.   1-PAGER, VALUE PROPOSITION, & RECENT EVENTS
II. COMPANY OVERVIEW
III. BALANCE SHEET & HEDGES
IV. ASSET & ENGINEERING REVIEW
V. GROWTH STRATEGY- ORGANIC & M&A
VI. APPENDIX: SUPPLEMENTAL INFO
JUNE 2020 NYSE American: NOG - NYSE American: NOG - cloudfront.net
NORTHERN 1-PAGER
                                                                                                                                                                                                                                     NYSE American: NOG

                                Non-Operator Model — Benefits                                                                                                                                Williston Basin Core—183,245 net acres
                 ✓ A superior return on capital (16.3% ROCE (1) in 2019)
                 ✓ Increased free cash flow (2) (>$125MM in 2020E)
                 ✓ A Lean structure—only 24 full-time employees
                 ✓ Capital allocation flexibility—46 partners across 761K gross
                   acres—easy to say “no thanks” when thresholds are not met

                                 Management/Shareholder Alignment
                                                                                                                                                                                                            4
                  ✓ Strengthened Executive Roster
                  ✓ Insider and Management Ownership of ~30%
                  ✓ Stock is 100% of Incentive Compensation                                                                                                                                NORTHERN HAS PARTICIPATED IN >40% OF
                  ✓ Cash G&A < $1/boe                                                                                                                                                     WELLS EVER DRILLED IN THE WILLISTON BASIN

                  ✓ Emphasis on risk mitigation (HEDGES!)                                                                                                                            Q120 Production                            Hedges: $55-$58/bbl
                                Healthy Balance Sheet
                                                                                                                                                                                    43.7 mboe/d                              2020: 27,062 bpd
                  ✓ 2.3x Net Debt/EBITDA Q1:20 vs. 6.3x at YE17
                                                                                                                                                                                    79% Oil; +28% YoY                        2021: 19,087 bpd
1.   See Slide 31 for Definition and Methodology
2.   Northern defines Free Cash Flow as net cash provided by operating activities excluding changes in working capital, less capital expenditures, and Free Cash Flow Yield as FCF divided by the current common equity
     market value. These are non-GAAP financial metrics. Northern is unable to present a reconciliation of forward-looking Free Cash Flow because components of the calculation, including fluctuations in working capital                            4
     accounts, are inherently unpredictable.
JUNE 2020 NYSE American: NOG - NYSE American: NOG - cloudfront.net
THE NOG INVESTMENT PROPOSITION
                                                                                                                                                     NYSE American: NOG
  ➢ Northern has prepared to face the environment seen today

                                                                                                 • Best in Class ROCE in E&P space: 16.3% in 2019
                        1             SUPERIOR RETURNS & FCF
                                                                                                 • Free Cash Flow approaching market cap over next 2 years

                                     SUPERIOR DATA SET & CAPITAL                                 • NOG has participated in >40% Bakken wells (>6.5K gross)
                        2                                                                        • NOG has >300 internal type curves; economics by operator
                                     ALLOCATION

                                                                                                 • Organic: >750 net locations weighted toward Bakken core
                        3             ORGANIC & M&A UPSIDE
                                                                                                 • Acquisitions: Ground Game + M&A= highly accretive opportunities

                                                                                                 • Majority hedged in 2020 (>$58/bbl) and 2021 (>$55/bbl)
                        4             SIGNIFICANTLY HEDGED                                       • Value of the hedge book ~$375MM (1)

                                                                                                 • 2020 Free Cash Flow yield >40%
                       5              COMPELLING                         VALUATION (2)           • 2020 EV/EBITDA= 4.1x
                                                                                                 • 2019 P/E RATIO= 2.4x (FY19 realized oil price = $54.66/bbl)

(1)   Hedge valuation based as of 5/8/2020
(2)   Valuation as of 5/8/2020; 2020 EBITDA is at the midpoint of 2020 guidance as of 5/11/20.                                                                       5
JUNE 2020 NYSE American: NOG - NYSE American: NOG - cloudfront.net
RECENT EVENTS WORTH TALKING ABOUT
                                                                                                                                                                                                                                                                  NYSE American: NOG
  ➢ INCREMENTAL DATA POINTS FROM Q1 AND AFTERWARD
                                                                                                                                                                      ✓ NOG’s recycle ratio remained strong at 1.8x
                                 Margins Remained Strong in Q1
                                                                                                                                                                      ✓ Cash Margin ($27.31/boe) / DD&A ($15.53/boe)

                          2020 EBITDA Not Tied to Production                                                                                                          ✓ NOG anticipates $350-$410 million in Adjusted
                                                                                                                                                                        EBITDA(1) for 2020

                                                                                                                                                                      ✓ $175 - $200 million, down 56% at the midpoint vs.
                                               2020 CAPEX Controlled
                                                                                                                                                                        2019

                                                                                                                                                                      ✓ $90.2 million of secured debt was retired during Q1
                                          Debt Reduction Continues
                                                                                                                                                                      ✓ Additional $30.2 million subsequently retired in Q2

                               Production Shut-ins Unsurprising                                                                                                       ✓ Substantial production curtailments in April and May
(1)   Adjusted EBITDA is a non-GAAP financial measure. Northern’s 2020 Adjusted EBITDA guidance range was estimated using (i) actual results for the first quarter of 2020 and (ii) strip prices for oil and natural gas as of May 8, 2020, which represents an
      average WTI oil price of approximately $26.90 per barrel and an average Henry Hub natural gas price of $2.34 per Mcf, for April through December 2020. See appendix for reconciliations of historical Adjusted EBITDA. Northern is unable to provide a
      reconciliation of forward-looking Adjusted EBITDA guidance without undue hardship because it is an estimate, approximation and/or range, and it would be difficult to present a detailed reconciliation on account of many unknown variables for the                        6
      reconciling items.
JUNE 2020 NYSE American: NOG - NYSE American: NOG - cloudfront.net
NYSE American: NOG

I.   1-PAGER, VALUE PROPOSITION, & RECENT EVENTS
II. COMPANY OVERVIEW
III. BALANCE SHEET & HEDGES
IV. ASSET & ENGINEERING REVIEW
V. GROWTH STRATEGY- ORGANIC & M&A
VI. APPENDIX: SUPPLEMENTAL INFO
JUNE 2020 NYSE American: NOG - NYSE American: NOG - cloudfront.net
CURRENT NOG ASSET SNAPSHOT
                                                                                                                                                           NYSE American: NOG
 ➢ Portfolio of high-quality acreage in the heart of the basin with interests in over 6,500 gross Bakken/Three Forks oil wells

                                                          NET ACREAGE SUMMARY

                            9%                                             10%                                    8%
                                                                                                                                           183,245
                                                                                                                                               NET ACRES

                                  91%                                             90%                                  92%

                North Dakota            Montana                       HBP 1      % Non-HBP            ND % HBP
                                                                                                                  1
                                                                                                                       ND % Non-HBP            90%
                                                                                                                                          HELD BY PRODUCTION1
                                                            NET ACRES BY COUNTY
                   50,166                                                                        Northern’s top counties are the
                                       37,290                                                   ‘Big 4’ in the core of the Williston
                                                          28,453
                                                                              17,270         16,485      17,013            16,567               40+
                                                                                                                                          OPERATOR PARTNERS

                  McKenzie            Mountrail           Williams             Dunn          Divide       Other       Montana and Other
                                                                   NORTH DAKOTA                                          MONTANA

Source: Company data as of 3/31/20. ‘HBP’ is acreage held by production
1. Includes acreage classified as held by production, held by operations or developed
                                                                                                                                                                           8
FIXING THE BALANCE SHEET & ACHIEVING SCALE
                                                                                                                                                                                                          NYSE American: NOG
 ➢ Participation in the highest quality wells with stable AFE costs generates consistent production growth & higher IRRs
                        CONSISTENTLY FUNDING ATTRACTIVE WELLS…                                                            …GENERATES CONSISTENT PRODUCTION GROWTH
                 Wells In Process @ Period End                        Organic Net Wells added to Production                                                Production (mBoe/d)
                                                                                                                           Material, but measured
                  Increasing well                                                                                           production growth                                                     43.9      43.7
                                                                                                                                                                     +26%
                   participation                                    +9%                               14.6                                                  36.3
                                                                                                                                                                                         40.8
                                                                                           13.3                                                                       34.6       35.0
                                                                                 8.1                             7.3                              26.7
                                                       7.7           7.0
                                        9.3                                                                     27.2                    21.0
               5.8         8.5                                      24.7        25.0                  25.8                    18.0
                                                     22.8                                  24.2
               19.0                   19.2
                          16.4

              Q1 '18     Q2 '18      Q3 '18        Q4 '18           Q1 '19      Q2 '19     Q3 '19     Q4 '19    Q1'20         Q1 '18    Q2 '18    Q3 '18    Q4 '18    Q1 '19    Q2'19   Q3 '19   Q4 '19     Q1 '20

                        PARTICIPATING IN COST-EFFECTIVE AFES…                                                           …WHILE MAINTAINING PEER-LEADING LOW CASH G&A1
                                                  Avg. Consented Well AFE ($MM)                                                                              Cash G&A per BOE

                        Consistent well costs across Williston counties
                                                                                                                             $1.58
                       $7.9      $8.1         $8.1           $8.1       $8.2       $7.7      $7.7       $8.1    $7.6                             $1.28
                                                                                                                                                                               $1.13    $1.15
                                                                                                                                       $1.01                         $1.06
                                                                                                                                                           $0.92                                 $0.91     $0.95

                      Q1 '18     Q2 '18       Q3 '18     Q4 '18        Q1 '19     2Q '19     Q3 '19    Q4 '19   Q1'20        Q1 '18    Q2 '18    Q3 '18    Q4 '18    Q1 '19    Q2 '19   Q3 '19   Q4 '19     Q1 '20
1. Cash G&A is a non-GAAP financial measure. Please see the appendix for reconciliation to the most directly comparable GAAP Measure.                                                                                     9
THE RECENT EVOLUTION OF NORTHERN OIL & GAS
                                                                                                                                                                 NYSE American: NOG

                                                                          ➢ Entry into new RBL facility and                                                  ➢ Northern enters into
➢ Northern has 16.8mBoe/d
                                                                            successful existing Secured Notes                                                  COVID/OPEC driven Oil
  of production, $145mm
                                                                            consent solicitation / upsize for                                                  price collapse with
  of EBITDA and 6.2x Net
                                                                            retirement of first lien term loan      ➢ Closing of $310mm Flywheel               leverage at 2.3x, record
  Leverage                       ➢ Privately negotiated over
                                                                            and residual 2020 unsecured notes         VEN Bakken acquisition                   reserves and production
➢ Material shareholder             $100mm senior notes for                                                          ➢ Adds 6,600 boepd and                     of ~44kboepd and
  Bahram Akradi is named           common equity exchanges to                                                         significant core inventory               majority of expected
  Lead Independent                 further deleveraging efforts and                                                                                            production hedged
  Director on the Board            address a near term maturity                                                                                                through 2021

                   Feb 2018                          Summer 2018                                                      Mar 2019                                  Nov 2019

     YE 2017                Apr-Sep 2018                                 Sep-Oct 2018                                                             Jul 2019               Current

  ➢ Bahram Akradi named Chairman of the Board              ➢ Consummate Salt Creek, Pivotal,            ➢ Announced record 4th quarter and           ➢ Completes major Consent
  ➢ Announce Unsecured Notes due 2020                        and W acquisitions totaling                  full year 2018 results, intentions to        and Tender Process,
    exchanges into Secured Notes due 2023 and                approximately $500mm                         pursue a recapitalization of the             increases RBL to $800mm,
    common equity                                          ➢ Largely funded via equity                    Second Lien Notes during 2019, and           retires $348mm of Notes,
  ➢ Announce incremental common equity                                                                    1.0x-2.0x long term leverage target          Creates Preferred Structure
    offering for pursuit of accretive acquisitions
    and funding organic growth

                                                                                                                                                                                          10
NORTHERN’S SENIOR MANAGEMENT TEAM
                                                                                                                                                       NYSE American: NOG
       Nicholas O’Grady: Chief Executive Officer
       ➢ Nicholas O’Grady has served as Chief Executive Officer since January 2020, following ~18 months as the Company’s Chief Financial Officer. Mr. O’Grady leads the
           Northern team in all respects of the business, including investments, financial management and business strategy. He has nearly two decades of finance
           experience, both as an investment banker and as a principal investor. Mr. O’Grady began his career in the Natural Resources investment banking group at Bank
           of America, later moving to the hedge fund industry, with roles at Highbridge Capital Management and Hudson Bay Capital Management.
       Adam Dirlam: Chief Operating Officer
       ➢ Adam Dirlam has served as Chief Operating Officer since January 2020 following roles as Executive Vice President - Land & Operations since May 2018, Senior
          Vice President of Land & Operations since 2013 and various other roles upon joining the Company in 2009. Mr. Dirlam leads the M&A and capital allocation
          efforts. Prior to Northern, Mr. Dirlam served in various finance and accounting roles for Honeywell International.

       Chad Allen: Chief Financial Officer
       ➢   Chad Allen has served as Chief Financial Officer since January 2020 following roles as Chief Accounting Officer since August 2016 and Corporate Controller upon
           joining the Company in August 2013. He was also interim CFO from January-May 2018. Mr. Allen leads all accounting, financial and public company related
           functions. Prior to joining Northern, Mr. Allen was in the audit practice with Grant Thornton LLP from 2010 to 2013, and in the audit practice at McGladrey &
           Pullen, LLP from 2004 to 2010.
       Erik Romslo, Chief Legal Officer and Secretary
       ➢ Erik Romslo has served as Chief Legal Officer since January 2020 after joining the Company as General Counsel and Secretary in October 2011 and being named
            Executive Vice President in January 2013. Mr. Romslo oversees all legal, regulatory and SEC related matters as Chief Legal Officer, and facilitates all Board
            functions as Secretary. Prior to joining the Company, Mr. Romslo practiced law in the Minneapolis office of the Company’s outside counsel, Faegre Drinker
            Biddle & Reath LLP (formerly Faegre & Benson LLP), from 2005 until 2011, in which he was a member of the Corporate group.
       Jim Evans: Senior Vice President of Engineering
       ➢ Jim Evans was named Senior Vice President of Engineering in January 2020 following roles as Vice President of Engineering since June 2018 and Reservoir
            Engineering Manager since 2015. Mr. Evans oversees all aspects of Northern’s engineering process, including the valuation of properties, reserves and
            production forecasting. He began his career as a Reservoir Engineer with Cabot Oil & Gas, overseeing the reserves and development planning for the Green River
            Basin, and has also held roles at Cornerstone Natural Resources and Fidelity Exploration.
       Mike Kelly, CFA: Executive Vice President of Finance
       ➢ Mike Kelly joined the Company as Executive Vice President of Finance in January 2020. Mr. Kelly plays an integral role in Northern’s investment and acquisition
           process, financial planning and investor strategy as EVP of Finance. He joined from Seaport Global Securities, where he was a Partner and Head of E&P Research
           covering over 30 companies in the exploration and production sector since 2011. Prior to that, he spent over five years working as an energy analyst for Kennedy
           Capital Management in St. Louis.
                                                                                                                                                                              11
MGMT. ALIGNED WITH STAKEHOLDERS LIKE NO OTHER E&P
                                                                                                                                     NYSE American: NOG
 ➢ Northern is focused on what it means to be accountable

                    TYPICAL E&P PEER                                                        NORTHERN

       • $3.00 Cash G&A per Barrel                                                   ✓ ~$0.95 per boe Cash G&A in Q1 ’20
       • Insider & Management Ownership of ~5.0%                                     ✓ Insider and Management Ownership of ~30%
       • Stock only a portion of Incentive Compensation                              ✓ Stock is 100% of Incentive Compensation
       • Executive Officer Incentive Cash Comp of peer                               ✓ Executive Officer Incentive Cash Comp is $0
         set averages >90% of Salary

       Typical Incentive Targets:                                                    Northern’s Incentive Targets:
       • Compensation given in % of targets reached                                  ✓ Targets must be met or incentive compensation is forfeited
       • Relative Performance to hand-selected peer set                              ✓ 50% Absolute Stock Performance top tier target at double
       • Production growth regardless of returns                                       average returns for S&P 500
                                                                                     ✓ 50% Debt-adjusted cash flow per share growth targets
                                                                                       based on budget

1.   Based on peer set company data including, OAS, CPE, GPOR, SRC, CRZO, XOG, HPR                                                                  12
BENEFITS OF NORTHERN’S NON-OPERATOR MODEL
                                                                                                                 NYSE American: NOG

                                                LEVERAGING EXPERIENCE
                                           Proprietary Northern database, built from
                                           participation in over 6,500 wells, 40%+ of all
                                           Bakken and Three Forks wells drilled play to data

     CAPEX CONTROL
     Ability to increase and                                                                   CAPITAL FLEXIBILITY
     decrease capital quickly                                                                   Northern retains absolute
                                                                                                flexibility to manage
     Costs limited to drilling and                                                              capital allocation
     acreage only

                           COST & MARGIN                                         SCALABILITY
                                Peer leading cost                                 Only 24 full-time
                                structure & ROCE                                  employees

                                                                                                                                13
THE NON-OPERATOR MODEL
                                                                                                                              NYSE American: NOG

          CAPITAL BENEFITS                                                                 COST BENEFITS

          Ability to increase and decrease capital quickly                                    Only 24 full-time employees
 ✓ No rig or drilling contracts, no embedded personnel at the field level             ✓   Virtually unchanged despite doubling of
 ✓ Non-consent process allows us to cut drilling expenditures as returns dictate          production base in 2018
 ✓ Decision to drill, given our significant liquidity, is purely economic
                                                                                               Peer leading cost structure
                Costs limited to drilling and acreage
                                                                                      ✓   2019 ROCE of 16.3% is the best in the E&P space
 ✓   No material joint-operating agreements (“JOA”s)
                                                                                      ✓
NYSE American: NOG

I.   1-PAGER, VALUE PROPOSITION, & RECENT EVENTS
II. COMPANY OVERVIEW
III. BALANCE SHEET & HEDGES
IV. ASSET & ENGINEERING REVIEW
V. GROWTH STRATEGY- ORGANIC & M&A
VI. APPENDIX: SUPPLEMENTAL INFO
Q4/Q1 BALANCE SHEET MOVES: REDUCED DEBT & INT. COST
                                                                                                                                                                                      NYSE American: NOG

                               Balance Sheet Improvement                                                                                  Maturity Schedule ($MM)
                                                                                                                                     Key Takeaways:
                      9/30/19                                                                             3/31/20         $1,200    ✓ 50%+ reduction of highest cost, most
                    Total Debt                                                                       Total Debt                        restrictive debt; covenants relaxed                   $210
                                                            ($97MM)
                   $1,144MM                                                                        $1,047MM               $1,000    ✓ 88% increase in revolver, extended
                                                                                                                                       maturity
                Borrowing Base                                                                Borrowing Base                                                                                 $590
                                                                                                                                    ✓ Improved hedging capabilities
                    $425MM                                  ($111MM)
                                                            +$375MM                                 $800MM                 $800
                                                                                                                                    ✓ Some capital shifted to perpetual
                                                                                                                                   1/3 equity
                 Total Liquidity                                                                 Total Liquidity           $600     ✓ $90MM of 2nd Lien Debt retired in Q1
                    $100MM                                  +$119MM                                $219MM                           ✓ Additional $30.2 MM of 2nd Lien Debt
                                                                                                                    1/3    $400        retired thus far in Q2
             Equity/Book Value                                                              Equity/Book Value
                                                                                                                                                                                             $321
                                                             +$495MM                             $1,009MM                  $200
                    $514MM
                                                                                                                                                          $65              $65
                                                                                                                             $0
             Net Debt/EBITDA(1)                                                              Net Debt/EBITDA(1)
                                                                  (0.2x)                                                                2020             2021             2022               2023
                          2.5x                                                                            2.3x                 Sr. Unsecured Notes   Sr. Secured Notes   Sr. Secured CF   Availability

(1) Figures based on Adjusted LTM EBITDA, a non-GAAP financial metric. See appendix for reconciliation.                                                                                                  16
MAJORITY OF PRODUCTION HEDGED THROUGH 2021
                                                                                                                                                                                      NYSE American: NOG
 ➢ Northern continues to execute a strategy built around the safeguard of returns during a commodity down-cycle, while
   retaining flexibility to capture the opportunistic upside
                       CRUDE OIL DERIVATIVE PRICE SWAPS                                                    NATURAL GAS DERIVATIVE PRICE SWAPS

                                                                                                                                                      Total Hedged
                                Contract         Barrels Per Day    Total Hedged    Weighted Average Price Contract   Million British Thermal Units                  Weighted Average Price
                                                                                                                                                        Volumes
                                 Period             (Bbls/d)       Volumes (Bbls)          ($/Bbl)          Period         Per Day (mmbtu/d)                              ($/mmbtu)
                                                                                                                                                        (mmbtu)
                   2020:           Q2                 28,223         2,568,278              57.67            Q2                  4,945                  450,000              $2.336

                                   Q3                 27,189         2,501,348              58.47            Q3                  15,000                1,380,000             $2.336

                                   Q4                 25,787         2,372,362              58.03            Q4                  15,000                1,380,000             $2.336

                               Avg./Total             27,062         7,441,988             $58.05                                11,673                3,210,000             $2.336

                 2021(1):           Q1                22,958         2,066,250             $56.18            Q1                  27,500                2,475,000             $2.425

                                   Q2                 20,450         1,860,958             $56.64            Q2                  22,500                2,047,500             $2.435

                                   Q3                 18,168         1,671,410             $54.12            Q3                  22,500                2,070,000             $2.435

                                   Q4                 18,071         1,662,506             $54.14            Q4                  22,500                2,070,000             $2.435

                               Avg./Total             19,893         7,261,124             $55.36                                23,733                8,662,500             $2.432

(1) See hedging disclosures in the back of this presentation.
                                                                                                                                                                                                     17
NYSE American: NOG

I.   1-PAGER, VALUE PROPOSITION, & RECENT EVENTS
II. COMPANY OVERVIEW
III. BALANCE SHEET & HEDGES
IV. ASSET & ENGINEERING REVIEW
V. GROWTH STRATEGY- ORGANIC & M&A
VI. APPENDIX: SUPPLEMENTAL INFO
DIVERSIFIED BASE & PARTNERED WITH BASIN LEADERS
                                                                                                             NYSE American: NOG
 ➢ Leverage to some of the best performing operators in the Williston Basin

                               % OF NET PRODUCING WELLS BY OPERATOR
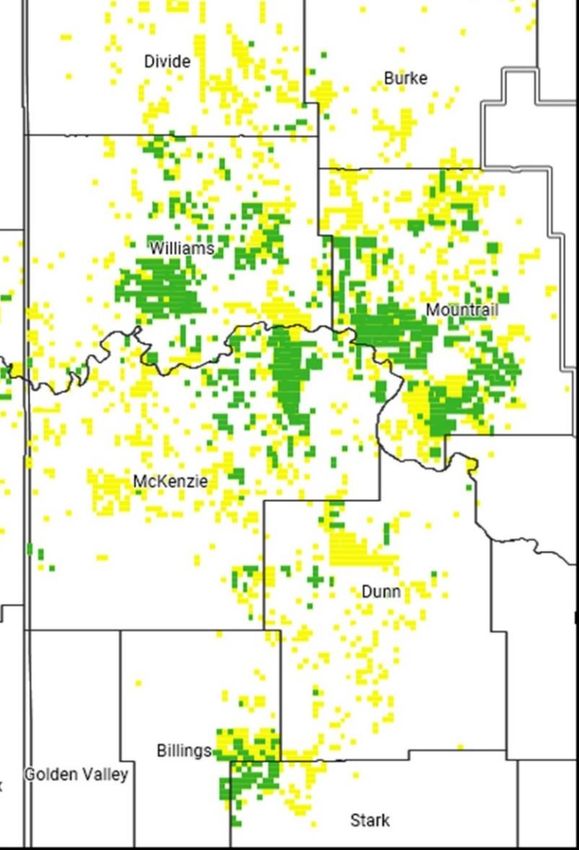
                       OTHERS (
2020 WELLS IN PROCESS ARE IN STRONG AREAS
                                                                                                       NYSE American: NOG
 ➢ The 2020 program is defined and focused in core areas
                                                                                Williston Basin Core

                       NOG’S DATA ADVANTAGE

                                                          NORTHERN HAS
                                40%                   PARTICIPATED IN ~40% OF
                                                       WELLS EVER DRILLED IN
                                                        THE WILLISTON BASIN

                                         HIGHLIGHTS
            ✓ Positive reserve performance adjustments
              in 4 of last 5 years
            ✓ Top-tier return on capital metrics

Sources: Company info, and North Dakota Industrial Commission                                                         20
OUR WELL PERFORMANCE REMAINS CONSISTENTLY STRONG
                                                                                                                                                                           NYSE American: NOG
 ➢ Completion technology and high-grading of well locations has led to improved well recovery across the basin

                                       NOG’s INCREASING WELL PRODUCTIVITY
                                                       2015 Cum (1)                                                                        HIGHER RECOVERIES + STABLE COSTS =
                                    280,000
                                                       2016 Cum (1)                                                    +80%                   IMPROVED CAPITAL EFFICIENCY
                                                       2017 Cum (1)
                                                       2018 Cum (1)
                                                                (1)
                                                       2019 Cum
                                    240,000            2020 Cum
                                                                (1)

                                                                                                                                                  Higher type-curves versus
                                    200,000                                                                                                           other US basins
             Cum Production (Boe)

                                    160,000

                                                                                                                                             2019 wells in-line with 2018 results…
                                    120,000

                                     80,000
                                                                                                                                              …despite more step-out wells in 2019
                                     40,000

                                         0
                                              -   30    60     90     120   150   180   210   240   270   300   330   360
                                                                                                                                   2020’s program looks as strong or stronger than 2019
                                                                              Days Online

1.   Wells assigned to years based on year in which they started producing. Cumulative type curves comprised of the following numbers of
     gross wells: 2015 – 296; 2016 – 162; 2017 – 291; 2018 – 479; 2019-460 ; 2020-98. Includes producing wells as of March 31, 2020.
                                                                                                                                                                                          21
STRONG UNDEVELOPED INVENTORY DRIVES NAV UPSIDE
                                                                                                                                    NYSE American: NOG
                      Undeveloped Locations By Operator                                        Undeveloped Locations By Reservoir
                                                                                                               TF3
                      OTHERS                      114.5                                                        41.7
                                  155.5
                                                                                                       TF2
                                                                                                      115.1
                           26.4                               88.0                                                    BKKN
                          28.1                                                                                        329.0
                           32.2
                                                              83.3                                      TF1
                             47.1                                                                      285.6

                                    60.7            74.1
                                           61.5

                      Undeveloped Locations By County                       Key Takeaways
                                                                     ✓ Over 60% of 771 future drilling locations controlled by strong
                                  OTHERS
                                                   MCKENZIE
                                                                       balance sheet companies such as Continental, Hess, Slawson, XTO,
                                   179.2
                                                    206.0              Petro-Hunt, and ConocoPhillips
                           DUNN
                            56.3                                     ✓ 77% of net locations in ‘Big 4’ counties
                              MOUNTRAIL            WILLIAMS
                                149.7               180.1            ✓ Conservative booking approach with minimal locations in lower
                                                                       bench Three Forks
Source: Company info – Undeveloped inventory as of 12/31/19
                                                                                                                                                   22
NYSE American: NOG

I.   1-PAGER, VALUE PROPOSITION, & RECENT EVENTS
II. COMPANY OVERVIEW
III. BALANCE SHEET & HEDGES
IV. ASSET & ENGINEERING REVIEW
V. GROWTH STRATEGY- ORGANIC & M&A
VI. APPENDIX: SUPPLEMENTAL INFO
NORTHERN’S CORE GROWTH THESIS IS SUSTAINABLE
                                                                                                                       NYSE American: NOG

       Northern’s goal is to leverage its strong financial position to counter-cyclically invest in
     acreage and drilling opportunities across the Williston Basin during volatile pricing periods

  ▪ Northern’s unique non-op model affords us the flexibility to grow the company through both organic
    growth (‘Ground Game’) and conventional acquisitions
  ▪ Northern has executed over 200 transactions since 2018, worth >$850mm in total value

                                                                         Production and Transactions by Year
                    NON-OP                                        140                                                    45,000
                                                                                                                         40,000
                                                                  120
                 CONSOLIDATION                                    100
                                                                                                                         35,000
                                                                                                                         30,000
                                                                   80                                                    25,000

                                                                   60                                                    20,000

   ORGANIC                                                         40
                                                                                                                         15,000

                                     ACQUISITIONS                  20
                                                                                                                         10,000

   GROWTH                                                          -
                                                                                                                         5,000
                                                                                                                         -
                                                                          2017                2018         2019
                                                                                 Annual Production   Number of Transactions

                                                                                                                                      24
ORGANIC GROWTH DRIVES OPPORTUNITY SET…
                                                                                                NYSE American: NOG

        ORGANIC GROWTH                              GROUND GAME WORKING INTEREST ADDITIONS

   GROWTH IN EXISTING POSITIONS…                           UPSTREAM BACKDROP PROVIDES
                                                             STRATEGIC OPPORTUNITIES
   ▪ Flow of inbound AFEs
   ▪ Incremental opportunities to proactively       ✓ Forced Sellers: AFE burdens lead to
     source additional working interests              undercapitalization
   ▪ Quickly source and assimilate interests from   ✓ Proactive Sourcing: Opportunistic acquisitions
     others needing to non-consent wells              across the region
                                                    ✓ Strong Relationships: Leveraging networks for deal
                                                      flow
                                                    ✓ Lack of Buyer Competition: Limited buyer set
                                                      creates “buyer’s market”

                                                                                                               25
…WHILE ACQUISITIONS BUILD SCALE
                                                                                                          NYSE American: NOG

           ACQUISITIONS

  …ACQUISITIONS LEVER STRONG PARTNERSHIPS
  ▪ Non-operator is natural consolidator
  ▪ Not bound to contiguous or concentrated acreage
  ▪ Proprietary database facilitates well analysis
  ▪ >$850mm+ of corporate M&A since 2018
  ▪ Broader Williston coverage vs. any operator

                                                      2018/19 large acquisitions   2018/2019 organic acreage
                                                                                                                         26
2020 A&D OPPORTUNITY SET GROWING
                                                                                   NYSE American: NOG

 The landscape for both ground-game acquisitions and
 corporate transactions has been consistently growing
             with asset quality increasing
Unprecedented ability to partner, provide capital and source core opportunities:

      ➢   Working Interest carve-out with ability to control completion timing
      ➢   Operators no longer have budget for OBO working interests
      ➢   Credit facility redeterminations will result in forced asset sales
      ➢   Smaller non-operators wanting and needing to consolidate

     Estimated >$5 billion of acquisition opportunities in Williston Basin
     across private equity, operators, family offices and mineral owners

                                                                                                  27
NYSE American: NOG

VI: APPENDIX
HISTORICAL OPERATING & FINANCIAL INFORMATION
                                                                                                                                                                                                                 NYSE American: NOG

          HISTORICAL OPERATING INFORMATION                                                               YEAR ENDED DECEMBER 31,                                                             THREE MONTHS ENDED,
                                                                               2014             2015              2016             2017             2018             2019                March 31, 2019           March 31, 2020
          PRODUCTION
          Oil (MBbls)                                                                 5,150.9          5,168.7           4,325.9          4,537.3          7,790.2            11,325.4                 2,541.2               3,138 4
          Natural Gas and NGLs (Mmcf)                                                 3,682.8          4,651.6           4,026.9          5,187.9          9,224.8            16,590.8                 3,435.8               5,049.1
          Total Production (Mboe)                                                     5,764.7          5,944.0           4,997.1          5,402.0          9,327.6            14,090.5                 3,113.9               3,979.9
          REVENUE
          Realized Oil Price, including settled derivatives ($/bbl)              $     77.70      $     68.94       $     49.44      $     45.92     $      57.78         $     54.66              $    53.58            $     47.11
          Realized Natural Gas and NGL Price ($/Mcf)                                    6.38             1.60              1.82             3.74             4.74                1.60                    2.64                   2.75
          Total Oil & Gas Revenues, including settled derivatives (millions)           423.7            363.7             221.2            227.7            471.0               601.2                   145.2                  161.7
          Adjusted EBITDA (millions)(1)                                                309.6            277.3             148.5            144.7            349.3               454.2                   104.8                  108.0
          KEY OPERATING STATISTICS ($/Boe)
          Average Realized Price                                                 $ 73.51          $ 61.19           $ 44.27          $ 42.16         $      50.50          $ 45.82                 $ 46.64                   $ 40.63
          Production Expenses                                                       9.66             8.77              9.14             9.21                 7.15             8.44                    7.92                      9.38
          Production Taxes                                                          7.58             3.63              3.10             3.81                 4.86             4.10                    4.02                      2.99
          General & Administrative Expenses-Cash                                    2.57             2.15              2.31             2.38                 1.15             1.11                    1.06                      0.95
          Total Cash Costs                                                       $ 19.81          $ 14.55           $ 14.55          $ 15.40         $      13.16          $ 13.65                 $ 13.00                   $ 13.32
          Operating Margin ($/Boe)                                               $ 53.70          $ 46.64           $ 29.72          $ 26.76         $      37.34          $ 32.17                 $ 33.64                   $ 27.31
          Operating Margin %                                                       73.1%            76.2%             67.1%            63.5%                73.9%            70.2%                   72.1%                    67.2%

          HISTORICAL FINANCIAL INFORMATION ($'S IN
          MILLIONS)
                                                                               2014             2015              2016             2017             2018             2019                March 31, 2019           March 31, 2020
          ASSETS
          Current Assets                                                         $   226.0        $     128.8       $      46.9      $     152.8     $   228.4            $   133.0           $          126.5                 354.8
          Property and Equipment, net                                              1,761.9              589.3             376.2            473.2       1,202.7              1,748.6                    1,240.7               1,773.8
          Other Assets                                                                38.8               15.8               8.4              6.3          72.5                 23.8                       28.6                 108.7
          Total Assets                                                           $ 2,026.7        $     733.9       $     431.5      $     632.3     $ 1,503.6            $ 1,905.4           $        1,395.8               2,237.4
          LIABILITIES
          Current Liabilities                                                    $   285.7        $   78.1          $   77.4         $  123.6        $   231.5            $      203.5         $         226.1            $ 234.9
          Debt                                                                       806.1           847.8             832.6            979.3            830.2                 1,118.2                   839.2               975.3
          Other Long-Term Liabilities                                                164.0             5.6               8.9             20.2             12.0                    25.1                    17.7                18.2
          Stockholders' Equity (Deficit)                                             770.9         (197.6)           (487.4)          (490.8)            429.9                   558.6                   312.8             1,009.0
          Total Liabilities & Stockholders' Equity (Deficit)                     $ 2,026.7        $ 733.9           $ 431.5          $ 632.3         $ 1,503.6       $         1,905.4         $       1,395.8          $ 2,237.4
          CREDIT STATISTICS
          Adjusted EBITDA (Annual, Q1 2019/20 annualized)                        $     309.6      $     277.3       $     148.5      $     144.7     $      349.3     $          454.2         $        419.0            $     432.0
          Net Debt                                                               $     796.8      $     831.9       $     826.1      $     877.1     $      832.7              1,111.7                  840.3                1.039.0
          Total Debt                                                             $     806.1      $     835.3       $     832.6      $     979.3     $      835.1              1,127.7                  843.9                1,047.5
          Net Debt/Adjusted EBITDA                                                      2.6x             3.0x              5.6x             6.1x             2.4x                 2.4x                   2.0x                   2.4x
          Total Debt/Adjusted EBITDA                                                    2.6x             3.0x              5.6x             6.8x             2.4x                 2.5x                   2.0x                   2.4x

1.   Adjusted EBITDA is a non-GAAP measure. See reconciliation on the slide that follows.                                                                                                                                              29
NON-GAAP RECONCILIATIONS: EBITDA & OTHER
                                                                                                                                                                                               NYSE American: NOG
               ADJUSTED EBITDA BY YEAR (IN THOUSANDS)
                                                                        2015                 2016                2017                   2018                 2019
               Net Income (Loss)                                        $       (975,355)    $       (293,494)       $        (9,194)       $    143,689         $        (76,318)
                Add:
                  Interest Expense                                                 58,360              64,486                 70,286               86,005                  79,229
                  Income Tax Provision (Benefit)                                (202,424)              (1,402)                (1,570)                 (55)                       -
                  Depreciation, Depletion, Amortization and Accretion             137,770              61,244                 59,500              119,780                 210,201
                  Impairment of Oil and Natural Gas Properties                  1,163,959             237,013                       -                    -                   6,398
                  Non-Cash Share Based Compensation                                 6,273                3,182                  6,107               3,876                    7,955
                  Write-off of Debt Issuance Costs                                      -                1,090                     95                    -                 23,187
                  Loss on the Extinguishment of Debt                                    -                    -                    993             173,430                  (1,390)
                  Debt Exchange Derivative Loss (Gain)                                  -                    -                      -                 598                  29,512
                  Contingent Consideration Loss (Gain)                                  -                    -                      -              28,968                    1,447
                  Financing Expense                                                     -                    -                      -                 884                      759
                  Unrealized (Gain) Loss on Derivatives                            88,716              76,347                 18,443            (207,891)                 173,214
               Adjusted EBITDA                                           $        277,299     $       148,466            $   144,660        $     349,283            $    454,193

               ADJUSTED EBITDA BY QUARTER (IN THOUSANDS)
                                                                        4Q18                 1Q19                2Q19                   3Q19                 4Q19                     1Q20
               Net Income (Loss)                                            $    218,292      $      (107,162)   $            44,399    $          94,381        $       (107,937)             368,286
                Add:
                  Interest Expense                                                 20,057              19,548                  17,778              21,510                  20,393                16,551
                  Income Tax Provision (Benefit)                                      (55)                   -                      -                   -                        -                (166)
                  Depreciation, Depletion, Amortization and Accretion              48,295              45,134                  46,091              55,566                  63,411                61,809
                  Impairment of Other Current Assets                                     -                   -                  2,695               5,275                  (1,571)                    -
                  Non-Cash Share Based Compensation                                 1,903                2,751                  1,643               (114)                    3,674                1,079
                  Loss on the Extinguishment of Debt                               73,055                    -                    425                   -                  22,762                 5,527
                  Debt Exchange Derivative Gain                                    13,661              (6,287)                  4,873                  23                        -                    -
                  Contingent Consideration Loss (Gain)                             28,968              (1,392)                 24,763               5,262                      879                    -
                  Financing Expense                                                   884                    -                      -                   -                    1,447                    -
                  Unrealized (Gain) Loss on Derivatives                         (280,195)             152,169                (31,857)            (57,506)                 110,408             (345,075)
               Adjusted EBITDA                                              $     124,865        $    104,761        $       110,810        $    124,396             $    114,225               108,010

               Other Non-GAAP Metrics by Quarter (IN THOUSANDS)
                                                                        4Q18                 1Q19                2Q19                   3Q19                 4Q19                     1Q20
               Cash General and Administrative Expense                   $          3,073     $         3,299    $             3,607    $           4,319    $               4,443    $           3,792
                Non-cash General and Administrative Expense                         1,903               2,751                  1,643                (114)                    3,674                1,079
                  Total General and Administrative Expense               $          4,976     $         6,050    $             5,250    $           4,206    $               8,117    $           4,871

                 Net Production (Boe)                                               3,336               3,114                  3,182                3,752                    4,043                3,980
                 Cash General and Administrative Expense per Boe        $            0.92    $           1.06    $              1.13    $             1.15                    2.01    $            0.95
                 Non-cash General and Administrative expense per Boe    $            0.57    $           0.88    $              0.52    $           (0.03)                    0.91    $            0.27

                 Total Principal Balance on Long-term Debt               $       835,140      $       843,878    $           861,491    $       1,145,491    $           1,127,733        $   1,047,489
                 Less: Cash and Cash Equivalents                                  (2,358)              (3,944)                (2,794)              (1,901)                 (16,068)              (8,512)
                 Net Debt                                                $       832,782      $       839,934    $           858,697    $       1,143,590    $           1,111,665        $   1,038,977

Note: Adjusted EBITDA is a non-GAAP measure
                                                                                                                                                                                                              30
NON-GAAP RECONCILIATIONS: ROCE & RECYCLE RATIO
                                                                                                                                        NYSE American: NOG

                      2019 Return on Capital Employed (ROCE)
                                                                                           • EBIT: $244MM
                                                                                               • + Adj. EBITDA: $454MM
                                               Capital                                         • - DD&A: $210MM
                  EBIT                ÷       Employed
                                                                         =         16.4%
                                                                                           • Capital Employed: $1,487 MM (2018-19 Avg)
                                                                                               • + Total Assets: $1,705MM (Avg.)
                                                                                               • - Current Liabilities: $218MM (Avg.)

                      Q1’20 Recycle Ratio

                                                                                            • Cash Margin: $27.31/boe
                Cash                              DD&A                                          • + Realized avg. commodity price: $40.63/boe
               Margin                 ÷            Rate
                                                                         =         1.8x         • - Cash Costs: $13.32/boe(1)
                                                                                            • DD&A Rate: $15.53/boe

(1) Incorporates Adjusted Cash G&A of $0.95, which excludes severance costs
Note: Adjusted EBITDA is a non-GAAP measure. Numbers may be off due to rounding.
                                                                                                                                                       31
SALT CREEK & PIVOTAL ACQUISITIONS
                                                                                                                                                       NYSE American: NOG

              Salt Creek Oil & Gas Acquisition Overview                                        Pivotal Petroleum Acquisition Overview

                            ▪ 6MM shares issued at closing                                                   ▪ 25.75MM shares issued at closing
  Acquisition Price:                                                               Acquisition Price:
                            ▪ $44.7MM cash                                                                   ▪ $68.4MM Cash

                            ▪ Effective January 1, 2018                                                      ▪ Effective June 1, 2018
  Timeline:                                                                        Timeline:
                            ▪ Closed June 4, 2018                                                            ▪ Closed September 17, 2018

                            ▪ Williston Basin/ Bakken                                                        ▪ Williston Basin
  Location:                                                                        Location:
                            ▪ Primarily McKenzie, Mountrail, and ND                                          ▪ Bakken and Three Forks

  Operators:                ▪ Key operators include: HES, WLL, and Slawson         Operators:                ▪ Key operators include: CLR, EOG, WLL, and COP

  Acreage:                  ▪ 1,319 net acres (in McKenzie & Mountrail counties)   Acreage:                  ▪ ~400 net acres (McKenzie, Dunn, & Mountrail counties)

                            ▪ 5.5 net (64 gross) PDP wells                                                   ▪ 20.8 net (334 gross) PDP wells
                                                                                   Wells:
  Wells:
                            ▪ 1.5 net (31 gross) PDNP wells                                                  ▪ 2.2 net (31 gross) PDNP wells

  Undrilled Locations:      ▪ 8.2 net (137 gross) with EURs at 1.0MMboe            Undrilled Locations:      ▪ 2.3 net (36 gross)

  Production:               ▪ 1,380 boe/d production at acquisition                Production:               ▪ 4,100 boe/d production at acquisition

                                                                                                                                                                       32
FLYWHEEL ENERGY: ACQUISITION SUMMARY
                                                                                                                                                                   NYSE American: NOG
                               Flywheel Energy Acquisition Overview

                                                    ▪ Northern to acquire Williston Basin properties of VEN Bakken, LLC (“Seller”), a wholly-owned subsidiary of Flywheel
                                                      Bakken, LLC (formerly Valorem Energy), (“Flywheel”)
                                                             ▪ 6,600+ Boe/d (2-Stream) estimated production for 2H19
                                                             ▪ ~18,000 net acres in the core of the Williston Basin (100% Held-by-Production)
                                                             ▪ 86.9 net producing wells, 2.7 net wells in process, 47.5 net undeveloped locations
                                                             ▪ Estimated Proved Developed PV-10 alone represents $236.9mm at current strip(1)
                                                             ▪ Asset decline profile reduces Northern’s corporate average
                                                    ▪ $165mm in cash to Seller
                                                    ▪ $130mm in 3-Year Senior Unsecured Note issued to Seller, bearing 6.0% Interest
                       CONSIDERATION
                                                    ▪ Approximately 5.6mm shares of common stock to Seller (one year lock-up)
                                                    ▪ Northern assuming Flywheel’s hedge book

                          VALUATION                 ▪ Approximately 3.5x 2H 2019E annualized unhedged cash flow

                          OWNERSHIP                 ▪ Flywheel is a portfolio company of the Kayne Private Energy Income Funds

                          OPERATORS                 ▪ Newfield Exploration (Encana), Conoco, Slawson, Hess, Whiting, Continental

                             TIMING                 ▪ Closing and effective date of July 1, 2019

1.   Strip WTI and NYMEX Oil and Gas Pricing as of 04/05/2019: WTI 2H 2019 $62.88, 2020 $60.17, 2021 $56.90, 2022 $54.75, 2023+ $53.80.
     PV-10 is a non-GAAP financial measure.                                                                                                                                       33
W ENERGY PARTNERS ACQUISITION
                                                                                                                                                                         NYSE American: NOG
                           Acquisition Overview
                                                                                                                                      First 12-Month Cumulative Oil Production(1)
                                               ▪ 51.4 MM shares
                Acquisition Price:
                                               ▪ $117.1 MM Cash
                                               ▪ Effective July 1, 2018
                Timeline:
                                               ▪ Closed October 1, 2018
                Acreage:                       ▪ 10,600 net acres (3.0% average WI)
                                               ▪ 27 net (910gross) PDP wells
                Wells:
                                               ▪ 6 net (170 gross) wells in progress
                Undrilled Locations:           ▪ 47 net (1,475 gross) total locations
                Production:                    ▪ 6,750 boe/d (75% oil, 25% gas) at close
                                               ▪ 7.8MMboe PDP reserves
                Reserves:
                                               ▪ $153MM PDP PV10 (8/17/2018 strip)

                 Total Net Locations by Operator                         Gross Locations by Formation

                                                                       Middle                               Three Forks
                                 4.3                                   Bakken                                   2
                 Other           9%                                                                   327
                           5.0
                                                                                536                   22%
                           11%                 17.8
                                    Top 5                                       36%        1,475
                                  Operators    38%
                         5.3                                                            Total Gross
                         11%     Account for                                             Locations
                                    >80%
                           7.1                                                                  612
                           15%          7.7                                                     42%
                                        16%                                                                  Three Forks
                                                                                                                 1

(1) Includes horizontal Middle Bakken and Three Forks wells completed after January 1, 2008 with at least 12 months of production history.
(2) As of 8/24/18. Potential additional stock consideration if Northern’s stock price does not achieve certain targets over the 13 month lock-up period.                                34
HEDGING DISCLOSURES
                                                                                                                                                                                                                                 NYSE American: NOG
 Further Detail about Swap Transaction and Swaption Volumes
1.   The Company has entered into certain crude oil derivative contracts for 2021 volumes that give counterparties the option to extend such derivative contracts for additional six-month and twelve-month periods. Options covering a
     notional volume of 112,500 for Q1 2021 at $57.78 per barrel, 113,750 for Q2 2021 at $57.78 per barrel, 46,000 for Q3 2021 at $58.00 per barrel, and 46,000 for Q4 2021 at $58.00 per barrel are exercisable on December 31, 2020.
     720,875 barrels for CY 2022 at $55.00 per barrel, 365,000 barrels for CY 2022 at $54.70 per barrel, 452,500 barrels for 1H 2022 at $54.90 per barrel, 271,500 barrels for 1H 2022 at $54.59 per barrel, 182,500 barrels for CY 2022 at
     $56.00 per barrel, 182,500 barrels for CY 2022 at $55.80 per barrel, 182,500 barrels for CY 2022 at $43.00 per barrel, 181,000 barrels for 1H 2022 at $54.72 per barrel, 45,250 barrels for 1H 2022 at $57.50 per barrel are exercisable on
     December 31, 2021. 182,500 for CY 2023 at $43.00 per barrel are exercisable on December 31, 2022. If the counterparties exercise all such options, the notional volume of the Company’s existing crude oil derivative contracts will
     increase by these amounts for those respective periods in 2021 and 2022.

                                                                                                                                                                                                                                                   35
You can also read