Kenai Peninsula 2021- 2026 Comprehensive Economic Development Strategy - June 2021 Prepared by the University of Alaska Center for Economic ...
←
→
Page content transcription
If your browser does not render page correctly, please read the page content below
June 2021

   Kenai Peninsula 2021-
   2026 Comprehensive
  Economic Development
          Strategy
Prepared by the University of Alaska Center for Economic Development
for the Kenai Peninsula Economic Development District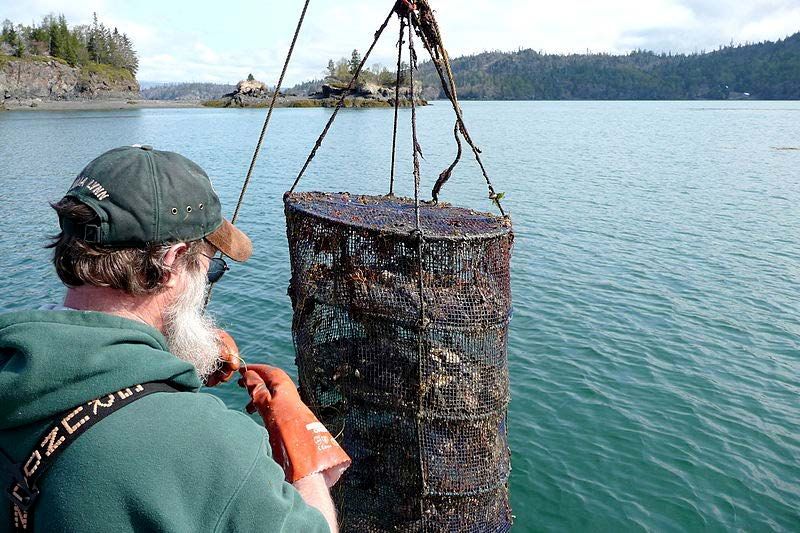
Table of Contents
I.     Introduction .......................................................................................................................................... 1
    Kenai Peninsula Economic Development District Overview ..................................................................... 1
    CEDS Strategy Committee......................................................................................................................... 1
    Process ...................................................................................................................................................... 2
II. Background ........................................................................................................................................... 3
    Geography and Climate ............................................................................................................................ 3
    Human Capital........................................................................................................................................... 5
    Cost of Living and Quality of Life ............................................................................................................ 16
    Infrastructure and Transportation .......................................................................................................... 25
    Key Industry Sectors................................................................................................................................ 28
III. SWOT Analysis .................................................................................................................................... 42
    Industries and Business Climate ............................................................................................................. 43
    Infrastructure .......................................................................................................................................... 46
    Human Capital......................................................................................................................................... 49
IV. Resiliency ............................................................................................................................................ 52
    Resiliency Threats ................................................................................................................................... 52
    Resiliency Action Plan ............................................................................................................................. 56
V. Goals ................................................................................................................................................... 59
VI. Action Plan .......................................................................................................................................... 60
VII. Appendix A: Business and Resident Survey Results............................................................................ 69
    Business Survey Results .......................................................................................................................... 69
    Resident Survey Results .......................................................................................................................... 77
VIII. Work Cited .......................................................................................................................................... 89

Table of Tables
Table 1: Population of Kenai Peninsula Communities. ................................................................................. 7
Table 2 Migration to/from Kenai Peninsula by Number of PFD Applications. ............................................. 9
Table 3: AVTEC Vocational Programs.......................................................................................................... 16
Table 4: KPB Housing Costs. ........................................................................................................................ 17
Table 5: KPB House Stock Quality. .............................................................................................................. 18
Table 6: Sample of Community Level Poverty Rates. ................................................................................. 21
Table 7: Distressed Communities in KPB. ................................................................................................... 21
Table 8: Electricity costs across KPB. .......................................................................................................... 23
Table 9: Fuel cost by source in KPB. ............................................................................................................ 24
Table 10: Kenai Peninsula Airports. ............................................................................................................ 27
Table 11: Resident survey responses, other reasons for living in KPB ....................................................... 80
Table 12: Missing Amenities and Services on the Kenai Peninsula from survey responses. ...................... 85

Kenai Peninsula 2021-2026 Comprehensive Economic Development Strategy                                                                                     Page i
UA CED & KPEDD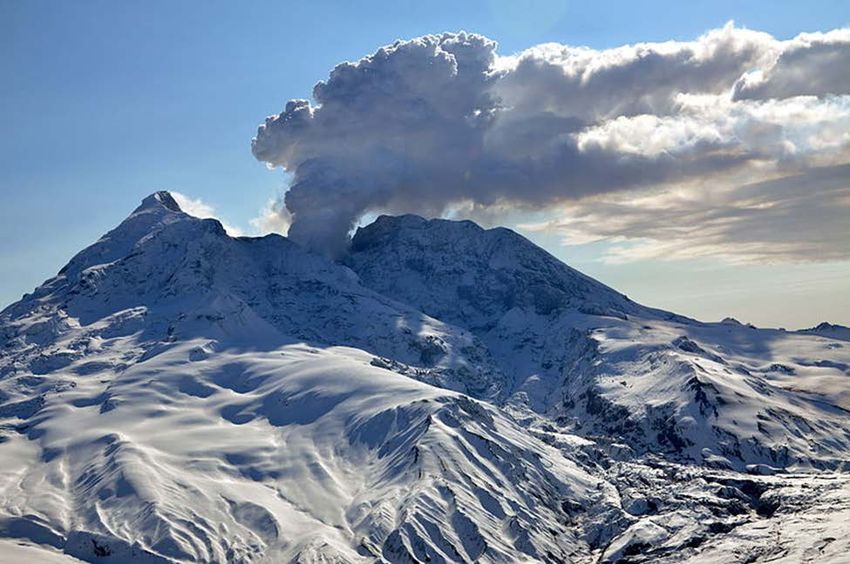
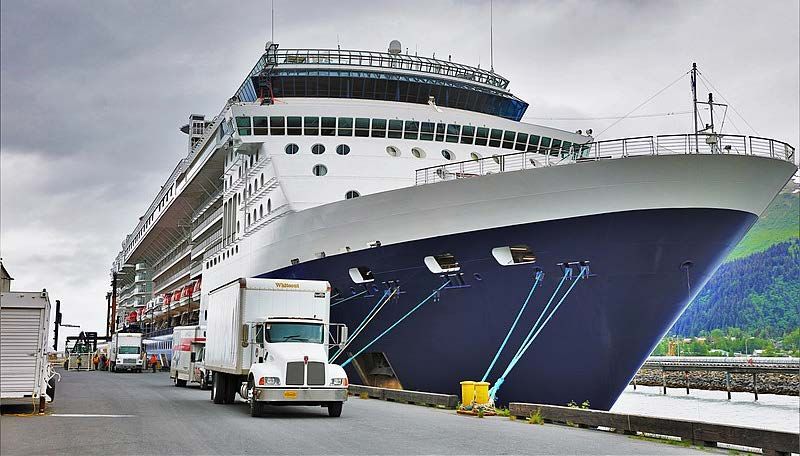
Table of Figures
Figure 1: Air miles between Anchorage and Borough Communities. ........................................................... 3
Figure 2: Total KPB population estimates. .................................................................................................... 5
Figure 3: Projected population of KPB. ......................................................................................................... 6
Figure 4: Migration to/from the Kenai Peninsula. ........................................................................................ 8
Figure 5: KPB population by Age Group........................................................................................................ 9
Figure 6: Projected economically active population vs. population over 65 in KPB................................... 10
Figure 7: Self-identified race as a percent of total population in KPB. ....................................................... 11
Figure 8: Monthly year-over-year employment change in KPB.................................................................. 12
Figure 9: Average annual employment in KPB............................................................................................ 12
Figure 10: KPB industry employment by 2 digit NAICS. .............................................................................. 13
Figure 11: Population of school-aged individuals in KPB. ........................................................................... 14
Figure 12: Kenai Peninsula Borough School District K-12 enrollment. ....................................................... 14
Figure 13: Projected KPB population under 19........................................................................................... 15
Figure 14: Enrollment at UAA Kenai Peninsula College. ............................................................................. 16
Figure 15: Percent of households considered cost burdened in KPB. ........................................................ 17
Figure 16: New housing units built in KPB. ................................................................................................. 18
Figure 17: Projected senior citizens per licensed senior facility bed in KPB. .............................................. 19
Figure 18: Average monthly wages in KPB, in real 2019 dollars. ................................................................ 20
Figure 19: Average annual unemployment rate in KPB and state of Alaska. ............................................. 20
Figure 20: DOD Overseas Cost of Living Adjustment index of select Kenai Peninsula communities. ........ 22
Figure 21: Kenai Peninsula electric utility cost compared to other urban Alaska utilities. ........................ 22
Figure 22: Weekly food cost for family of four in Kenai. ............................................................................ 23
Figure 23: Households with broadband access by type of access. ............................................................. 25
Figure 24: Total AMHS embarking and disembarking passengers at KPB ports. ........................................ 28
Figure 25: Gross weight of commercial salmon harvests in Upper and Lower Cook Inlet. ........................ 30
Figure 26: Boroughwide health care and social assistance industry taxable sales. ................................... 31
Figure 27: Average annual employment in the health care and social assistance industry. ...................... 32
Figure 29: Cook Inlet well locations. ........................................................................................................... 33
Figure 30: Cook Inlet Oil and Natural Gas Production. ............................................................................... 34
Figure 31: A cruise ship docked in Seward in 2019. Source:....................................................................... 35
Figure 32: KPB gross sales in visitor related business lines, in real 2019 dollars. ....................................... 37
Figure 33: Boroughwide agriculture production acreage. .......................................................................... 38
Figure 34: Boroughwide crop production revenues. .................................................................................. 39
Figure 35: Active aquatic farming operation on the Kenai Peninsula. ....................................................... 40
Figure 36: Oyster farming in Kachemak Bay. .............................................................................................. 41
Figure 37: Overview SWOT table ................................................................................................................ 42
Figure 38: Industries and business climate SWOT table. ............................................................................ 43
Figure 39: Infrastructure SWOT table. ........................................................................................................ 46
Figure 40: Kenai Municipal Airport. ............................................................................................................ 48
Figure 41: Human capital SWOT table. ....................................................................................................... 49
Figure 42: Employment change by sector from August 2019 to August 2020. .......................................... 53
Figure 43: Seismic activity in the Kenai Peninsula between April 17 and May 3, 2021.............................. 54

Kenai Peninsula 2021-2026 Comprehensive Economic Development Strategy                                                                     Page ii
UA CED & KPEDD
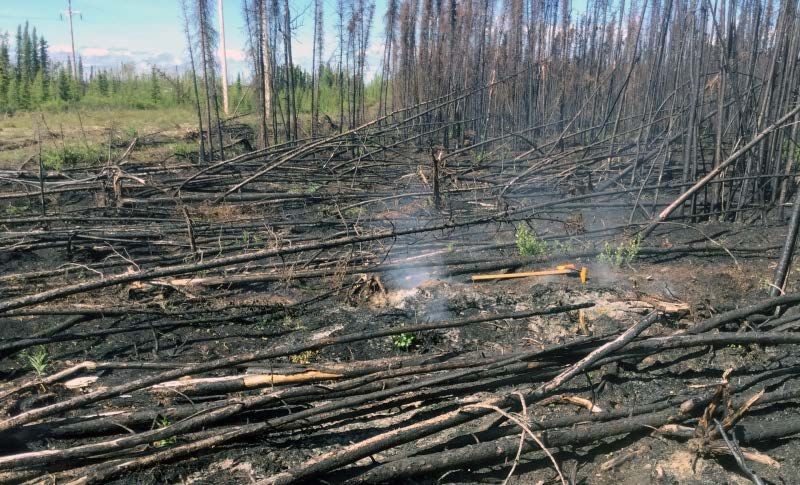
Figure 44: Remnants of the Swan Lake Fire, June 2019. ............................................................................ 55
Figure 45 Mt. Redoubt eruption, 2009. ...................................................................................................... 56
Figure 46: Responses by location to KPEDD CEDS business survey. ........................................................... 69
Figure 47: Business survey responses by industry. ..................................................................................... 70
Figure 48: Business respondent employment, current and peak season................................................... 71
Figure 49: Business Survey perceptions of the business climate in Alaska and the Kenai Peninsula. ....... 72
Figure 50: Perceptions of the economic outlook over the coming year, compared to the previous year. 72
Figure 51: Impacts of COVID on business survey respondents. ................................................................. 73
Figure 52: Workforce challenges experiences by business survey respondents. ....................................... 74
Figure 53: Perceptions of barriers to business growth experienced by business survey respondents. ..... 75
Figure 54: Business survey respondents’ reasons for locating on the Kenai Peninsula. ............................ 76
Figure 55: Perceptions on ways to improve business in the borough by survey respondents. ................. 77
Figure 56: Resident survey responses by location. ..................................................................................... 78
Figure 57: Resident survey responses by industry employment. ............................................................... 79
Figure 58: Resident survey respondent reasons for living on the Kenai Peninsula .................................... 80
Figure 59: Resident rankings of top reasons for living on the Kenai Peninsula. ......................................... 81
Figure 60: Likeliness to leave the Kenai Peninsula and drivers for leaving. ............................................... 81
Figure 61: Perceptions of challenges of living in the borough by resident survey respondents. ............... 82
Figure 62: Perceptions on threats to the borough economy by resident survey respondents. ................. 83
Figure 63: Priorities for infrastructure development in the borough by respondents. .............................. 85
Figure 64: Priorities for industry development in the borough by respondents. ....................................... 86
Figure 65: Positions on economic development options in the borough by respondents......................... 87

Kenai Peninsula 2021-2026 Comprehensive Economic Development Strategy                                                                Page iii
UA CED & KPEDD
I. Introduction
Kenai Peninsula Economic Development District Overview
The Kenai Peninsula Economic Development District (KPEDD) is a 501(c)(4) non-profit regional economic
development organization. Established in 1988, KPEDD serves the residents and communities of the
Kenai Peninsula Borough (KPB) in Southcentral Alaska.

As the first federal Economic Development District designated in Alaska, as well as the first Alaska
Regional Development Organization or ARDOR, KPEDD has actively pursued development opportunities
for the region. Over its lifetime, KPEDD has been involved in a variety of projects including public works
advocacy, shellfish industry development, international trade, promotion of a North Slope Natural Gas
Pipeline to Cook Inlet, building infrastructure, industry recruitment, and business retention and
expansion (BR&E).

KPEDD, with funding provided by the KPB and U.S. Economic Development Administration, compiles and
publishes the Kenai Peninsula Borough Comprehensive Economic Development Strategy (CEDS), and this
document represents the most recent update, replacing the previous 2016 document.

CEDS Strategy Committee
The KPEDD staff and the University of Alaska Center for Economic Development (UA CED) conducted the
CEDS process, under the general direction and guidance of the KPEDD Board of Directors. The board
consisted of the following individuals:

Current KPEDD Board Members:

    •   Todd Smith (Board President), Kenai;
    •   Bruce Richards (Vice-President), Soldotna;
    •   Bryan Zak, At-Large;
    •   Chris Hough, KPB At Large;
    •   John Czarnezki, City of Soldotna;
    •   Karin Marks, City of Homer;
    •   Rachel Friedlander, City of Seldovia;
    •   Sara Bieber, City of Kenai;
    •   Shawn Butler, Hope;
    •   Tim Redder, KPB At Large; and,
    •   Tyson Cox, City of Soldotna.

KPEDD Staff:

    •   Tim Dillon, Executive Director;
    •   Caitlin Coreson, Programs Manager;
    •   Cassidi Cameron, Special Projects Manager; and,
    •   Abby Dial, Administrative Assistant.

Kenai Peninsula 2021-2026 Comprehensive Economic Development Strategy                               Page 1
UA CED & KPEDD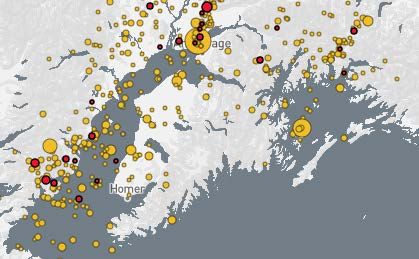
Process
The CEDS was developed in accordance with the U.S. Economic Development Administration’s
guidelines, with KPEDD Executive Director Tim Dillon overseeing its completion. UA CED conducted the
background research, coordinate the public process, facilitated the creation of the action plan, and
drafted the document itself. Wherever possible and practical, the Executive Director and Board
members participated in community forums and industry focus groups and provided extensive feedback
and input on various drafts of the document.

The relationship with the UA CED began in Fall 2020, with work continuing into the winter and then the
spring of 2021. Key milestones in the CEDS outreach include:

   •    October 2, 2020—KPEDD Board retreat;
   •    October 21,2020—State of Alaska ARDORS;
   •    October 29, 2020—Homer Rotary;
   •    November 13, 2020—Alaska Farm Bureau;
   •    January 6, 2021—KPEDD Industry Outlook Forum, Economic Future Forum;
   •    February 9, 2021—Homer Economic Development Commission;
   •    February 17, 2021—Kenai and Soldotna Chambers of Commerce joint luncheon;
   •    February 24, 2021—Soldotna City Council;
   •    March 1, 2021—Kenai Peninsula Borough School District Board;
   •    March 3, 2021—Kenai City Council;
   •    March 8, 2021—Seldovia City Council;
   •    March 10, 2021—Tyonek;
   •    March 22, 2021—Seward City Council;
   •    March 23, 2021—Seward Chamber of Commerce;
   •    March 30, 2021—Anchor Point Senior Center, Cooper Landing Chamber of Commerce, Hope
        Chamber of Commerce; Moose Pass Chamber of Commerce, Nanwalek Tribal Council, Nikiski
        Senior Center, Port Graham Tribal Council, and Seldovia Village Tribal Council;
    •   April 1, 2021—Seldovia Chamber of Commerce;
    •   April12, 2021—Homer City Council;
    •   April 13, 2021—Homer Chamber of Commerce;
    •   April 20, 2021—Kenai Peninsula Borough Assembly;
    •   May 14, 2021—Draft published for 30-day comment period;
    •   June 14, 2021—Comment period completed and draft finalized; and
    •   June 17, 2021—KPEDD Board approves final document.

Kenai Peninsula 2021-2026 Comprehensive Economic Development Strategy                           Page 2
UA CED & KPEDD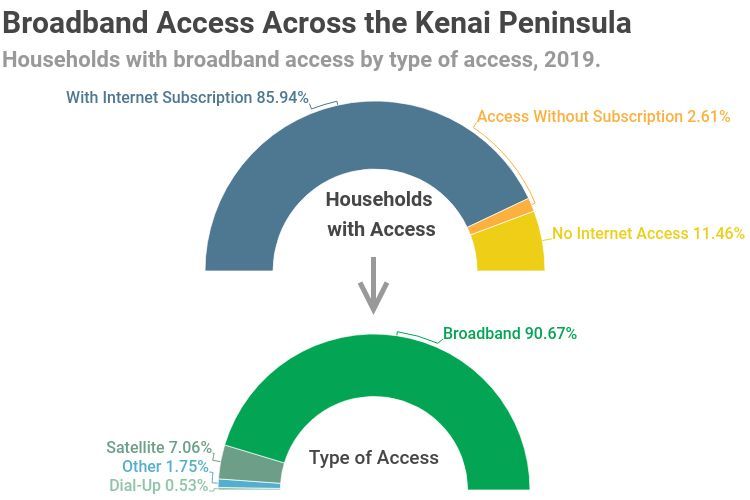
II. Background
Geography and Climate
KPB is 25,600 square miles, of which 15,700 square miles are land, 1 and 8,741 square miles are water. 2
The population per square mile is 3.8. The borough is roughly the size of New Jersey and Massachusetts
combined.

The borough is surrounded by Anchorage to the north, the Alaska Range to the west, the Gulf of Alaska
and Prince William Sound to the south and east. The Kenai Mountains run to the north and south of the
borough. The Cook Inlet runs in the center of the borough, creating two land masses. Approximately 99
percent of the population resides in the Peninsula, with the west side of the borough being sparsely
populated.

The borough’s 37 communities are connected by land, air, and ferry. KPB has 32 airports or landing
strips (discussed further in the infrastructure and transportation section). 3 The air miles from major
public KPB airports to Anchorage, the closest hub city, are as follows:

                  Kenai                          • 60 miles SW
                Soldotna                         • 55 miles SW
                                                                                      Anchorage
                 Homer                           • 119 miles SW
                 Seward                          • 75 miles SE
                Seldovia                         • 134 miles SW
Figure 1: Air miles between Anchorage and Borough Communities.
Source: State of Alaska Community Database Online.

The borough consists of diverse climates including: glacial rivers, mountain ranges, spruce forests, and
coastal fjords. Much of this diverse climate is part of national forests/parks within or adjacent to KPB
including:

    •    Chugach National Forest;
    •    Katmai National Park and Preserve;
    •    Kenai Fjords National Park;
    •    Kenai National Wildlife Refuge;
    •    Lake Clark National Park and Preserve; and,
    •    Kachemak Bay State Park.

The Kenai Peninsula is an active zone for earthquakes. The edge of the Pacific Plate passes through the
Gulf of Alaska, and is still quite active. The January 24th, 2016 4 and November 30, 2018 5 earthquakes
were centered in the Cook Inlet region. Both earthquakes were 7.1 magnitude. There are also volcanoes
in the Cook Inlet area.

Kenai Peninsula 2021-2026 Comprehensive Economic Development Strategy                                Page 3
UA CED & KPEDD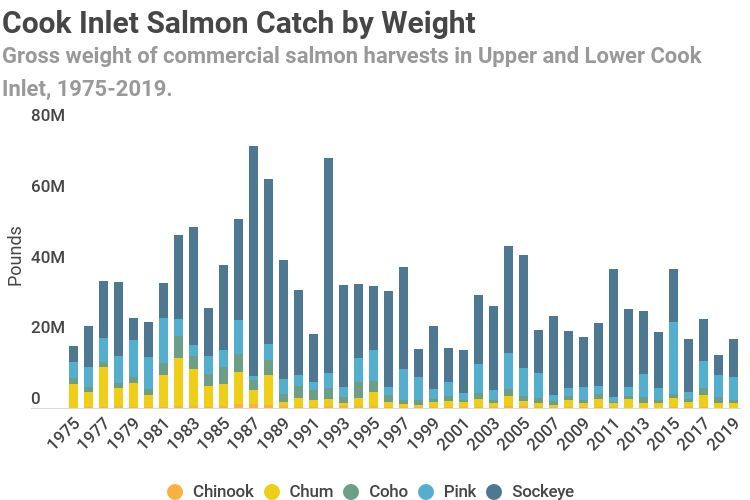
There are a plethora of waterways in the Borough, that support the extensive aquaculture economies.
Two important water habitats for wildlife are the Chickaloon River Flats, which is a major saltwater
estuary, and the Kenai National Wildlife Refuge. The refuge is drained by numerous waterways
including:

    •    Kenai River;
    •    Anchor River;
    •    Six Mile Creek;
    •    Fox River;
    •    Snow River;
    •    Chuitna River;
    •    Trail Creek;
    •    Palmer Creek;
    •    Chakachatna River; and,
    •    Rocky River.6

Climate
Winter
The Borough has relatively mild winters with the average temperature ranging from 4 – (-38) degrees
Fahrenheit (F). Winter is short by Alaskan standards lasting from December to February. The winter
season has far less sunlight, the shortest day of the year, December 20, has only 5 hours and 43 minutes
of sunlight. The average snowfall varies greatly based on location. The greatest average snowfall is in
Hope (89.5 inches), and the smallest average snowfall is in Nikiski (33 inches). Many other communities
in the Borough have average snowfalls more similar to Hope.

Spring
Spring is short, lasting from March until May. This is when the snow begins to melt, and the temperature
and amount of daylight are increasing. This is the time of year people use for harvesting, particularly of
perennial plants such as: fiddleheads, young marsh marigolds, and Devil’s club.

Summer
The summers are mild, with temperatures ranging from 46-70 degrees F. Summer lasts from June
through August, and is prime fishing season. The average precipitation ranges from a high of 66 inches in
Seward, to a low of 18 inches in Nikiski. Summer brings much more sunlight, the longest day of the year,
June 21st, has 17 hours and 4 minutes of daylight.

Fall
Beginning in September, as many of the tourists and sport fisherman have left, the level of precipitation
increases (when compared to the spring months). Many seasonal businesses close up for the winter. The
temperature begins to drop from an average high of 57 degrees F in September to an average high of 31
degrees F in November.

Kenai Peninsula 2021-2026 Comprehensive Economic Development Strategy                              Page 4
UA CED & KPEDD
Human Capital
Population and Age
An estimated 58,934 people lived in the KPB in 2020. From 2011 to 2020, population in the borough
increased on average 0.6 percent annually. 7 Although this population growth was modest over the
decade, it is noteworthy that it exceeded other parts of Alaska, including Anchorage.

Figure 2: Total KPB population estimates.
 Source: AKDOLWD, 2011-2020.

By the year 2045, the population is projected to grow by roughly 6 percent. This growth translates into a
projected 63,447 residents, which would suggest an average annual growth of 0.26 percent. After the
year 2030, population growth is expected to slow for both Alaska and the Kenai, but Peninsula growth
rates will decline more sharply than the state overall as the state should grow at an annual rate of 0.29
percent through 2045. 8

Kenai Peninsula 2021-2026 Comprehensive Economic Development Strategy                             Page 5
UA CED & KPEDD
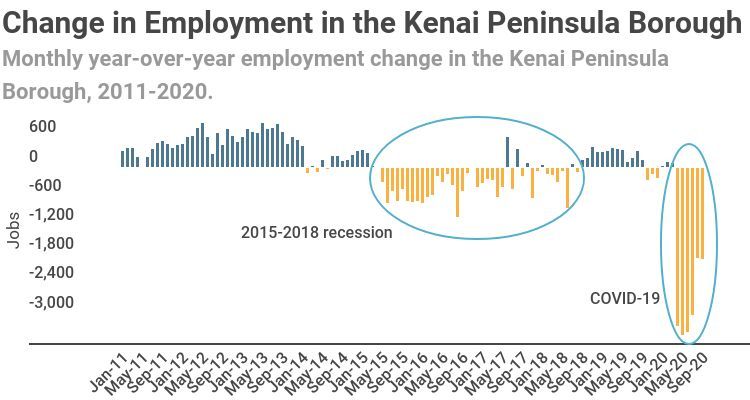
Figure 3: Projected population of KPB.
Source: AKDOLWD, 2015-2045.

At the community level, growth rates vary considerably. The bedroom communities of the Central
Peninsula, a highway accessible area that spans from Sterling to Kasilof, showed constant average
annual growth over the last decade This includes Ridgeway, Kalifornsky, and Salamatof, all located a
short drive from the commercial centers of Soldotna and Kenai. One exception to region-wide steady
growth was Seward, which lost population over the last decade.

The small coastal communities of the South Peninsula such as Ninilchik, Tyonek, and Seldovia were more
likely to see a shrinking population. Anchor Point, Clam Gulch, and Diamond Ridge, however, showed
steady annual growth. Highway access, buildable land, and proximity to an existing population center
seem to be the biggest predictors of growth. Point Possession, a remote area at the mouth of the
Swanson River, saw the most growth, although on a small scale. Over the last decade the Point
Possession’s population is estimated to have grown from a population of 3 in 2011 to 54 in 2020. 9

Kenai Peninsula 2021-2026 Comprehensive Economic Development Strategy                            Page 6
UA CED & KPEDD
Population of Kenai Peninsula Communities, 2020
 Community                                             Population     Average Annual Growth
                                                                                (2011-2020)
Kalifornsky                                                 8,701                       1.1%
Kenai                                                       7,096                       0.0%
Sterling                                                    6,094                       0.8%
Homer city                                                  5,513                       1.0%
Nikiski                                                     4,579                       0.2%
Soldotna city                                               4,236                       0.2%
Seward city                                                 2,509                      -0.7%
Fritz Creek                                                 2,246                       1.6%
Ridgeway                                                    2,188                       0.8%
Bear Creek                                                  2,145                       1.0%
Anchor Point                                                2,123                       1.0%
Cohoe                                                       1,548                       1.3%
Diamond Ridge                                               1,355                       1.7%
Salamatof                                                   1,157                       1.8%
Funny River                                                 1,071                       2.2%
Ninilchik                                                     826                      -0.6%
Fox River                                                     668                      -0.2%
Happy Valley                                                  659                       1.1%
Kasilof                                                       532                      -0.3%
Kachemak City                                                 529                       1.2%
Nikolaevsk                                                    294                      -0.8%
Cooper Landing                                                275                      -0.5%
Nanwalek                                                      273                       0.7%
Moose Pass                                                    246                       1.2%
Clam Gulch                                                    212                       2.0%
Hope                                                          211                       1.0%
Seldovia                                                      203                      -2.0%
Seldovia Village                                              191                       1.6%
Port Graham                                                   182                       0.3%
Tyonek                                                        150                      -1.2%
Lowell Point                                                   83                       0.4%
Primrose                                                       75                      -0.4%
Halibut Cove                                                   71                      -0.7%
Crown Point                                                    68                      -0.8%
Point Possession                                               54                    170.0%
Beluga                                                         24                       2.0%
Sunrise                                                        12                      -3.3%
Borough Total                                              58,934                       0.6%
Table 1: Population of Kenai Peninsula Communities.
Source: AKDOLWD, 2020.

In any region, there are two main components of population change: natural increase and net migration.
Natural increase is based on birth and death rates, while net migration reflects movement to and from

Kenai Peninsula 2021-2026 Comprehensive Economic Development Strategy                          Page 7
UA CED & KPEDD
the region. From 2016 to 2020 the population in KPB increased by 824 residents. Over this period, the majority of population growth was driven by natural increase. The region saw net out-migration from 2016 to 2019, with 2020 being the first year with strong in-migration. 10 Figure 4: Migration to/from the Kenai Peninsula. Source: AKDOLWD, 2011-2020. Of the 213 individuals who migrated to KPB in 2020, the majority migrated from out-of-state or the Anchorage Municipality. The flow of population out of the region primarily came from the same areas. 11 Kenai Peninsula 2021-2026 Comprehensive Economic Development Strategy Page 8 UA CED & KPEDD
Migration to/from Kenai Peninsula by Number of PFD Applications
 Community                                            In-migration                       Out-migration
 Outside Alaska                                               4,138                              3,547
 Anchorage Municipality                                         626                                509
 Matanuska-Susitna Borough                                      214                                251
 Fairbanks North Star Borough                                   113                                105
 Kodiak Island Borough                                           48                                 19
 Bethel Census Area                                              32                                 17
 Juneau City and Borough                                         31                                 30
 Ketchikan Gateway Borough                                       23                                 12
 Kusilvak Census Area                                            21                                 10
 Chugach Census Area                                             20                                  7
 Nome Census Area                                                14                                  6
 Northwest Arctic Borough                                        14                                 11
 Sitka City and Borough                                          12                                 11
 Southeast Fairbanks Census Area                                 12                                  8
 Yukon-Koyukuk Census Area                                       11                                  4
 Denali Borough                                                  10                                  0
 Other Regions of Alaska                                         58                                 45
 Total                                                        5,397                              4,592
Table 2 Migration to/from Kenai Peninsula by Number of PFD Applications.
Source: AKDOLWD, 2020.

The regions economically active population (individuals between the ages of 20 and 65) makes up 58.5
percent of the borough’s total population. Statewide, the share of economically active population was
61.3 percent in 2020. 12

Figure 5: KPB population by Age Group.
Source: AKDOLWD, 2020.

Kenai Peninsula 2021-2026 Comprehensive Economic Development Strategy                           Page 9
UA CED & KPEDD
However, population projections generated by the State of Alaska Department of Labor and Workforce
Development estimate that the portion of economically active population will shrink and the share of
retired and elderly individuals will grow. 13 Labor availability is a key component of economic resilience. If
this trend continues it will pose a challenge to the regional economy.

Figure 6: Projected economically active population vs. population over 65 in KPB.
Source: AKDOLWD.

Race and Ethnicity
KPB is less ethnically diverse than the state as a whole. The majority of Peninsula residents are white (83
percent in 2019, compared to about 65 percent statewide). Making up approximately 8 percent of the
total population, ‘American Indian and Alaska Native’ is the second largest group in the region. 14

Kenai Peninsula 2021-2026 Comprehensive Economic Development Strategy                                Page 10
UA CED & KPEDD
Figure 7: Self-identified race as a percent of total population in KPB.
Source: AKDOLWD, 2019.

Employment
The Kenai Peninsula region hosted an average of 24,858 jobs in 2019. Jobs in the region experienced a
dramatic decrease in 2020. In September 2020, the most recent month with published job estimates,
24,346 jobs were recorded in the region, 1,886 fewer jobs than in the same month the previous year.
These loses are largely a result of the economic impacts of the COVID-19 pandemic. The pre-pandemic
job numbers represent the beginning of a recovery for the regional economy from the 2016 statewide
recession, during which KPB lost approximately 600 jobs from the region’s 2015 peak. 15

Kenai Peninsula 2021-2026 Comprehensive Economic Development Strategy                          Page 11
UA CED & KPEDD
Figure 8: Monthly year-over-year employment change in KPB.
Source: QCEW, 2011-2020.

The Kenai Peninsula is home to a mix of established and emerging industries. Using data collected by
Quarterly Census of Employment and Wages (QCEW), ‘Government’ makes up the largest sector of
employment in the region, employing 4,868 individuals in 2019. ‘Local Government’ represents the
largest portion of that employment, with 3,723 employees working in local government across the
borough.

Figure 9: Average annual employment in KPB.
Source: QCEW, 2010-2019.

Kenai Peninsula 2021-2026 Comprehensive Economic Development Strategy                           Page 12
UA CED & KPEDD
In the private sector, ‘Trade, Transportation, and Utilities’ is the largest sector of employment, with
12,288 individuals employed in 2019. This sector includes ‘Wholesale Trade’, ‘Retail Trade’,
‘Transportation and Warehousing’, and ‘Utilities’.

‘Educational and Health Services’ sector, which includes ‘Educational Services’ and ‘Health Care and
Social Assistance’, employs 3,313 individuals. The ‘Leisure and Hospitality’ industry hosts 2,683
employees, primarily in the accommodation and food services sector.

Figure 10: KPB industry employment by 2 digit NAICS.
Source: QCEW, 2019.

When analyzing employment in the region it is helpful to understand that many individuals are
employed in industries outside of traditional definitions (i.e. fishing industry employment is not fully
captured by the QCEW). The State of Alaska Department of Labor and Workforce Development
generates separate estimates of employment in the fishing and seafood industry (fisheries employment
is discussed separately in the industries section).

Education
The Kenai Peninsula region is home to a wealth of educational resources. With a population of
approximately 11,000 school-aged children living in KPB, the educational resources across the region
play an important role in the Kenai Peninsula economy. School-aged population is spread evenly across
the different age-groups and cumulatively make up 25 percent of the borough’s total population. 16

Kenai Peninsula 2021-2026 Comprehensive Economic Development Strategy                               Page 13
UA CED & KPEDD
Figure 11: Population of school-aged individuals in KPB.
Source: AKDOLWD, 2020.

The Kenai Peninsula Borough School District operates 41 schools, serving 7,902 students from
kindergarten to 12th grade in the 2020-2021 school year. An additional 183 students are enrolled in pre-
kindergarten education. 17 Students living in the region are also enrolled in any of the three private
schools and statewide and nationwide homeschool programs; however, enrollment data for those
programs is not publicly available.

Figure 12: Kenai Peninsula Borough School District K-12 enrollment.
Source: AK Department of Education and Early Development, 2010-2020.

Kenai Peninsula 2021-2026 Comprehensive Economic Development Strategy                            Page 14
UA CED & KPEDD
Over the last decade, the population of students enrolled at the Kenai Peninsula School District has
declined while the population of school-aged individuals remained relatively steady. Despite limited
information on private school and homeschool enrollment, this trend indicates increased enrollment at
institutions outside of the Kenai Peninsula Borough School District.

Looking toward the future, the population of school age children in the borough is expected to increase
by an average of 0.6 percent annually until 2045. 18

Figure 13: Projected KPB population under 19.
Source: AKDOLWD, 2015-2045.

The post-secondary educational institutions on the peninsula play an important role in the continuing
education of residents. The University of Alaska Anchorage – Kenai Peninsula College had 1,736 students
enrolled in fall of 2020. 19 The Kenai Peninsula College has four campuses: Kenai River Campus in
Soldotna, Kachemak Bay Campus in Homer, Resurrection Bay Extension Site in Seward, and the
Anchorage Extension Site. Enrollment in the Kenai Peninsula College has declined over the last five
years, a trend which is likely tied to decreased funding for the University of Alaska system and cuts to
academic programing system wide.

Kenai Peninsula 2021-2026 Comprehensive Economic Development Strategy                           Page 15
UA CED & KPEDD
Figure 14: Enrollment at UAA Kenai Peninsula College.
Source: UAA, 2016-2020.

The borough is also home to the Alaska Vocational Technical Center (AVTEC), which draws students
from across the state to Seward to participate in the vocational training programs the center offers. In
fall 2019, AVTEC had 631 students enrolled in programs ranging from culinary arts to industrial
welding. 20 The table below includes a list of programs available at AVTEC.

 AVTEC Vocational Programs
 Maritime Training Program                              Industrial Electricity
 Business and Office Technology                         Industrial Welding
 Construction Technology                                Information Technology
 Culinary Arts                                          Plumbing and Heating
 Diesel/Heavy Equipment Technologies                    Welding
Table 3: AVTEC Vocational Programs.
Source: AVTEC, 2021.

Other technical and vocational programs are also present in the borough. These include, but are not
limited to, the Alaska Construction Academy, Amundsen Educational Center, and Alaska Petroleum
Academy.

Cost of Living and Quality of Life
Housing
Housing costs in the region are among the lowest in Alaska, with both median rent and sales prices
lower than medians in the Municipality of Anchorage and Matanuska-Susitna Borough. The median rent
price in was $918 in 2020. 21 During the same period, the average single-family home sales price in the
region was $298,797. 22 This means the average home on the Kenai Peninsula is more than $100,000
cheaper than the average Anchorage home, and almost $13,000 less than the Mat-Su average.

Kenai Peninsula 2021-2026 Comprehensive Economic Development Strategy                             Page 16
UA CED & KPEDD
KPB Housing Costs, 2020
                                                                 KPB       Mat-Su           Anchorage
 Median Rent                                                    $918        $1,060             $1,090
 Average Single-Family Loan Value                            $260,458     $272,517           $347,093
 Average Single-Family Sales Price                           $298,797     $311,686           $402,717
Table 4: KPB Housing Costs.
Source: AKDOLWD, 2020.

Housing affordability is an important component of quality of life. The 2018 Statewide Housing
Assessment, conducted by the Alaska Housing Authority, determined that in the KPB, 27 percent of
households were considered cost burdened. Cost burdened is defined as households which spend more
than 30 percent of household income on total housing costs. 23 This is a smaller proportion than
Anchorage or the state as a whole.

Figure 15: Percent of households considered cost burdened in KPB.
 Source: AHFC, 2018.

Housing availability is another component of housing quality. In 2020, the region saw the construction of
95 new housing units across the communities of Seward, Soldotna, Kenai, Homer, and Seldovia. Homer
and Kenai experienced the most construction, with 55 and 18 new housing units built, respectively. In
both Homer and Kenai, new housing units were predominantly single-family dwellings. 24

Kenai Peninsula 2021-2026 Comprehensive Economic Development Strategy                            Page 17
UA CED & KPEDD
Figure 16: New housing units built in KPB.
Source: AHFC, 2011-2020.
Across Alaska, housing conditions are a critical indicator of quality of life. Draftiness, housing stock
without complete plumbing, and increased risk of indoor air quality (IAQ) issues are all indicators of
housing stock quality. On average, housing units on the Kenai Peninsula are a lower risk for IAQ issues,
and fewer are considered drafty compared to Anchorage and the state as a whole. However, a larger
percentage of homes have incomplete plumbing, compared to Anchorage and statewide. 25
KPB Housing Stock Quality, 2018
KPB Anchorage Statewide
Housing stock at risk for IAQ issues 59% 69% 56%
Occupied Housing Considered Drafty 29% 33% 36%
Homes with Incomplete Plumbing 5% 1% 1%
Table 5: KPB House Stock Quality.
Source: AHFC, 2018.
With the expected growth in senior population in the borough, senior housing is expected to become a
growing concern. In 2016, it was estimated that KPB had 22 senior citizens per licensed senior facility
bed, significantly higher than the statewide average of 15 seniors per licensed senior facility bed. In the
next ten years, this statistic is estimated to grow to 39 senior citizens per licensed senior facility bed.
While not every senior citizen is in need of a bed at a care facility, the statistic does represent a growing
concern over senior housing and care capacity in the region. 26
Kenai Peninsula 2021-2026 Comprehensive Economic Development Strategy Page 18
UA CED & KPEDDFigure 17: Projected senior citizens per licensed senior facility bed in KPB. Source: AHFC: 2016-2030. Income and Poverty According to the U.S. Census Bureau American Community Survey, median household income in the borough is $66,064. As a region with such a wide spread of urban and rural communities, household income varies widely across KPB. In the more urban center of Soldotna, the median annual household income is $60,491. In Nanwalek, on the southern end of the borough across Kachemak Bay from Homer, the median household income is $43,750. In Seward, the median household income is $73,611. 27 Borough-wide, real average monthly wages have decreased over the last five year. In 2019, average wages in KPB were $4,355, lower than the statewide monthly average of $4,790. Average monthly wages have been declining in the Borough since 2015, with a more dramatic drop in 2019. 28 Kenai Peninsula 2021-2026 Comprehensive Economic Development Strategy Page 19 UA CED & KPEDD
Figure 18: Average monthly wages in KPB, in real 2019 dollars.
Source: QCEW, 2010-2019.

Unemployment in the region is lower than statewide. The most recent unemployment rate, as of
December 2020, was 7.3 percent. Employment in the region was affected by the COVID-19 pandemic. At
its peak in April 2020, the unemployment rate in the region reached 17.2 percent. 29 It should be noted
that the unemployment rate is not always an accurate measurement of joblessness in a given region, as
it does not measure individuals who have dropped out of the workforce.

Figure 19: Average annual unemployment rate in KPB and state of Alaska.
Source: AKDOLWD, 2011-2020.

Kenai Peninsula 2021-2026 Comprehensive Economic Development Strategy                          Page 20
UA CED & KPEDD
An estimated 12 percent of the population in the borough lives below the poverty line, slightly higher
than the statewide average of ten percent. 30 The population of KPB is spread across rural and urban
setting, and the higher-than-average poverty rate in the borough is partially driven by high rates in
remote areas. In Nanwalek, one in five households lives in poverty.

 Sample of Community Level Poverty Rates in KPB, 2019
 Community                                                                                 Poverty Rate
 Soldotna                                                                                          8.6%
 Homer                                                                                           10.3%
 Nanwalek                                                                                        21.7%
 Cooper Landing                                                                                      7%
Table 6: Sample of Community Level Poverty Rates.
Source: American Community Survey, 2019 5-Year Estimates.

The Denali Commission generates a list of communities in Alaska considered “distressed.” Distressed
communities are defined as communities meeting a number of criteria including:

    •    Community-wide average income compared to full-time minimum wage earnings;
    •    Percentage of population earning greater than the full-time minimum wage earning; and,
    •    Percentage of population engaged in year-round wage and salary employment.

Twenty-three of the 37 communities in KPB are considered distressed. 31 Table 7 presents a list of
distressed communities in the borough.

 Distressed Communities in KPB, 2020
 Anchor Point                                               Nanwalek
 Beluga                                                     Nikolaevsk
 Cohoe                                                      Ninilchik
 Cooper Landing                                             Point Possession
 Crown Point                                                Port Graham
 Diamond Ridge                                              Primrose
 Fox River                                                  Salamantof
 Fritz Creek                                                Seldovia
 Funny River                                                Seldovia Village
 Halibut Cove                                               Tyonek
 Happy Valley
 Hope
 Kachemak
Table 7: Distressed Communities in KPB.
Source: Denali Commission, 2020.

Cost of Living
Cost of living in the borough can be high compared to more urban areas of Alaska, like Anchorage, and
the national average. Cost of living index information can be limited in Alaska outside of Anchorage;
however, the Department of Defense Oversees Cost of Living Allowance Index includes select
communities in the Borough and allows some comparison of cost of living in the region.

Kenai Peninsula 2021-2026 Comprehensive Economic Development Strategy                            Page 21
UA CED & KPEDD
Figure 20: DOD Overseas Cost of Living Adjustment index of select Kenai Peninsula communities. Source: DOD, 2020. While the housing costs in the region are lower on average than other areas of the state, other variables influencing cost of living in the region are more expensive. Power costs in the region, from Homer Electric Association (HEA), are among highest of the electric cost on the integrated system of utilities in urban Alaska, referred to as the Railbelt. Select areas of the peninsula are served by Chugach Electric Association (CEA), with some of the lowest electric rates across urban Alaska Figure 21: Kenai Peninsula electric utility cost compared to other urban Alaska utilities. Source: Regulatory Commission of Alaska, 2020. Kenai Peninsula 2021-2026 Comprehensive Economic Development Strategy Page 22 UA CED & KPEDD
Food costs in the region are slightly higher than other urban regions of Alaska. The University of Alaska
Fairbanks Cooperative Extension Service tracks food costs across Alaska. In 2018 the average food cost
for a family of four in Kenai was estimated to be $184.02 per week. 32

Figure 22: Weekly food cost for family of four in Kenai.
Source: UAF, 2018.

Energy
Electricity in the region is primarily provided by HEA, which serves the majority of Kenai Peninsula
residents. HEA provides electricity at a lower cost to customers as a result of access to affordable natural
gas and economies of scale. Northwest regions of the peninsula are served by CEA. CEA also serves
Tyonek, a remote community in the borough on the northern side of the Cook Inlet. The City of Seward
manages its own electric utility, serving approximately 3,000 customers.

 Electricity Costs Across KPB, 2020
 Utility                                     Energy Source                                  Cost per kWh
 Homer Electric Association         Natural Gas, Hydroelectric, Diesel                              $0.27
 Chugach Electric Association       Natural Gas, Wind, Hydroelectric                                $0.21
 City of Seward                        Natural Gas, Hydroelectric                                   $0.24
Table 8: Electricity costs across KPB.
Source: Regulatory Commission of Alaska and City of Seward, 2020.

Space heating in the region is fueled by a patchwork of energy sources. Parts of the borough, including
Homer, Kenai, Nikiski, Sterling, and Soldotna, are served by ENSTAR Natural Gas Company which enables
natural gas fueled heating. Other space heating is fueled by propane and heating fuel.

Kenai Peninsula 2021-2026 Comprehensive Economic Development Strategy                              Page 23
UA CED & KPEDD
Fuel Cost by Source in KPB, 2020 and 2021
 Fuel Source                                                                                                   Cost
 Natural Gas ($/CCF)                                                                                          $1.09
 Heating Fuel ($/Gallon)*                                                                                     $2.55
 Gasoline ($/Gallon)*                                                                                         $2.60
Table 9: Fuel cost by source in KPB.
Source: Regulatory Commission of Alaska, 2020 and Department of Community and Rural Affairs, 2020 and 2021.
*Note: Heating fuel and gasoline costs are for Homer, costs vary by community.

It should be noted that access to the road system and local natural gas infrastructure helps to maintain
lower fuel costs in more urban regions of the peninsula. In remote areas, communities off the road
system, fuel costs are significantly higher. For example, Homer and Seldovia are the only two
communities in the borough tracked by the State of Alaska Division of Community and Regional Affairs
Fuel Price Survey. Homer is on the road system and in January 2021 heating fuel in the community was
priced at $2.55 per gallon. Across Kachemak Bay, and off the road system, the heating fuel price
recorded in Seldovia during the same period was $3.72 per gallon, 33 46 percent higher than prices in
Homer.

Communications
Approximately 84 percent of households in the borough have internet subscriptions, which is lower than
in Anchorage, with 93 percent of households with internet access, and in Alaska, with an average of 88
percent of households. Of the households with internet access, 66 percent have broadband access. The
remaining households utilize dial-up or satellite internet. 34

Kenai Peninsula 2021-2026 Comprehensive Economic Development Strategy                                         Page 24
UA CED & KPEDD
Figure 23: Households with broadband access by type of access.
Source: American Community Survey, 2019 5-Year Estimates.

However, the number of households with internet subscriptions is not a measurement of affordability
and quality. Broadband quality and affordability can vary widely across the remote and urban areas of
the Borough. Rural areas experience higher costs and slower speeds.

“Middle-mile” infrastructure, the infrastructure connecting networks coming into Alaska from the Lower
48 to the “last-mile”—smaller community level networks, in the region has expanded over the last
decade. Portions of the region are also connected to GCI’s TERRA network and other GCI fiber
networks. 35

In 2020, KPB allocated $1.2 to $2 million in CARES Act funding to improve public access to internet. That
allocation is funding the construction of a new communication towers intended to expand broadband
across underserved areas of the borough. 36

Infrastructure and Transportation
Roads
Large portions of the Borough are connected to the North American Highway System through
Anchorage. The Seward and Sterling Highways are the primary arteries on the Kenai Peninsula and
provide much of the region ground access to the rest of Alaska, Canada, and the Lower 48. The Kenai
Spur Highway connects the large population centers of the Central Peninsula–Kenai, Nikiski, Ridgeway,

Kenai Peninsula 2021-2026 Comprehensive Economic Development Strategy                            Page 25
UA CED & KPEDD
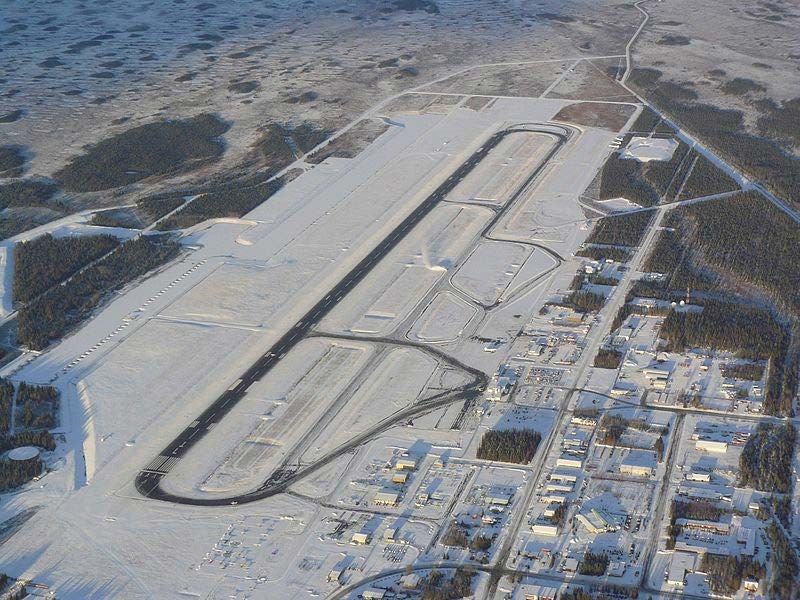
and Salamatof–to the Sterling Highway. At opposite ends of the Peninsula, the Seward and Sterling
Highways connect Seward to Homer and enable the development of numerous communities like Moose
Pass, Cooper Landing, and Anchor Point, which lie between. The regions relatively well-developed
highway infrastructure acts as an enabler of economic activity, enabling the flow of people (including
tourists), consumer goods, and construction materials at lower cost than regions dependent entirely on
air transportation.

A number of communities and villages in the Southern Peninsula are not connected to the road system,
including Seldovia, Nanwalek, and Port Graham. These communities are accessible by boat or air. On the
western side of the Borough, the village of Tyonek is also only accessible by boat or air.
Disconnectedness from ground transportation creates challenges such as: difficulty receiving timely
medical care, increased cost of living, and fewer employment opportunities than the rest of the
Borough.

KPB maintains over 645 miles of roads, 95 percent gravel and 5 percent paved. 37 A project is underway
to extend the Kenai Spur Road north, connecting the remote subdivisions of Gray Cliffs and Moose
Point. 38

Air
There are both public and private airports in KPB, ranging from those that receive daily commercial
service, such as Homer and Kenai, to remote gravel airstrips. Public airports include major hubs and
airfields used for large carriers, jet liners, and international flights, as well as smaller public charter
flights and personal aircraft. Private airports may require special permission, a private membership, or
use of private charter flights. Most airports are private as there is a need to access many small, remote
communities. “Flightseeing” tours are very popular among tourists, especially in Homer, Soldotna, and
Kenai.

Kenai Peninsula 2021-2026 Comprehensive Economic Development Strategy                               Page 26
UA CED & KPEDD
Kenai Peninsula Airports, 2020
 Location                                 Ownership         Type               Length (ft)
 Anchor Point                              Private         Gravel                2,500
 Clam Gulch                                Private         Water                 2,000
 Cooper Landing                            Public        Gravel/Dirt             2,200
 Homer                                     Public          Paved                 6,701
 Homer                                     Private         Gravel                1,250
 Homer                                     Private         Gravel                2,400
 Homer                                     Public          Water                 2,501
 Homer                                     Public          Water                 3,000
 Homer                                     Private          Turf                  840
 Hope                                      Public          Gravel                2,040
 Kasilof                                   Public          Gravel                2,400
 Kenai                                     Public          Paved                 7,855
 Kenai                                     Private       Gravel/Turf             2,600
 Kenai                                     Private          Turf                 2,400
 Kenai                                     Private          Turf                 2,640
 Kenai                                     Public          Water                 5,000
 Kenai                                     Private          Turf                 2,539
 Kenai                                     Private         Water                 4,500
 Kenai                                     Private         Gravel                2,700
 Nanwalek                                  Public          Gravel                1,850
 Ninilchik                                 Public          Gravel                2,400
 Port Graham                               Public        Gravel/Dirt             1,975
 Seldovia                                  Public          Gravel                1,845
 Seward                                    Public          Paved                 4,249
 Soldotna                                  Private       Gravel/Dirt             2,800
 Soldotna                                  Private          Turf                 1,300
 Soldotna                                  Private          Dirt                 2,000
 Sterling                                  Private         Gravel                1,750
 Sterling                                  Private         Gravel                 800
 Sterling                                  Private         Gravel                1,300
 Sterling                                  Private         Gravel                1,200
 Sterling                                  Private          Turf                 1,900
 Sterling                                  Private         Gravel                2,400
 Sterling                                  Private         Gravel                1,980
 Sterling                                  Private         Gravel                1,504
Table 10: Kenai Peninsula Airports.
Source: Federal Aviation Administration, 2020.

Kenai Municipal Airport is the largest of airport in the region and serves as the primary collection and
distribution center for scheduled passenger, cargo, and mail service. Regular commuter flights out of
Kenai Municipal link the Central Peninsula to Anchorage, 60 air miles away.

Kenai Peninsula 2021-2026 Comprehensive Economic Development Strategy                              Page 27
UA CED & KPEDD
In 2020, air service to the Kenai Peninsula by RavnAir, one of the primary commercial air service
providers in the region, was reduced then eliminated due RavnAir declaring bankrupcy. 39 RavnAir has
since resumed flights to Kenai Municipal Airport and Homer Airport.

Rail
Seward is the only community in KPB with rail access. The Alaska Railroad Corporation operates a rail
line between Anchorage and Seward. The train is used as a major tourism artery in the summer, moving
cruise ship passengers from Seward through to the rest of Alaska. In addition to cruise passengers, the
railroad operates a passenger line between Anchorage and Seward. The train also moves freight
(including coal from the Interior for export) in addition to passengers.

Marine Highway
The Alaska Marine Highway System (AMHS) serves Homer and Seldovia on the Kenai Peninsula. Overall,
passenger traffic at both ports has decreased over the last five year, a trend which is tied to the decline
in the AMHS operating budget and associated declines in scheduled dockings. However, Homer and
Seldovia both saw increases in traffic in 2014, 2016, and 2018.

Figure 24: Total AMHS embarking and disembarking passengers at KPB ports.
Source: AMHS, 2009-2018.

Ferry service is a vital link between coastal communities and allows vehicles as well as passengers to
access places like Seldovia, which are not on the road system. The Alaska Marine Highway System has
suffered from financial insecurity, service cutbacks, and aging infrastructure in recent years. 40

Key Industry Sectors
The Kenai Peninsula economy is driven by the strength of a number established industries, including
fisheries, health care, oil and gas, and tourism and recreation. A handful of emerging industries also

Kenai Peninsula 2021-2026 Comprehensive Economic Development Strategy                               Page 28
UA CED & KPEDD
show signs of growth in the region, like agriculture and marine based sectors (aquaculture, marine
services, and marine research). Almost all sectors saw employment loss as a result of the pandemic.

Fisheries
Key facts:
   • Seward, Kenai, and Homer are in top 100 national ports for seafood landings.
   • 73 million pounds landed in 2019.
   • $72 million paid to fishermen in 2019.
   • Almost 1,600 borough residents own commercial fisheries permits.

The rich marine waters of Cook Inlet and the Gulf of Alaska have sustained the Kenai Peninsula’s
Dena’ina and Alutiiq people for millennia. Of more recent vintage is the region’s commercial fisheries,
which date back to the 1880s. Today, the commercial ports of Homer, Kenai, and Seward land tens of
millions of pounds of salmon, halibut, and sablefish (black cod). In 2019, these three ports accounted for
73 million pounds of seafood, with an ex-vessel value (the price paid to fishermen) of $72 million. That
year, Seward ranked 22nd in the nation for landed weight, followed by Kenai (28th) and Homer (81st). 41

In terms of employment, seafood processors may employ as many as 900 workers during the summer
peak. However with the effects of COVID-19, in 2020 the seasonal peak was only about 600. 42 No exact
figure for the number of seafood harvesters is available, but 1,588 commercial permitholders lived in
the Borough in 2020. Homer, Kenai, Soldotna, and Kasilof are home to the greatest numbers of
permitholders. 43

The Alaska Department of Fish and Game (ADF&G) divide the waters around the Peninsula into two
areas: Upper Cook Inlet, which includes all parts of the Inlet north of Anchor Point, and Lower Cook
Inlet, encompassing waters to the south and along the outer south eastern coast from Homer to
Seward. Upper Cook Inlet drift and set gillnet fisheries primarily target sockeye salmon, while Lower
Cook Inlet purse seiners and set gillnetters focus on pinks. In the two areas combined, sockeyes account
for the majority of the volume and value of the salmon fishery. In 2019, sockeyes made up 55 percent of
the landed weight of the salmon harvest, and 82 percent of the value. The 10-year average value of
salmon harvests from both areas is $35.5 million. 44

Kenai Peninsula 2021-2026 Comprehensive Economic Development Strategy                             Page 29
UA CED & KPEDD
Figure 25: Gross weight of commercial salmon harvests in Upper and Lower Cook Inlet.
Source: ADF&G, 1975-2019.

Salmon are not the only economically important fish on the Kenai Peninsula. Seward and Homer are
among the top ports for landings of Individual Fishing Quota (IFQ) species, halibut and sablefish. In 2019
the two ports landed roughly $40 million in ex-vessel value between the two species. 45 Other
commercial species include rockfish and Pacific cod.

Health Care
Key facts:
   • Health care and social assistance jobs made up 13 percent of the total jobs in the Borough in
        2019.
   • Employment in the sector has declined since 2018.
   • Major hospitals are located in Soldotna, Homer, and Seward.
   • Gross sales in the health care industry have fallen since 2015.

The health care industry on the Kenai Peninsula is a critical component of quality of life. The regions
three hospitals in Seward, Homer, and Soldotna provide critical medical services to residents. In
addition, the network of health clinics assist in filling in gaps in health care needs in remote and rural
areas of the borough. However, access to specialty health care services can be limited in the region, and
frequently it can be more affordable to seek care outside of the region, in Anchorage or out-of-state.

Kenai Peninsula 2021-2026 Comprehensive Economic Development Strategy                             Page 30
UA CED & KPEDD
You can also read