Learning Image Similarity from Flickr Groups Using Fast Kernel Machines
←
→
Page content transcription
If your browser does not render page correctly, please read the page content below
1

      Learning Image Similarity from Flickr Groups
              Using Fast Kernel Machines
             Gang Wang, Member, IEEE, Derek Hoiem, Member, IEEE, David Forsyth, Fellow, IEEE

                                                                               ✦

Abstract—Measuring image similarity is a central topic in computer                 capture rich notions of image similarity. In this paper,
vision. In this paper, we propose to measure image similarity by learning          we exploit these group membership patterns to learn
from the online Flickr image groups. We do so by: choosing 103 Flickr              a measure of similarity for pairs of test images. More
groups; building a one-vs-all multi-class classifier to classify test images
                                                                                   specifically, two images are considered to be similar if
into a group; taking the set of responses of the classifiers as features;
calculating the distance between feature vectors to measure image                  they are likely to belong to the same set of groups. We
similarity. Experimental results on the Corel dataset and the PASCAL               use this measure to help a user query a photo collection
VOC 2007 dataset show that our approach performs better on image                   with text or with images, and refine this search with
matching, retrieval, and classification than using conventional visual             simple relevance feedback. In doing so, we allow flexible,
features. To build our similarity measure, we need one-vs-all classifiers          on-the-fly interaction between the user and the photo
that are accurate, and can be trained quickly on very large quantities
                                                                                   album.
of data. We adopt an SVM classifier with a histogram intersection
kernel. We describe a novel fast training algorithm for this classifier:
                                                                                      We measure the likelihood that an image belongs
the Stochastic Intersection Kernel MAchine (SIKMA) training algorithm.             to a particular Flickr group using a trained classifier.
This method can produce a kernel classifier that is more accurate than             There are many Flickr groups, each with many examples,
a linear classifier, on tens of thousands of examples in minutes.                  so we require an efficient training algorithm. In this
                                                                                   paper, we describe a new method to learn support vector
Index Terms—Image Similarity, Kernel Machines, Stochastic Gradient
                                                                                   machines (SVMs) with a Histogram Intersection Kernel
Descent, Online Learning, Image Classification, Image Organization.
                                                                                   (HIK), which has been shown to outperform linear ker-
                                                                                   nels for histogram-based image classification [14], [19].
1    I NTRODUCTION                                                                 Our method combines the kernelized stochastic learning
Digital cameras have made it much easier to take photos,                           algorithm from [17] with the support vector approxima-
but organizing those photos is still difficult. As a result,                       tion method [27] proposed for fast classification. The re-
many people have thousands of photos sitting on their                              sult is an algorithm that is much faster and more accurate
hard disk in some miscellaneous folders but do not                                 than the original stochastic learning algorithm, allowing
know or do not have time to organize them. Fortunately,                            us to learn from five thousand examples with 3000
the same digital explosion that created the problem                                dimensional features in just 15 seconds. Our algorithm
may also supply the solution. Users on online photo                                is also memory-efficient, since training examples are
sharing sites, like Flickr, have organized many millions                           processed one-by-one. Our SVM-HIK training algorithm
of photos into hundreds of thousands of semantically                               is useful for a variety of recognition tasks the employ
themed groups. These groups expose implicit choices                                histogram-based features.
that users make about which images are similar. Flickr                                An image is represented with a vector, whose com-
group membership is usually less noisy than Flickr                                 ponents represent the strength of association to each
tags, because images are screened by group members.                                Flickr group, as measured by our trained classifiers. To
Furthermore, Flickr groups can represent richer themes                             compute similarity between two images, we compute
than regular tags and object categories. For example,                              Euclidean distance between the feature vectors, which
there is a Flickr group called “No-Flash Night Shots”                              reflects that similar images should belong to the same
that highlights shots which are taken at night and in-                             Flickr groups.
volve long exposures. Flickr group membership patterns                                Our experiments show that our training algorithm
                                                                                   is efficient and provides accurate Flickr group classi-
• G. Wang is with the School of Electrical and Electronic Engineering,             fiers. Our ultimate goal, however, is to use the Flickr-
  Nanyang Technological University and the Advanced Digital Science                learned similarities for other image classification and
  Center, Singapore.
  E-mail: wanggang@ntu.edu.sg
                                                                                   organization tasks. We show that our learned similarity
• D. Hoiem and D. Forsyth are with the Department of Computer Science,             measure outperforms the original visual features for
  University of Illinois at Urbana-Champaign, Urbana, IL, 61801.                   image matching and clustering on the Corel dataset.
                                                                                   We also show that the learned similarities lead to more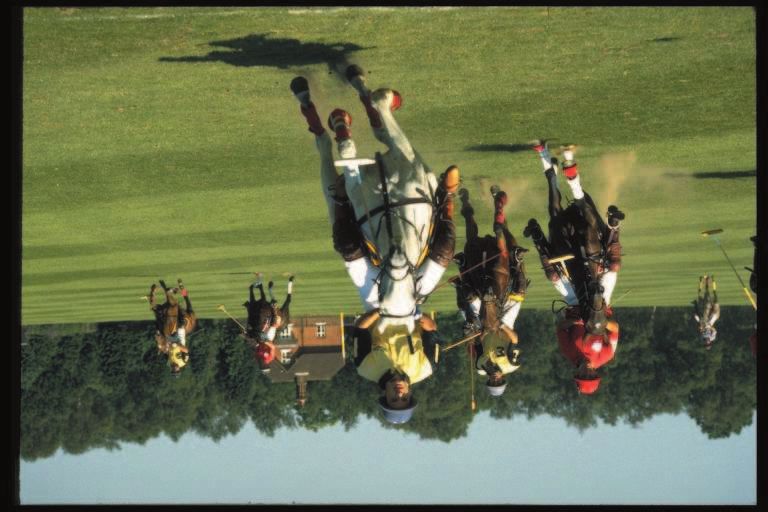
2

effective relevance feedback [34]. Taking advantage of           these technologies works terribly well. When managing
the text attached to Flickr groups, we also demonstrate          family albums, face annotation [49], [53] is especially
effectiveness in retrieval from text queries. Finally, we        interesting. Automatic face annotation and retrieval is
apply our method to calculate kernel values for the im-          hard. Active human annotation is usually needed to
age classification task on the PASCAL VOC 2007 dataset           improve the performance. [8], [42] develop approaches
[12]. Our novel similarity kernel outperforms the kernel         to reduce the efforts of human intervention. Different
based on visual features on 12 of 20 object categories.          from the above methods, we exploit the organization
   To summarize, this paper includes two contributions:          structure of Flickr image groups to learn image similarity
   (1)We show how to use implicit knowledge of simi-             to organize images.
larity (represented by the Flickr image groups) to train            We wish to train a very large scale kernel SVM. This
a measure of image similarity. This idea can be gen-             is an important research problem as we have bigger and
eralized. For example, one might use an online music             bigger datasets in computer vision such as the Lableme
directory to measure music similarity.                           dataset [35] and the ImageNet dataset [11]. There is
   (2)We propose a fast and memory-efficient algorithm           a good survey on large-scale kernel machine training
to train histogram intersection kernel machines, which           in [6]. Algorithms are generally of two classes: one
is applicable to many recognition tasks.                         exploits the sparseness of the lagrange multipliers (like
                                                                 SMO [31] and its variants); the other one uses stochastic
                                                                 gradient descent on the primal problem. Stochastic gra-
1.1 Related work
                                                                 dient descent has the advantage that, at each iteration,
Measuring image similarity is an important research              the gradient is calculated for only a single training
problem in computer vision. Traditional approaches usu-          example. Very good results can be obtained without
ally extract low-level visual features (e.g., texture fea-       touching every example [38], [5]. Kivinen et al. describe a
tures [20], [36], [46], shape features [4], [16], and gra-       method that applies to kernel machines [17]. However,
dient features [25], [9]) from images, and match them            it has to drop support vectors in the process, because
using distance metrics such as the Euclidean distance,           of which classification accuracy drops. We exploit the
the Chi-Square distance, the histogram intersection [40],        method of Maji et al. [27] to quickly evaluate a histogram
and the EMD distance [33]. Our paper addresses this              intersection kernel and efficiently keep existing support
problem by learning middle-level image representation            vectors. No support vectors have to be dropped, and
from Flickr groups. Our method can exploit hundreds              the training is fast. This proposed training algorithm
of thousands of Flickr images to discover discriminative         is further extended to minimize an objective function
visual patterns. Meanwhile, our results are interpretable:       enforcing similarity constraints in our later work [48].
we can say what makes two images similar by finding                 This paper is an extension of our published conference
out their shared group memberships.                              paper [51]. We have provided more details in the algo-
   Our work is related to a number of recently emerged           rithm section. We have also added more experiments, in
papers which build image representation based on the             particular, testing how the performance changes with d-
outputs of concept classifiers [32], [18], [45], [22]. Our key   ifferent number of quantization bins, with more training
novel observation is that Flickr provides an organization-       data, and with different number of Flickr groups, etc.
al structure with thousands of categories. Our learned
similarity from Flickr groups can reflect how people on
the Internet tend to group images.                               2   A PPROACH
   We train Flickr group classifiers using many Internet         We consider two images to be similar if people are
images. Several previous papers [13], [21], [37], [47]           likely to organize them into the same groups. We have
also learn object models from Internet images, but they          found Flickr groups to be a more meaningful content
tend to gather training examples using text-based image          indicator than other surrounding meta-data, such as tags
search results, which are not reliable. Their approaches         and captions. Our basic approach is to download images
have to alternate between finding good examples and              from each group and to train classifiers that distinguish
updating object models, in order to be robust against            between photos that belong to the group and those
noisy images. In contrast, we use images from Flickr             that do not. To get reliable classifiers, many (tens of
groups, which are screened by the Flickr group members           thousands of) training images are used for each group as
and clean enough to produce good classifiers.                    the training data. Previous training methods with non-
   We aim to organize images on the fly using the                linear kernels cannot handle so many training examples.
learned image similarity. There is an extensive content-         In this paper, we propose a new approach to train kernel
based image management literature, with recent reviews           machines using a histogram intersection kernel, namely
in [10], [23]. Appearance [41] or iconic [15] matching           Stochastic Intersection Kernel MAchines (SIKMA). This
are well established techniques. Clustering images as a          algorithm is fast and memory efficient. We apply group
way to expose the structure of a collection dates back           classifiers to predict the group memberships of each
to at least [3], [2]. Annotating images with words to            test image. Image similarity is then measured using the
allow word searches dates back to at least [3]. None of          Euclidean distance between prediction scores.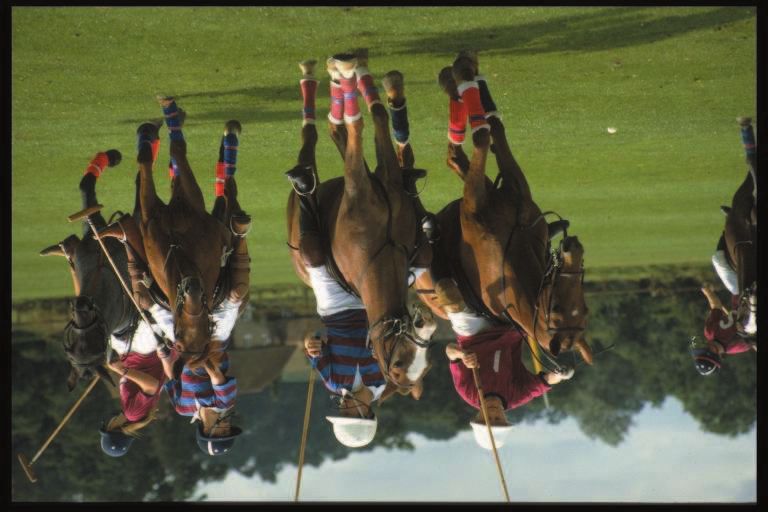
3
Aquarium
Car
Christmas
Sunset
Skycraper
Boat
Bonsai
Food
Fireworks
Penguin
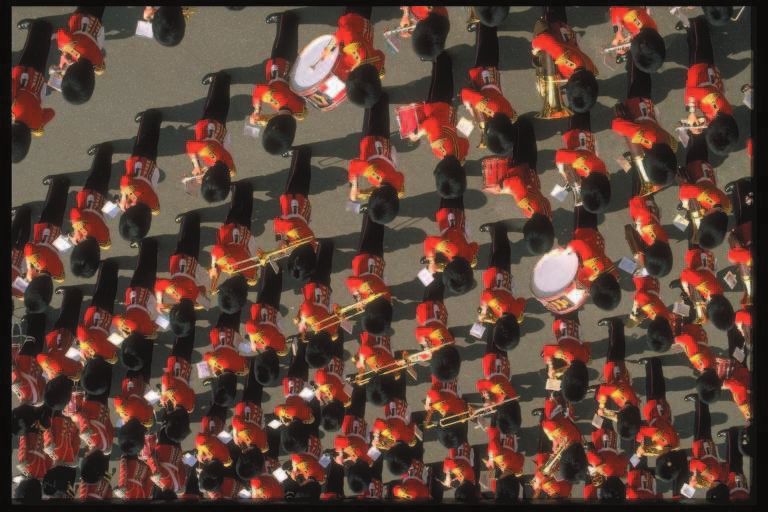
Fig. 1. Image examples from ten Flickr groups. Each row corresponds to a group. These groups are: aquariums, cars, Christmas, sunset,
skyscrapers, boat, bonsai, food, fireworks, and penguin.
4

2.1 Downloading Flickr image groups                                   In a primal method, we learn the kernel machines by
                                                                      minimizing the regularized empirical risk:
We download 103 Flickr image groups that span a wide
range of topics, avoiding groups, such as “B&W photog-                                  1X
                                                                                           T
                                                                                                               λ
raphy” that do not refer to scene content. Groups that                             L=         l(f (xt ), yt ) + kf k2                (1)
                                                                                        T t=1                  2
we use include objects, such as “aquariums” and “cars”;
scenes, such as “sunsets” and “urban”; and abstract con-                 where l is a loss function. A hinge-loss l(f (xt ), yt ) =
cepts, such as “Christmas” and “smiles”. We provide the               max(0, 1 − yt f (xt )), which is used in the conventional
complete list (paraphrased) below: aquariums, airplanes,              support vector machine framework, is also used here.
American flags, animals, architecture, art, bags, beaches,            But other loss functions such as log-loss can also be
bees, bikes, birds, boats, bonsai, bottles, bridges, buses,           applicable. We describe our approach using the hinge-
butterflies, cameras, candles, cars, castles, cats, chairs,           loss. Equation (1) can be minimized directly using the
characters, children, Christmas, churches, concerts, cows,            gradient descent method in the primal space. At the tth
dances, dogs, dolphins, drawings, ducks, eagles, eating,              iteration, we update f using:
eggs, faces, fashion, ferns, ferrets, fireworks, fishing,
                                                                                                         ∂L
flamingos, flowers, fog+rain, food, frogs, fruits, the Gold-                          ft = ft−1 − ηt        |f =ft−1                 (2)
en Gate Bridge, hands, helicopters, horses, ice, insects,                                                ∂f
laptop lunch, light, lizards, love, macro-flower, monkeys,            ηt is the learning rate at the tth step. Evaluating equation
                                                                      (2) involves calculating t=1 ∂l(f (x   t ),yt )
                                                                                                 PT
moons, motorbikes, mountains, mushrooms, painting,                                                                    |f =ft−1 , which is
                                                                                                            ∂f
pandas, penguins, people, plants, rain, rainbows, rural,              very expensive when T is big.
sheep, skateboarding, skies, skyscrapers, smiles, snails,                Using the stochastic gradient method, we approximate
sneakers, snow, socks, spiders, sports, squirrels, stairs,            the gradient by replacing the sum over all examples
sunset, sushi, tea cup, teddy bears, tigers, tomatoes, toys,          with a sum over a subset chosen at random, and then
trains, trees, trucks, turtles, urban, watches, water drops,          take a step. It is usual to consider a single example. In
waterfalls, and weddings.                                             Kivinen et al.’s method [17], one sees this as presenting
   Some image examples are shown in Fig. 1. Compared                  the training examples to the classifier in some random
to Flickr tags and other metadata, the images within a                order, one by one, then updating the classifier at each
Flickr group are consistent in theme. Our experiments                 example to get a set of f , {f0 , f1 , ..., fT }, where f0 is
use 15,000 to 30,000 images in each of the 103 groups.                some initial hypothesis, ft−1 is the learned classifier by
                                                                      seeing the first t − 1 training examples. Now assume we
                                                                      have ft−1 . When the tth training example comes, the
2.2 Training group classifier using Stochastic Inter-                 new objective function is:
section Kernel MAchines (SIKMA)
                                                                                                              λ
For each Flickr group, we train a histogram intersec-                                 Q = l(f (xt ), yt ) +     kf k2                (3)
                                                                                                              2
tion kernel classifier to predict whether a test image
                                                                      we update f as:
belongs to it. Each Flickr group usually contains tens
of thousands of images, which can be used as positive                                                   ∂Q
                                                                                      ft = ft−1 − ηt       |f =ft−1                  (4)
examples. To train a discriminative classifier, we also                                                 ∂f
sample a large number of negative images from other                     When l is the hinge-loss, the update becomes
groups. We usually use around 80,000 training images to
learn each group classifier. Traditional approaches such              ∂Q            ∂l(f (xt ), yt ) ∂f (xt )
                                                                         |f =ft−1 =                           |f =ft−1 + λf |f =ft−1 (5)
as SMO [31] cannot handle so many training examples                   ∂f               ∂f (xt )        ∂f
for reasons of computation and memory. In this paper,                                       ∂l(ft−1 (xt ), yt )
we describe a new training algorithm called Stochastic                                   =                        K(xt , •) + λft−1 (6)
                                                                                                ∂ft−1 (xt )
Intersection Kernel MAchines (SIKMA). It is an online                                                    = −σt K(xt , •) + λft−1 (7)
learning algorithm, meaning that it processes training
examples one by one in a sequence and hence does not                  by writing
have the memory issue. Using the histogram intersection
                                                                                               1 if yt ft−1 (xt ) < 1
kernel, we combine the fast evaluation method develope-                             σt =                                             (8)
                                                                                               0 otherwise
d in Maji et al. [27] with the stochastic gradient descent
method, which leads to a very fast training algorithm.                Then (4) is equivalent to:
   We start by introducing the general stochastic kernel
                                                                                ft = (1 − ληt )ft−1 + ηt σt yt K(xt , •)             (9)
machine framework described in [17]. We have a list of
training examples {(xt , yt ), t = 1, · · · , T, yt ∈ {−1, +1}}.      This update can also be written in terms of the lagrange
We aim to learn a decision function P             f : X −→ R,         multipliers for the examples seen to date. In particular,
                                                    N
using a kernel machine. This yields f = i=1 αi K(xi , •)              we can write αi = (1 − ληt )αi for i < t and αt = ηt σt yt .
where K is a kernel function. Then for a test example                 It is hard to detect the convergence of the stochastic gra-
                                               PN
u, the classification score is f (u) =            i=1 αi K(xi , u).   dient descent method. In our implementation, we find it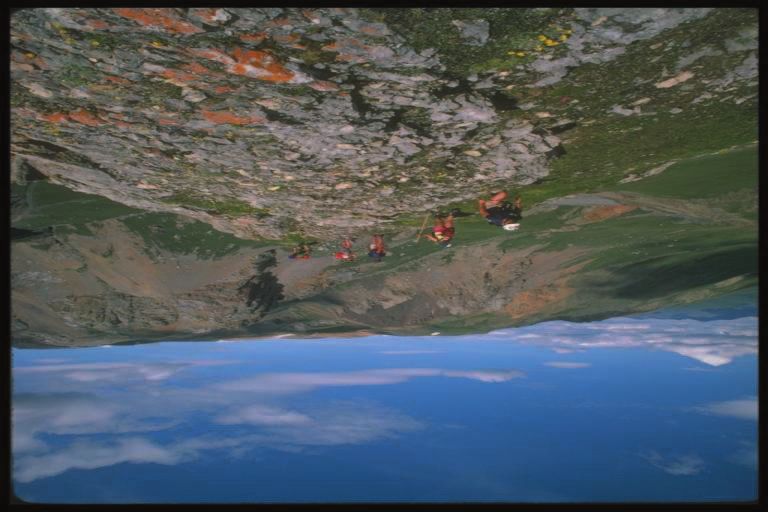
5

                                                                                                                         P
usually takes tens of thousands of iterations to produce a           and zero otherwise; B2 (m, d) stores the value i αi σi ,
stable classifier. When there are fewer training instances,          σi = 1 if xi (d) ≥ P (m) and zero otherwise.
we let the algorithm visit each instance multiple times.                To evaluate the function for xt (d), we quantize xt (d)
   When there are a large number of support vectors                  and look up in B1 and B2 . The two values are interpolat-
(this would happen in large datasets), it is expensive to            ed to approximately calculate (13). Since the elements of
calculate ft−1 (xt ) in (8) because it involves calculating          the tables are linear in the lagrange multipliers, updating
kernel values for many pairs of points. The NORMA                    the tables is straightforward. At the tth iteration both B1
algorithm developed in [17] keeps a set of support                   and B2 are multiplied by 1 − ληt . If σt (see (8)) is non-
vectors of fixed length by dropping the oldest ones. As              zero, the tables B1 and B2 are updated accordingly by
pointed out by [17], it is difficult to choose the number of         adding xt .
support vectors, which trades off between the memory                    Our method involves quantization. Because we quan-
and computational efficiency and the accuracy. In our                tize each dimension separately and the values are typ-
experiments, we find dropping support vectors usually                ically small, our approximation does not significantly
produces considerable cost in accuracy.                              impact performance when using a moderate number
   When a histogram intersection kernel is used, we                  of bins (e.g., 50). In Table 1, we show that very close
do not need to drop any support vectors and can still                performance is achieved using our method compared to
maintain the efficiency. The histogram intersection kernel           the exact solution. Maji et al. [27] show the similar obser-
has a strong performance record in computer vision [14],             vation on pedestrian detection using the fast histogram
[19]. Recently, Maji et al. [27] show that the support vec-          intersection kernel evaluation method.
tors of an intersection kernel machine can be efficiently               Computational Complexity: From the above descrip-
represented. We exploit this trick to train a fast stochastic        tion, we can see that the computational complexity of
intersection without dropping any support vectors.                   training the SIKMA is O(T M D), where T is the number
                   PNt−1                                             of training examples that are touched, M is the quan-
   Write ft−1 as i=1      αi K(xi , •), where K denotes the
histogram intersection kernel; write D as the feature                tization bin size, and D is the feature dimension. And
dimension. Then                                                      the computational complexity of the NORMA algorithm
                                                                     [17] is O(T P D), where P is the number of kept support
                      Nt−1        D
                      X           X                                  vectors. P is usually large when there are many features
       ft−1 (xt ) =          αi         min(xi (d), xt (d))   (10)
                                                                     and many training examples, as in our case.
                      i=1         d=1
                                                                        Comparison to Maji et al.[26]: Maji et al.[26] devel-
                      D N t−1
                      X X                                            oped (in parallel) a related method to speed up SVM
                 =                 αi min(xi (d), xt (d))     (11)
                                                                     training. Our method directly minimizes the objective
                      d=1 i=1
                                                                     function in the kernel space. Their method first encodes
At each dimension d, if we have the sorted values of                 data approximately. Once this is done, the problem
xi (d) as xi (d), with the corresponding αi , then:                  becomes linearly separable, and then a fast linear SVM
                                                                     solver such as PEGASOS [38] can be applied.
                  Nt−1
                      X
                            αi min(xi (d), xt (d))            (12)
                      i=1                                            2.3 Measuring image similarity
                r                            Nt−1                    For two test images, we use the trained Flickr group clas-
                X                            X
            =         αl xl (d) + xt (d)            αl        (13)   sifiers to classify them and get prediction scores. Then
                l=1                         l=r+1                    the distance between prediction vectors are calculated
                                                                     using the Euclidean distance. We have experimented
where xr (d) ≤ xt (d) < xr+1 (d). As [27], we use M
                                                                     with metric learning approaches to weight the prediction
piecewise linear segments to approximately calculate
                                                                     scores of different Flickr groups, but found the simpler
(13). Given that feature histograms are normalized, each
                                                                     Euclidean distance equally effective.
element of the feature vectors falls in the range of [0 1].
                                                                        Once computed, this similarity measure can be used to
We divide this range to M bins, and the starting value of
                                                                     perform image-based queries or to cluster images. Since
each bin is recorded in vector P . Note that the bins are
                                                                     we have names (groups) attached to each prediction, we
not necessarily even: in practice, we assign more bins to
                                                                     can also sometimes perform text-based queries (e.g., “get
the range (e.g., [0 0.01]) which has more data points.
                                                                     images which are likely to contain people dancing”) and
  Note that the terms of equation (13) contain only
                                                                     determine how two images are similar.
partial sums of α, rather than the values. This means that
the complexity of representing the kernel machine has
to do with these partial sums, rather than the number                3   F EATURES     AND IMPLEMENTATION DETAILS
of support vectors. We can store these sums in tables,               Following [50], we adopt four types of features to rep-
and update them efficiently. In particular, we have two              resent images. The SIFT feature [25] is widely used for
tables B1 and B2 with dimensions M ×D, where M is the                image matching [39], [30] and object recognition [52]. We
number of bins andP   D is the feature dimension. B1 (m, d)          employ it to detect and describe local patches in this
contains the value i αi xi (d)σi , σi = 1 if xi (d) < P (m)          paper. We extract about 1,000 patches from each image.
6

The SIFT features are quantized to 1,000 clusters and          Our method is nearly as accurate as batch training on
each patch is denoted as a cluster index. Each image           small problems involving a few thousand examples and
is then represented as a normalized histogram of the           enables training with tens of thousands of examples. For
cluster indices. The Gist feature has been proven to be        example, our method can train on 120,000 examples in
very powerful in scene categorization and retrieval [29],      80 seconds.
[44]. We represent each image as a 960 dimensional Gist           In Section 4.2, we evaluate our learned similarity
descriptor. We extract Color features in the RGB space.        in several ways. We show that our similarity measure
We quantize each channel to 8 bins, then each pixel is         allows much better image matching on the Corel dataset
represented as an integer value range from 1 to 512.           and improves more with relevance feedback. We can also
Each image is then represented as a 512 dimensional his-       perform text-based searches on non-annotated images in
togram. We also extract a very simple Gradient feature,        some cases.
which can be considered as a global and coarse HOG
feature [9]. We divide the image to 4*4 cells, at each cell,
                                                               4.1 SIKMA Training Time and Test Accuracy
we quantize the gradient to 16 bins. The whole image is
represented as a 256 dimensional vector.                       We first compare batch training, an existing stochastic
   For each Flickr group, we train four SVM classifiers,       learning algorithm NORMA [17], and our proposed
one for each of the above four features. We combine            algorithm SIKMA with the histogram intersection kernel
the outputs of these four classifiers to produce a final       and linear SVM on the PASCAL VOC 2007 dataset [12].
prediction score. We use a validation data set to tune         We choose this dataset because it is a popular benchmark
the weight parameters. In the validation procedure, we         dataset and has a proper number of images: around
first randomly generate 10,000 different combinations of       5,000 for training and 5,000 for test. The batch learning
weights, then choose the one that maximizes the perfor-        method is implemented in LIBSVM [7]. LIBSVM does not
mance on the validation data set. The final prediction         support histogram intersection kernel directly, so we pre-
score is used to measure image similarity.                     compute the kernel matrix with a Mex function and use
   We apply the Euclidean distance to calculate the dis-       LIBSVM to solve it. In NORMA, we set the number of
tance between Flickr prediction vectors and the distance       kept support vectors as 500, 1000, and 1500 respectively.
between visual feature vectors. In particular, when we         λ is validated for each category. Following [5], in SIKMA,
                                                                                                  1
compute distance between visual feature vectors, we            the learning rate is set to be λ(t+100) , and λ is set to be
weight the four types of features (namely, SIFT; GIST;         0.00005. For this comparison, the number of quantization
Color; and Gradient) differently. This is because some         bins is set to be 50. We also compare with linear SVM
features are more discriminative than the others. The          implemented in LIBSVM [7], where the parameter C is
weights are learned on a validation set, where we choose       also cross validated.
weights that force images from the same categories to             The experiment is conducted on the PASCAL VOC
be close and images from different categories to be far        2007 image classification task, which has 20 object class-
away with the learned weights. Similar approaches have         es. We use a 3000-bin histogram of quantized SIFT code-
been applied in [28], [50]. This approach is observed to       words as features. The average precision (AP) results,
produce a better baseline. Since our method exploits the       training time and test time of different methods are
histogram intersection kernel to train the Flickr group        compared in Table 1. The time of feature extraction is not
classifier, we also test a second baseline, which calculate    included to report the training and test time for all the
the similarity between visual feature descriptors with the     methods. Our method achieves similar accuracy to batch
histogram intersection. Again, different types of features     training when running for 6 rounds and is more accurate
are weighted differently via validation.                       than either NORMA (also with histogram intersection
   Most groups contain 15,000 to 30,000 images. To train       kernel) or batch training of linear SVMs. When more
a discriminative group classifier, we sample about 60,000      support vectors are kept, the NORMA algorithm can
negative images from other groups. Training each SVM           achieve better accuracy. However, the training time and
using our SIKMA algorithm takes about 150 seconds.             test time increase accordingly. Its accuracy is still lower
The resulting kernel machine classifier tends to have          than our SIKIMA algorithm when keeping 1500 support
between 5,000 and 8,000 support vectors. This is remark-       vectors, and it takes more than 10 times longer to train
able, considering that standard batch training is infeasi-     (compared to the SIKMA (3)).
ble and that NORMA [17] would take much longer to                 And for larger problems, the speedup of our SIKMA
produce a much less accurate classifier.                       algorithm over batch will increase dramatically, and
                                                               NORMA will be forced to make larger approximations
                                                               at cost to classifier accuracy. We run another experiment
4   E XPERIMENTS                                               to compare SIKMA and NORMA on 124, 000 images
In Section 4.1, we compare our fast histogram intersec-        (including 20,000 bus images and 104,000 non-bus im-
tion SVM training algorithm (SIKMA) to alternatives. We        ages; all are downloaded from Flickr groups). The test
show that our method is much faster and more accurate          set includes 500 bus images and 20,800 non-bus images.
than a recently proposed stochastic learning method [17].      Each image is represented as a 1,000 dimensional “bag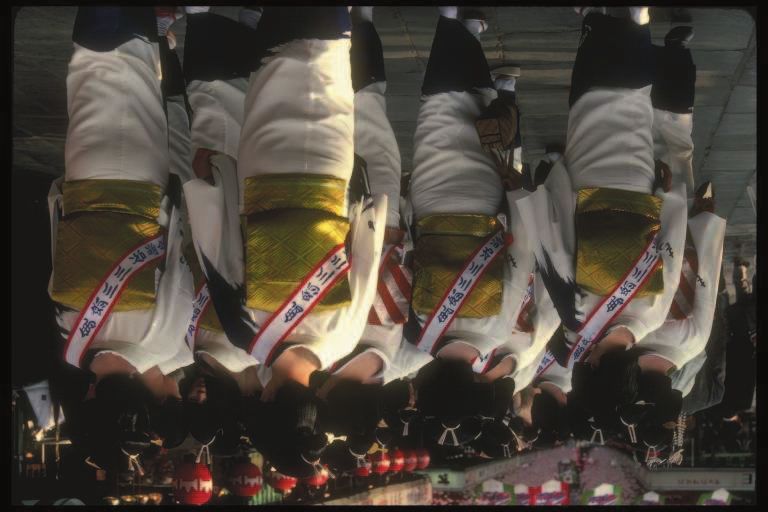
7

                           Linear   NORMA (SV=500)     NORMA (SV=1000)                        NORMA (SV=1500)         SIKMA (3)       SIKMA (6)     Batch (HIK)
            AP             0.362        0.308              0.374                                  0.411                  0.429           0.436         0.440
 training time (seconds)     0.8        172.4              304.4                                  396.5                   23.1           46.7          638.0
    test time (seconds)      0.5        63.9               122.4                                  178.8                    3.9            3.9          236.8

                                                       TABLE 1
Average precision (AP), training time and test time of different SVM training methods are compared on the PASCAL
    VOC 2007 image classification task. All the values are averaged over the 20 object categories. The histogram
   intersection kernel is used except the linear SVM. NORMA (SV=500) denotes the performance of the NORMA
  algorithm when at most 500 support vectors are kept. NORMA (SV=1000) denotes the performance when 1000
 support vectors are kept. And NORMA (SV=1500) denotes the performance when 1500 support vectors are kept.
SIKMA (3) denotes the SIKMA algorithm visits each training example three times. SIKMA (6) denotes each training
                                              example is visited six times.

                                             SIKMA    NORMA (SV=1000)                   NORMA (SV=2000)            NORMA (SV=3000)
                              AP              0.598       0.469                             0.483                       0.500
                   training time (seconds)     81.5       2556.0                            5050.2                     7402.6
                      test time (seconds)       4.2       130.1                             256.7                       383.9

                                                      TABLE 2
 Average precision (AP), training time and test time of different training methods are compared on a larger problem
(124,00 training images and 21,300 test images). NORMA (SV=1000) denotes the performance when 1000 support
   vectors are kept; NORMA (SV=2000) denotes the performance when 2000 support vectors are kept; NORMA
                     (SV=3000) denotes the performance when 3000 support vectors are kept.

                                                                                               Performance changes with the increase of training images
of words” feature. Each training example is visited twice                               0.5
by both SIKMA and NORMA algorithms. Even keeping                                       0.45
3,000 support vectors, the performance of NORMA is
                                                                                        0.4
poor, since many support vectors are dropped. Our SIK-
                                                                                       0.35
MA algorithm is 90 times faster compared to NORMA
                                                                    Average AP value

(3000).                                                                                 0.3

   When training with SIKMA, we need to use piecewise                                  0.25

linear segments to approximate the continuous values.                                   0.2

The approximation accuracy is controlled by the num-                                   0.15
ber of quantization bins. We perform an experiment to                                   0.1
investigate how the performance is affected by the bin
                                                                                       0.05
size. The results are summarized in Table 3 (each training
example is visited three times). Training time and test                                  0
                                                                                                 1/10   1/5               1/2                             1
time go up when we use more levels since we need                                                        of training images of each Flickr group

to update more parameters. The best performance is
achieved using 50 bins. There is not much change with             Fig. 2.   The average AP values over the 103 Flickr categories. The
more bins (some small drop is observed; it might be be-           X-axis denotes different percentages of training images (of each Flickr
                                                                  group) used at each time.
cause our algorithm randomly picks training examples,
hence randomness is introduced).
   We apply the SIKMA algorithm to train group clas-              be exploited to learn more accurate concept classifiers
sifiers for the 103 Flickr groups listed in Section 2.1.          compared to learning with a small number of training
For each Flickr group, there are 15,000 to 30,000 positive        examples. To show that more data helps, we do similar
images as well as about 60,000 negative images sampled            experiments as above, but with different percentages of
from other groups. Each group has 20,900 held out test            images from each group as training data (10%, 20%, 50%,
times: 500 positive and 20,4000 negative. An AP score             and 100% respectively). We keep the test data the same.
is calculated for each group. Fig. 3 shows the AP scores          Average AP values are shown in Fig. 2. Using more data
for all the 103 Flickr groups. The average AP over these          significantly improves the classification performance.
categories is 0.433. We can see the SIKMA algorithm
can produce reliable classifiers, which is very important
for measuring image similarity. We use Flickr groups as           4.2 Evaluation of Learned Flickr Prediction Features
the resource to learn image similarity partially because          We evaluate our learned Flickr prediction features on
Flickr groups have a large number of images, which can            image retrieval, on image clustering, and on image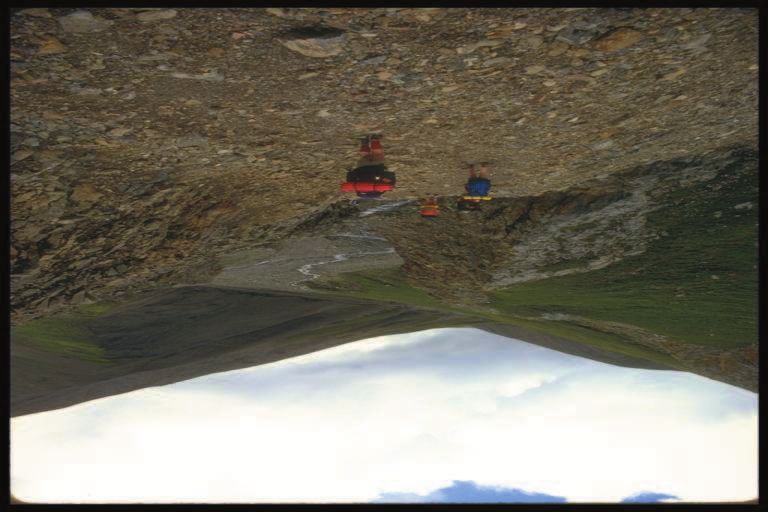
8

                                                       bins              10       20      50      80      120     150     200
                                                       AP              0.401     0.410   0.429   0.426   0.427   0.424   0.425
                                            training time (seconds)     9.9      12.8    23.1    25.3    35.0    38.1    54.2
                                               test time (seconds)      2.7       3.2     3.9     4.3     4.6     4.8     5.1

                                                     TABLE 3
 The AP values, training time, and test time of SIKMA using different number of bins. All the numbers are averaged
       over the 20 object categories. Each training example is visited for three times in this implementation.

              1.0
                                                                                         ranked using different similarity measures. Images from
              0.9
                                                                                         the same CD in the Corel dataset share the same theme.
              0.8                                                                        Hence images that have the same CD label or at least one
                                                                                         keyword in common are considered as correct matches;
              0.7
                                                                                         others are incorrect matches. An AP value is calculated
  AP scores

              0.6                                                                        for each query image. When using “visual features +
              0.5                                                                        Euclidean distance”, the averaged AP value over all the
                                                                                         query images is 0.110; when using “visual features +
              0.4
                                                                                         histogram intersection”, the averaged AP value is 0.114;
              0.3                                                                        when using our learned similarity, the average AP value
              0.2                                                                        is 0.123. We can see using Flickr groups provides a more
                                                                                         accurate measure of similarity. In Fig. 4, we show the
              0.1
                                                                                         25 nearest neighbor images found for each of 4 image
              0
                    0   10   20   30   40      50   60    70   80     90   100           queries. Images are sorted by similarity in descending
                                                                                         order from left to right, top to bottom. Two methods are
Fig. 3.   The AP scores of the 103 Flickr groups (categories). For each                  compared: one is “visual features + Euclidean distance”;
category, There are 20,900 held-out examples (500 positive). The five                    the other one is our learned similarity (also indicated
groups which get the highest AP values are: laptop lunch, fireworks,
pandas, socks and moon; the five groups which get the lowest AP values
                                                                                         as “Flickr prediction features”). We can observe that our
are: love, art, trees, ice and light.                                                    method can find more relevant nearest neighbors. For
                                                                                         example, for the top left “ship” image query, the nearest
                                                                                         neighbor images found by our method are more likely to
classification. The results show that our learned features                               contain ship inside; while the nearest neighbors images
perform better than the conventional visual features on                                  found using visual features are more about mountains
all these tasks.                                                                         and animals. This is because our method can learn more
                                                                                         powerful features from the Flickr image groups.
4.2.1 Image retrieval and clustering                                                        It is intuitive that the learned similarity works best
We measure image similarity by calculating the Eu-                                       when queries are related to the learned Flickr categories.
clidean distance between Flickr prediction features. The                                 When more Flickr categories are use, fewer queries will
quality of similarity measurement is the most important                                  be out of sample. Note that 1,000 classifications per
factor in automatic organization. We evaluate it in sev-                                 second can be performed after computing the features, so
eral ways. We can rank images according to similarity                                    it is entirely feasible to use thousands of Flickr categories
(image-based query) or cluster a set of images. We can                                   (downloading tens of millions of images is the main
also find images that are likely to belong to particular                                 obstacle for training).
groups or have certain tags. We can also say how two                                        We perform an experiment to investigate how the
images are similar, suggesting the possibility of more in-                               matching performance changes with the change of the
tuitive feedback mechanisms. The following experiments                                   number of the Flickr groups. At each time, we randomly
are performed on 38,000 images from the Corel dataset                                    select a subset of Flickr groups (for example, 10). Then
(except where noted), which has been popularly used                                      in the matching procedure, only the prediction scores
to evaluate image retrieval and organization methods                                     of these groups are used to measure image similarity.
[1], [43]. Each image is associated with a CD label and                                  We calculate the averaged AP value over the 500 query
a set of keywords. A CD contains 100 visually similar                                    images mentioned above. There is much variation when
images. Hence both CD labels and keywords are used                                       different subsets of Flickr groups are chosen. We repeat
as ground truth for matching. Each image has roughly                                     sampling Flickr groups 15 times for each number of
3-5 keywords.                                                                            groups. The mean and standard deviation values for
   We first evaluate our method on image query based                                     different numbers of groups are shown in Fig. 5. The
matching. 30,000 Corel images are used as the test bed,                                  performance increases with more Flickr groups. We can
among which 500 images are randomly chosen as query                                      also observe that the gain is not so significant when
images. For each query image, the other images are                                       increasing from 70 groups to 100 groups. This may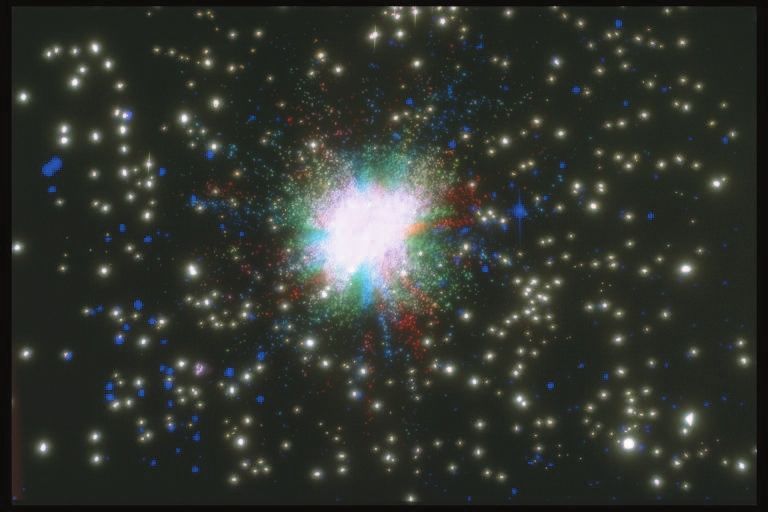
9

                  Query image        25 nearest neighbors with visual features 25 nearest neighbors with Flicr prediction features    Query image    25 nearest neighbors with visual features 25 nearest neighbors with Flicr prediction features

                  Query image       25 nearest neighbors with visual features 25 nearest neighbors with Flicr prediction features      Query image    25 nearest neighbors with visual features 25 nearest neighbors with Flicr prediction features

Fig. 4.   This figure shows the nearest neighbor images found for each of the 4 image queries. For each query image, the left column shows
the query itself; the center column shows the 25 nearest neighbor images found with visual features and the Euclidean distance; the right column
shows the 25 nearest neighbor images found with our Flickr prediction features. The rank is from left to right, from top to bottom.

                                                                                                                                     to provide unambiguous ground truth: 1 (sunsets), 21
                0.12                                                                                                                 (race cars), 34 (flying airplanes), 130 (African animals),
                                                                                                                                     153 (swimming), 161 (egyptian ruins), 163 (birds and
                                                                                                                                     nests), 182 (trains), 276 (mountains and snow) and 384
  Performance

                0.115                                                                                                                (beaches). Images are considered to match only when
                                                                                                                                     they have the same CD label. We compute the average
                                                                                                                                     AP value over 25 randomly selected image queries. For
                0.11
                                                                                                                                     both visual features and Flickr prediction features, we
                                                                                                                                     initialize the weights as ones. To simulate feedback, after
                0.105                                                                                                                each query, we select the top five negative examples
                                                                                                                                     and five randomly chosen positive examples among
                                                                                                                                     the top 50 ranked images and label them according to
                0.10                                                                                                                 ground truth. We use this to train a weight vector to
                                5     10       20        30        40        50        60       70        80        90      100
                                                     Number of Flickr groups                                                         produce a new distance metric. This is a very simple
                                                                                                                                     metric learning procedure. With the feedback, we aim to
                                                                                                                                     minimize the following objective function:
Fig. 5. The AP values of using different number of Flickr groups. For                                                                                                10
each number, we repeat 15 times to randomly select a subset of groups.
                                                                                                                                                                     X
Both mean and standard deviation values are shown in the figure.                                                                                                              yi w • (xq − xi )2                                                      (14)
                                                                                                                                                                        i

suggest that Flickr groups share some common visual
                                                                                                                                                         P
                                                                                                                                     Subject to wd ≥ 0, d wd = 1 where xq is the feature
patterns, learning from a number of Flickr groups is also                                                                            representation of the query image. xi is the feedback
effective for out of sample image queries.                                                                                           example. yi is 1 if it is positive, and 0 otherwise. If
   Image matching is a hard task. Human intervention                                                                                 we had very extensive feedback, we would have a
can be very useful for finding similar images as humans                                                                              good estimate of the cost function. With relatively little
can implicitly or explicitly suggest what features to look                                                                           feedback, the model of cost applies only locally around
at. Relevance feedback is a very popular technique in                                                                                the current values of w. For this reason, we take a single
image retrieval to enforce human intervention. A good                                                                                step down the gradient, then project to the constraints.
similarity measure should allow effective feedback. In                                                                               The scale of the step is chosen on a validation set of 20
our experiment, using a subset of 10 CDs, we investi-                                                                                queries, and then fixed.
gate the effectiveness of simple relevance feedback with                                                                                The average AP values over these 25 query images
different types of features. Because users will provide                                                                              are compared in Fig. 6, with different rounds of rele-
very little feedback (we use 5 positive and 5 negative                                                                               vance feedback. We can see that at the beginning, Flickr
examples), a good simulation of this task is demanding.                                                                              prediction features don’t work much better than visual
We use the same CDs as in [24], which are chosen                                                                                     features. However, with relevance feedback, prediction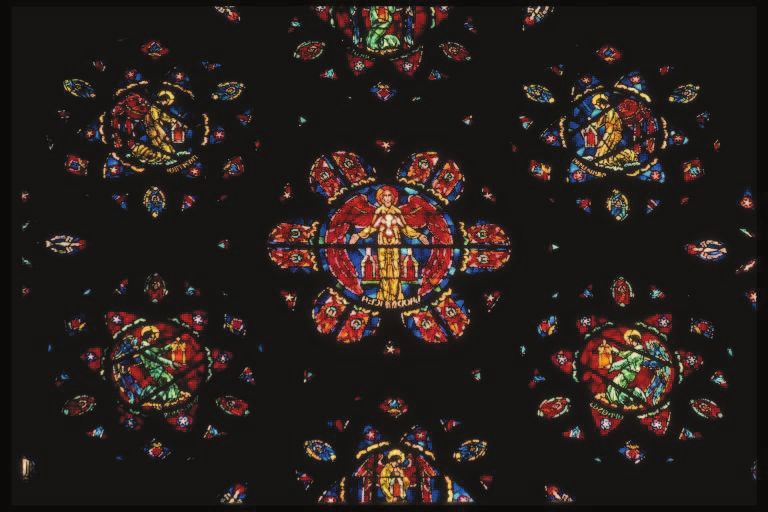
10

                 AP scores with different rounds of feedback                  We may want to access images via text based queries
      0.56
                                                Prediction features        (e.g., finding all the images associated with “cat”). In
                                                Visual features            our approach, each Flickr group is described by several
      0.54
                                                                           key words. When users input a word query, we can
      0.52                                                                 find the Flickr group whose description contains such
                                                                           a word. Then the corresponding Flickr group classifier
      0.50                                                                 is used to classify all the images to find relevant ones.
                                                                           We test this method on the Corel data set, with two
      0.48                                                                 queries “airplane” and “sunset”. There are about 38,000
                                                                           images in total, including 840 “airplane” images and 409
      0.46                                                                 “sunset” images. We rank the images according to the
                                                                           Flickr group classification scores. We get an AP value
      0.44                                                                 0.28 for “airplane” and 0.16 for “sunset”. In the 100 top
                                                                           ranked images for “airplane”, there are 52 true positives;
      0.42                                                                 in the 100 top ranked images for “sunset”, there are 26
             0              1            2                3
                                   Rounds                                  true positives. The Corel images which are most relevant
                                                                           to “sunset” and “airplane” are shown in Fig. 9 according
Fig. 6.  The average AP values with three rounds of feedback. The red      to the classification scores.
line shows the results with Flickr prediction features and the blue line
shows the results with visual features.
                                                                           4.2.2 Classification
                                                                           We can also use our Flickr group predictions as features
features perform much better. This suggests prediction                     for classification. In Table 4, we compare our prediction
features are more effective for feedback. One possible                     features with visual features. As implemented in [50], for
reason is that Flickr prediction features are more compact                 the visual features, we train a chi-square kernel machine
(only with 103 dimensions), while visual features have                     with the unified features (chi-square kernel is the state-
thousands of dimensions. We cannot learn a good dis-                       of-the-art for histogram based image classification). Our
tance metric in high dimensional spaces when training                      group prediction features are not histograms, so we have
examples are scarce.                                                       to use an RBF kernel. Table 4 shows that our features are
   Fig. 7 shows the nearest neighbor images without                        usually more effective than the visual features that are
relevance feedback and the nearest neighbor images after                   used to train the Flickr classifiers. Exceptions are objects
the first round of relevance feedback for a query image                    that are typically in the background, such as tables,
(using our Flickr prediction features). The selected neg-                  chairs, and bottles. This shows our Flickr prediction
ative images are shown in red and the selected positive                    features are also effective for the classification task.
images are shown in green. We can see no false positives
are found in the 45 nearest neighbor images after only
learning with 5 positive and negative images.                              5   C ONCLUSIONS        AND DISCUSSIONS
   One advantage of our method is that it can help us                      In this paper, we developed an approach to learn image
understand what makes two images similar. In Fig. 8, we                    similarity from Flickr groups. The motivation is that
show six pairs of similar Corel images. The text shows                     Flickr groups show how people would like to group
the Flickr groups which both of the images are likely                      similar images on the Internet. Then two query images
to belong to. For example, the first pair of images are                    can be considered similar if the are likely to belong
considered similar because they are both likely to belong                  to the same set of Flickr groups. We also described
to the following Flickr groups: mountains, castles, sheep,                 SIKMA, an algorithm to quickly train an SVM with
turtles, and cows.                                                         the histogram intersection kernel using tens of thou-
   Good image similarity measures can not only help                        sands of training examples. We use SIKMA to train
image matching, but also help image clustering, which                      classifiers that predict Flickr group memberships. Our
is also a popular way to organize images. We perform                       experimental results provide strong evidence that such
image clustering experiments on the images from the                        learned image similarity works better on many tasks
10 CDs listed above. We represent these images with                        such as image matching and unsupervised clustering
our prediction features and visual feature respectively.                   than directly measuring similarity with visual features.
We cluster these 1000 images into 15 clusters in an                           There are several explanations for the success of
unsupervised way (K-means). Each cluster is labeled                        learned image similarity. First, the predictions are dis-
with the most common CD label in this cluster. Then                        criminative, and are trained using tens of thousands of
each image is labeled by the cluster label accordingly.                    positive and negative training images. In our procedure,
The accuracy of Flickr prediction features is 0.559 and                    interesting visual patterns that are beneficial for match-
the accuracy of visual features is 0.503. This shows our                   ing and classification are preserved, while the others
learned similarity is also more effective for the image                    are abandoned. By mapping a new query image to this
clustering task.                                                           space, we can measure how affinity with these visual
11
Query image 45 nearest neighbors without feedback
45 nearest neighbors after the first round of feedback
Fig. 7. The left column shows the query image; the center column shows the 45 nearest neighbors found with the Flickr
prediction features, the five negative images (in red) and five positive images (in green) are selected for feedback; after
one round of feedback, we get the 50 nearest neighbors shown in the right column.
mountains(3.0) castles(1.2) sheep(1.2) turtles(0.9) cows(0.6) dances(3.8) weddings(2.4) smiles(2.3) love(1.7) sports(1.4)
sports(2.6) dances(2.0) weddings(1.0) toys(0.5) horses(0.5) painting(2.4) art(1.2) macro-flowers(0.9) hands(0.9) skateboard(0.6)
fireworks(15.6) Christmas(7.6) rain(4.0) water drops(2.5) candles(2.0) painting(1.5) children(1.1) weddings(1.0) love(0.6) animals(0.6)
Fig. 8. Six pairs of similar Corel images. The text shows the top five Flickr groups which both of the images are likely to belong to. The value for
each group in the parenthesis is 100 × p(group | image1)p(group | image2).12
aeroplane bicycle bird boat bottle bus car cat chair cow
Visual features 0.647 0.399 0.450 0.540 0.207 0.425 0.577 0.388 0.439 0.273
Prediction features 0.650 0.443 0.486 0.584 0.178 0.464 0.632 0.468 0.422 0.296
table dog horse motorbike person plant sheep sofa train monitor
Visual features 0.373 0.343 0.657 0.489 0.749 0.330 0.324 0.323 0.619 0.322
Prediction features 0.208 0.377 0.666 0.503 0.781 0.272 0.321 0.268 0.628 0.333
TABLE 4
The AP value with Flickr prediction features and visual features on PASCAL 2007 classification for each object class.
The top 25 images relevant to “airplane”
[4] S. Belongie, J. Malik, and J. Puzicha. Shape matching and object
recognition using shape contexts. Pattern Analysis and Machine
Intelligence, IEEE Transactions on, 24(4):509–522, 2002.
[5] L. Bottou. Stochastic learning. Lecture notes in computer science,
pages 146–168, 2004.
[6] L. Bottou. Large-scale kernel machines. Mit Pr, 2007.
[7] C.C. Chang and C.J. Lin. LIBSVM: a library for support vector ma-
chines. Software available at http://www. csie. ntu. edu. tw/cjlin/libsvm,
80:604–611, 2001.
[8] J. Cui, F. Wen, R. Xiao, Y. Tian, and X. Tang. EasyAlbum: an
interactive photo annotation system based on face clustering and
re-ranking. In Proceedings of the SIGCHI conference on Human factors
in computing systems, page 376. ACM, 2007.
[9] N. Dalai, B. Triggs, I. Rhone-Alps, and F. Montbonnot. Histograms
of oriented gradients for human detection. CVPR, 1, 2005.
[10] R. Datta, D. Joshi, J. Li, and J.Z. Wang. Image Retrieval: Ideas,
Influences, and Trends of the New Age. Pennsylvania State
Fig. 9. The Corel images which are most relevant to the query
University Technical Report CSE, pages 06–009, 2006.
“airplane”, obtained by one-vs-all classification with our SIKMA method,
[11] J. Deng, W. Dong, R. Socher, L.J. Li, K. Li, and L. Fei-Fei. Imagenet:
trained on the Flickr airplane group. Images are ranked according to
A large-scale hierarchical image database. CVPR, 2009.
their classifier score.
[12] M. Everingham, L. Van Gool, CKI Williams, J. Winn, and A. Zis-
serman. The PASCAL Visual Object Classes Challenge 2007
(VOC2007) Results, 2007.
patterns. Second, the Flickr prediction features are very [13] R. Fergus, L. Fei-Fei, P. Perona, and A. Zisserman. Learning
compact. As in our implementation, they only have 103 object categories from google’s image search. In Proceedings of
the 10th International Conference on Computer Vision, Beijing, China,
dimensions, while traditional visual features may have volume 2, pages 1816–1823, October 2005.
thousands of dimensions. With compact representation, [14] K. Grauman and T. Darrell. The Pyramid Match Kernel: Discrim-
relevance feedback can be more effective because it inative Classification with Sets of Image Features. Proc. ICCV,
1(2):3, 2005.
deals with fewer parameters, as is confirmed by our [15] C.E. Jacobs, A. Finkelstein, and D.H. Salesin. Fast multiresolution
experiments. Third, the predictions are trained to agree image querying. In Proc SIGGRAPH-95, pages 277–285, 1995.
with human judgements, which seem to be based on [16] A.E. Johnson and M. Hebert. Using spin images for efficient object
recognition in cluttered 3D scenes. IEEE Transactions on Pattern
semantics. This means that our predictions should be Analysis and Machine Intelligence, 21(5):433, 1999.
better at predicting concept-based similarity than pure [17] J. Kivinen, AJ Smola, and RC Williamson. Online learning with
visual features. kernels. IEEE Transactions on Signal Processing, 52(8):2165–2176,
2004.
[18] N. Kumar, A.C. Berg, P.N. Belhumeur, S.K. Nayar, C. Zhou, S. Lin,
6 ACKNOWLEDGEMENT D. Bitouk, S. Dhillon, O. Cossairt, R. Ramamoorthi, et al. Attribute
and Simile Classifiers for Face Verification. ICCV, 2009.
This work was supported in part by the National Science [19] S. Lazebnik, C. Schmid, and J. Ponce. Beyond bags of features: S-
Foundation under IIS -0803603 and in part by the Office patial pyramid matching for recognizing natural scene categories.
In CVPR, 2006.
of Naval Research under N00014-01-1-0890 as part of the [20] T. Leung and J. Malik. Representing and recognizing the visual
MURI program. Any opinions, findings and conclusions appearance of materials using three-dimensional textons. IJCV,
or recommendations expressed in this material are those 43(1):29–44, June 2001.
[21] L.J. Li and L. Fei-Fei. Optimol: automatic online picture collection
of the author(s) and do not necessarily reflect those of via incremental model learning. International journal of computer
the National Science Foundation or the Office of Naval vision, 88(2):147–168, 2010.
Research. [22] L.J. Li, H. Su, E.P. Xing, and L. Fei-Fei. Object bank: A high-level
image representation for scene classification & semantic feature
sparsification. In Neural Information Processing Systems, 2010.
R EFERENCES [23] Y. Liu, D. Zhang, G. Lu, and W.Y. Ma. A survey of content-based
image retrieval with high-level semantics. Pattern Recognition,
[1] Vladimir Pavlovic Ameesh Makadia and Sanjiv Kumar. A new 40(1):262–282, 2007.
baseline for image annotation. In European Conference on Computer [24] N. Loeff and A. Farhadi. Scene Discovery by Matrix Factorization.
Vision, 2008. In Proceedings of the 10th European Conference on Computer Vision:
[2] K. Barnard, P. Duygulu, and D.A. Forsyth. Clustering art. In IEEE Part IV, pages 451–464. Springer-Verlag Berlin, Heidelberg, 2008.
Conf. on Computer Vision and Pattern Recognition, pages II:434–441, [25] D.G. Lowe. Distinctive Image Features from Scale-Invariant
2001. Keypoints. IJCV, 60(2):91–110, 2004.
[3] K. Barnard and D.A. Forsyth. Learning the semantics of words [26] S. Maji and A.C. Berg. Max-Margin Additive Classifiers for
and pictures. In Int. Conf. on Computer Vision, pages 408–15, 2001. Detection. ICCV, 2009.13
[27] S. Maji, A.C. Berg, and J. Malik. Classification using intersection Gang Wang is an Assistant Professor in Electri-
kernel support vector machines is efficient. In Proc. CVPR, 2008. cal and Electronic Engineering at the Nanyang
[28] Ameesh Makadia, Vladimir Pavlovic, and Sanjiv. A new baseline Technological University. He is also a Research
for image annotation. In ECCV, 2008. Scientist of the Advanced Digital Science Cen-
[29] A. Oliva and A. Torralba. Modeling the shape of the scene: a ter. He received the B.S. degree from Harbin
holistic representation of the spatial envelope. IJCV., 42, 2001. Institute of Technology, China, in 2005 and the
[30] J. Philbin, O. Chum, M. Isard, J. Sivic, and A. Zisserman. Object Ph.D. degree from the University of Illinois at
retrieval with large vocabularies and fast spatial matching. In Urbana-Champaign, Urbana. His research in-
IEEE Conference on Computer Vision and Pattern Recognition, 2007. terests include computer vision and machine
CVPR’07, pages 1–8, 2007. learning.
[31] J.C. Platt. Fast training of support vector machines using sequen-
tial minimal optimization. 1999.
[32] N. Rasiwasia, P.J. Moreno, and N. Vasconcelos. Bridging the gap:
Query by semantic example. IEEE Transactions on Multimedia,
9(5):923–938, 2007.
[33] Y. Rubner, C. Tomasi, and L.J. Guibas. A metric for distributions
with applications to image databases. 1998.
[34] Y. Rui, T.S. Huang, M. Ortega, and S. Mehrotra. Relevance
feedback: A power tool for interactive content-based image re-
trieval. IEEE Transactions on circuits and systems for video technology,
8(5):644–655, 1998.
[35] B.C. Russell, A. Torralba, K.P. Murphy, and W.T. Freeman. La-
belMe: a database and web-based tool for image annotation. IJCV,
2008.
[36] C. Schmid and R. Mohr. Local grayvalue invariants for image Derek Hoiem is an assistant professor in Com-
retrieval. IEEE Transactions on Pattern Analysis and Machine Intel- puter Science at the University of Illinois at
ligence, 19(5):530–535, 1997. Urbana-Champaign (UIUC). Before joining the
[37] F. Schroff, A. Criminisi, and A. Zisserman. Harvesting image UIUC faculty in 2009, Derek completed his Ph.D.
databases from the web. IEEE transactions on pattern analysis and in Robotics at Carnegie Mellon University in
machine intelligence, 2010. 2007, advised by Alexei A. Efros and Mar-
[38] S. Shalev-Shwartz, Y. Singer, and N. Srebro. Pegasos: Primal tial Hebert, and was a postdoctoral fellow at
estimated sub-gradient solver for SVM. In Proceedings of the 24th the Beckman Institute from 2007-2008. Derek’s
international conference on Machine learning, pages 807–814. ACM research on scene understanding and object
New York, NY, USA, 2007. recognition has been recognized with a 2006
[39] N. Snavely, S.M. Seitz, and R. Szeliski. Photo tourism: exploring CVPR Best Paper award, a 2008 ACM Doctoral
photo collections in 3D. In ACM SIGGRAPH 2006 Papers, page Dissertation Award honorable mention, and a 2011 NSF CAREER
846. ACM, 2006. award.
[40] M.J. Swain and D.H. Ballard. Color indexing. International journal
of computer vision, 7(1):11–32, 1991.
[41] M.J. Swain and D.H. Ballard. Color indexing. Int. J. Computer
Vision, 7(1):11–32, 1991.
[42] Y. Tian, W. Liu, R. Xiao, F. Wen, and X. Tang. A face annotation
framework with partial clustering and interactive labeling. In
2007 IEEE Conference on Computer Vision and Pattern Recognition,
pages 1–8. IEEE, 2007.
[43] K. Tieu and P. Viola. Boosting image retrieval. In cvpr, page 1228.
Published by the IEEE Computer Society, 2000.
[44] A. Torralba. Contextual priming for object detection. International
Journal of Computer Vision, 53(2):169–191, 2003.
[45] L. Torresani, M. Szummer, and A. Fitzgibbon. Efficient object
category recognition using classemes. Computer Vision–ECCV
2010, pages 776–789, 2010. David Forsyth (Fellow, IEEE) received the B.Sc.
[46] M. Varma and A. Zisserman. A statistical approach to texture and M.Sc. degrees in electrical engineering from
classification from single images. International Journal of Computer the University of the Witwatersrand, Johannes-
Vision, 62(1):61–81, 2005. burg, South Africa, and the D.Phil. degree from
[47] G. Wang and D. Forsyth. Object image retrieval by exploiting Balliol College, Oxford, U.K. He has published
online knowledge resources. In CVPR, pages 1–8, 2008. more than 100 papers on computer vision, com-
[48] G. Wang, D. Forsyth, and D. Hoiem. Comparative object similarity puter graphics, and machine learning. He is
for improved recognition with few or no examples. In CVPR, a coauthor (with J. Ponce) of Computer Vi-
2010. sion: A Modern Approach (Englewood Cliffs, NJ:
[49] G. Wang, A. Gallagher, J. Luo, and D. Forsyth. Seeing People Prentice-Hall, 2002). He was a Professor at the
in Social Context: Recognizing People and Social Relationships. University of California, Berkeley. He is currently
Computer Vision–ECCV 2010, pages 169–182, 2010. a Professor at the University of Illinois at Urbana-Champaign. Prof.
[50] G. Wang, D. Hoiem, and D. Forsyth. Building text features for Forsyth was Program Cochair for IEEE Computer Vision and Pattern
object image classification. In CVPR, 2009. Recognition (CVPR) in 2000, General Cochair for CVPR 2006, and
[51] G. Wang, D. Hoiem, and D. Forsyth. Learning Image Simi- Program Cochair for the European Conference on Computer Vision
larity from Flickr Groups Using Stochastic Intersection Kernel 2008 and the CVPR 2011. He received an IEEE Technical Achievement
Machines. ICCV, 2009. Award in 2005.
[52] J. Zhang, M. Marszalek, S. Lazebnik, and C. Schmid. Local fea-
tures and kernels for classification of texture and object categories:
A comprehensive study. IJCV, 73(2):213–238, 2007.
[53] L. Zhang, Y. Hu, M. Li, W. Ma, and H. Zhang. Efficient prop-
agation for face annotation in family albums. In Proceedings of
the 12th Annual ACM international Conference on Multimedia, pages
716–723. ACM, 2004.You can also read