Life Cycle Analysis of Renewable Fuel Standard Implementation for Thermal Pathways for Wood Pellets and Chips - LCA.6161.209.2021 June 5, 2021
←
→
Page content transcription
If your browser does not render page correctly, please read the page content below

Life Cycle Analysis of Renewable Fuel Standard
     Implementation for Thermal Pathways
           for Wood Pellets and Chips

                                     LCA.6161.209.2021
                                        June 5, 2021

                                           Prepared by:
                                        Stefan Unnasch
                                           Lucy Buchan
DISCLAIMER

This report was prepared by Life Cycle Associates, LLC under contract with Technology
Transition Corporation, on behalf of the Biomass Thermal Energy Council (BTEC). Life Cycle
Associates is not liable to any third parties who might make other use of this work. No warranty
or representation, express or implied, is made with respect to the accuracy, completeness,
and/or usefulness of information contained in this report beyond the above stated use. Finally,
no liability is assumed with respect to the use of, or for damages resulting from the use of, any
information, method or process disclosed in this report beyond the above stated use. In
accepting this report, the reader agrees to these terms.

                                  ACKNOWLEDGEMENTS

Life Cycle Associates, LLC thanks the Steering Committee for their review and insights into
biomass harvesting, transportation and processing operations, including field and plant
equipment and associated fuel use. The Steering Committee included the following members:
Lew McCreery, USDA Forest Service, Bill Strauss, Future Metrics, Dan Wilson and Steve
Knobeloch, Wilson Engineering Associates, Adam Sherman, Biomass Energy Resource Center,
Ken Adler and John Ackerly, Alliance for Green Heat, Terrence Sauve, OMAFRA/EMB, Timothy
Volk, SUNY ESF, Becky Phillips, Agricultural Utilization Research Institute, Maura Adams,
Northern Forest Center, Rob Davis, Forest Energy Corporation, Norbert Senf, MHA, , Jeremy
Mortl, Messersmith Manufacturing, Dane Floyd, Biomass Engineering and Equipment, Sabina
Dhungana, Heating the Midwest. Life Cycle Associates performed this study under contract to
Technology Transition Corporation (TTC). Peter Thompson, Project Coordinator, is the primary
contact person for TTC.

Contact Information:

Stefan Unnasch
Life Cycle Associates, LLC
1.650.461.9048
unnasch@LifeCycleAssociates.com
www.LifeCycleAssociates.com

Peter Thompson
Technology Transition Corporation, Biomass Thermal Energy Council
1.202.457.0868 x302
pthompson@ttcorp.com

www.ttcorp.com | www.biomassthermal.org
Recommended Citation: Unnasch. S. and L. Buchan (2021). Life Cycle Analysis of Renewable
Fuel Standard Implementation for Thermal Pathways for Wood Pellets and Chips, Life Cycle
Associates Report LCA.6161. 209.2021, Prepared for Technology Transition Corporation.

ii   |
CONTENTS
Executive Summary ................................................................................................................... vii
1. Introduction ........................................................................................................................1
  1.1 Study Contents..............................................................................................................1
  1.2 Background ...................................................................................................................2
  1.3 Regulation for Biofuels and Biomaterials .......................................................................2
  1.4 Renewable Fuel Standard (Federal) ...............................................................................2
  1.5 Feedstock and Pelleting Options ...................................................................................5
    1.5.1 Pellet Mill Operations ............................................................................................5
    1.5.2 Feedstock Categories .............................................................................................8
  1.6 Sustainable Biomass Production .................................................................................10
  1.7 Greenhouse Gases and Climate Change ......................................................................11
    1.7.1 The Greenhouse Effect .........................................................................................11
    1.7.2 Greenhouse Gases ...............................................................................................11
    1.7.3 Wildfire Risk .........................................................................................................11
    1.7.4 Biomass Composting ............................................................................................13
    1.7.5 Global Warming Potential ....................................................................................14
  1.8 Goal and Scope Definition ...........................................................................................17
  1.9 Life Cycle Assessment Background ..............................................................................17
    1.9.1 Upstream Life Cycle Data .....................................................................................19
2. Methods and Data .............................................................................................................20
  2.1 System Boundary ........................................................................................................20
    2.1.2 Life Cycle Analysis ................................................................................................21
  2.2 Scenarios for GHG Impacts ..........................................................................................27
  2.3 Data Sources ...............................................................................................................28
    2.3.1 Wood Pellets and Chips Production Energy Inputs ...............................................28
    2.3.2 Heating Oil and Natural Gas Upstream Emissions.................................................34
    2.3.3 Heating Value of Fuels .........................................................................................35
3. Life Cycle GHG Emissions ...................................................................................................37
  3.1 Wood Pellets and Chips LCA ........................................................................................37
  3.2 Heating Oil and Natural Gas LCA .................................................................................42
  3.3 Scenario Analysis ........................................................................................................43
4. Carbon Credit Programs ....................................................................................................45
  4.1 California Low Carbon Fuel Standard...........................................................................45
  4.2 Voluntary Credit Programs ..........................................................................................46
  4.3 Renewable Fuel Standard............................................................................................46
5. Conclusions .......................................................................................................................49
  Appendices ...........................................................................................................................55

iii   |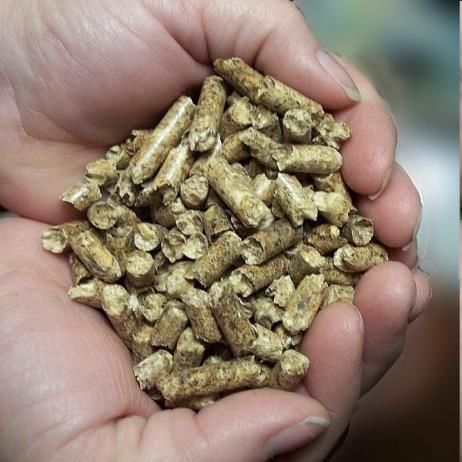
TABLES
Table 1. Product Definitions Under the RFS2 ...............................................................................3
Table 2. RIN Pathways for Cellulosic Feedstocks ..........................................................................4
Table 3. Alternative Fuel Volumes – Actual, Statutory, Proposed, and Finalized ..........................5
Table 4. RFS-Compliant Biomass Feedstocks for Wood Pellets and Wood Chips ..........................9
Table 5. Sources of Biomass under RFS........................................................................................9
Table 6. Open Field Burning Emission Factors ...........................................................................12
Table 7. Composting and Landfilling Emission Factors for Wood Waste ....................................14
Table 8. Global Warming Potential of GHG Pollutants ...............................................................15
Table 9. Life Cycle Models and Databases Used for Wood Pellet Production .............................18
Table 10. Bioenergy Scenarios Overview ...................................................................................28
Table 11. Feedstock Fertilizer Inputs .........................................................................................29
Table 12. Data for Diesel Consumption for Collection of Woody Feedstocks .............................29
Table 13. Diesel Inputs for Forestry Harvesting and Estimates for Forest Products Mill
Operations ................................................................................................................................30
Table 14. Woody Biomass Feedstock Parameters for Transport to Pelletizing Plants and
Associated GHG Emissions ........................................................................................................33
Table 15. GREET Upstream Emissions for Heating Oil and Natural Gas ......................................35
Table 16. Heating Values of Biomass Materials .........................................................................36
Table 17. GHG Emissions of Wood Pelletsa ................................................................................38
Table 18. GHG Emissions of Wood Chips ...................................................................................39
Table 19. GHG Emissions of Heating Oil and Natural Gas ...........................................................42
Table 20. Comparison of Valuation of Woody Biomass Fuel as Heating Fuel Under the RFS and
as Process Fuel Under the LCFS .................................................................................................48

iv   |
FIGURES
Figure 1. Locations of wood pellet mills in North America. ..........................................................6
Figure 2. Wood pellet feedstock sourcing. ...................................................................................7
Figure 3. Biomass pelletization process. ......................................................................................7
Figure 4. Pellet plant costs. .........................................................................................................8
Figure 5. The RFS2 prohibits the use of forest residue from tree plantations on federal land. ...10
Figure 6. Particulate emissions associated with heating fuels. ...................................................16
Figure 7. Process Framework for Life Cycle Assessment. ...........................................................18
Figure 8. System boundary diagram for Life Cycle Assessment. .................................................20
Figure 9. Carbon Balance for biofuels and fossil fuels. ...............................................................23
Figure 10. U.S. Timber Growth and Removals............................................................................24
Figure 11. Incremental carbon storage (in tonnes) for a forest stand scenario compared to fossil
fuel combustion ........................................................................................................................25
Figure 12. Incremental carbon storage and associated emissions in sustainably harvested
forests. ......................................................................................................................................26
Figure 13. Relative moisture content of different states of woody biomass...............................30
Figure 14. North American Electric Reliability Corporation Regions. ..........................................34
Figure 15. Life cycle GHG emissions from biomass pellets. ........................................................41
Figure 16. Life cycle GHG emissions from wood chips................................................................42
Figure 17. CI of heating oil, natural gas and their renewable alternatives. .................................44
Figure 18. Performance targets for the California Low Carbon Fuel Standard. ...........................45
Figure 19. Price per ton for credits generated by the California Low Carbon Fuel Standard. ......46
Figure 20. Value of renewable identification number (RIN) credits generated under the
Renewable Fuel Standard. .........................................................................................................47

v   |

TERMS AND ABBREVIATIONS
ANL      Argonne National Laboratory
AR       As Received, weight includes moisture
ARB      California Air Resources Board
BD       Bone dry
Btu      British Thermal Unit
CA       California
CI       Carbon intensity
CO       Carbon monoxide
CO2      Carbon dioxide
CO2e     Carbon dioxide equivalent
CWD      Coarse Woody Debris
EPA      U.S. Environmental Protection Agency
g CO2e   Grams of carbon dioxide equivalent
GHG      Greenhouse Gas
GREET    The Greenhouse gas, Regulated Emissions, and Energy use in
         Transportation model
GWP      Global Warming Potential
HHV      Higher Heating Value
LCA      Life Cycle Analysis or Life Cycle Assessment
LCFS     Low Carbon Fuel Standard
LHV      Lower Heating Value
MC       Moisture Content
MJ       MegaJoule
MMBtu    Million Btu
N2O      Nitrous oxide
NG       Natural gas
NOx      Oxides of nitrogen
RIA      Regulatory Impact Analysis
RFS2     Revised Federal Renewable Fuels Standard
UWW      Urban Wood Waste
VOC      Volatile Organic Compound
WTT      Well-To-Tank
WTW      Well-To-Wheels

vi   |
EXECUTIVE SUMMARY
The Biomass Thermal Energy Council (BTEC) and the United States Department of Agriculture
(USDA) Forest Service are examining the possibility of adding biomass thermal conversion as a
fuel pathway to Renewable Fuel Standard (RFS). This Study evaluates the usage of wood chips
and wood pellets as substitutes for fossil heating oil and natural gas for the U.S.

Currently, the EPA RFS2 does not include a fuel pathway for woody biomass as a heating fuel;
however, this Rule includes numerous pathways that use biomass, including forest residue, as
feedstock to produce liquid biofuels which replace fossil fuels. Woody biomass itself is a source
of energy if burned in wood stoves or boilers, and can reduce greenhouse gas (GHG) emissions
if substituted for fossil fuels such as heating oil and natural gas. Since woody biomass is
categorized under the RFS2 as a renewable source of energy when sustainable forest practices
are employed, and since its use results in significantly lower GHG emissions compared to fossil
fuels, the use of biomass as a heating fuel under the RFS2 would be consistent with the
application of the Rule. Moreover, since heating oil from cellulosic biomass has a defined
pathway under RFS (L, D7) (Table 2), and wood pellets and wood chips are substitutes for fossil
heating oil, woody biomass replacing heating oil or natural gas should qualify for a pathway
under the RFS2.

The GHG emissions of wood pellets and wood chips produced from various biomass waste
sources including, forest residue, forest products mill waste, urban wood waste, fire hazard
reduction/insect-killed standing dead trees, and pulp wood planted trees were estimated using
Argonne National Laboratories’ GREET1_2019 model1 to determine upstream life cycle inputs.
The treatment of sustainable forestry practices was also examined.

The range of life cycle GHG emissions were 0 to 7.0 g CO2e/MJ for wood chips and 0 to 23.5 g
CO2e/MJ for wood pellets. In many situations the avoided emissions associated with burning
waste biomass, avoided wildfire risk, or composting are greater than the life cycle emissions
from pellet fuel use. These ranges depend on multiple factors, and are largely influenced by
emissions associated with feedstock and product transportation, and in the case of wood
pellets, energy to dry and pelletize feedstock. The emissions associated with wood pellet fuel
represent approximately 3% of this fuel’s energy value. The GHG emissions of natural gas and
heating oil, two predominant fuels used for heating, were calculated using GREET1_2019, as
well as the older version of GREET (_1.8c) that was employed in the RFS2 regulatory impact
analysis. Biomass fuels result in a 65 to over 100% reduction in GHG emissions in comparison to
these conventional heating fuels, which exceeds the targeted 60% GHG reduction requirement
for cellulosic biofuels under the RFS2 (EPA, 2010). GHG reduction programs such as the RFS and
the California LCFS express life cycle GHG emissions on a comparable basis, per megajoule (MJ)
of energy, which is the functional unit of analysis. This functional unit, as described in Section
2.1, provides a consistent point of comparison for fuels used in comparable applications. In the
case of wood pellet fuel, a MJ of energy from wood pellets provides the same heating effort as

1
    All GREET models are peer-reviewed and calculate life cycle emissions based on energy inputs.

vii   |
a MJ of space-heating oil. The GHG emissions per tonne of wood pellet fuel are also calculated
in this Study. However, due to differences in composition and moisture content comparison,
using the energy basis is desirable.

Since wood pellets and wood chips meet the GHG reduction targets under the RFS, are often
made from waste biomass sourced from forest product mills, forest residue, fire hazard
reduction, and culling of insect-infested standing dead trees, and have a significantly lower CI
compared to heating oil and natural gas, it is recommended that EPA reevaluate the RFS and
consider creating a pathway for thermal conversion of biomass as heating energy. Bipartisan
legislation, S.1614, introduced in 2019 by U.S. Senator Ron Wyden, D-Oregon proposed to allow
the use of biomass waste from certain federal lands for making renewable fuels, indicating a
record of congressional support for this recommendation.

viii   |

1. INTRODUCTION
The Biomass Thermal Energy Council (BTEC) and the United States Department of Agriculture
(USDA) Forest Service made an agreement to assess the implications of adding biomass thermal
conversion as a fuel pathway to the Renewable Fuel Standard (RFS). The scope of the
agreement is to promote usage of sustainably harvested wood chips and wood pellets as
substitutes for fossil heating oil and natural gas.

Life Cycle Associates, LLC was contracted to complete a life cycle analysis of the greenhouse gas
(GHG) emission impacts (this Study) associated with utilizing woody biomass (pellets and chips)
for thermal energy applications. The alternative fuel use is heating oil or natural gas2. The major
steps of the life cycle analysis implemented in this Study are:

1) Quantify life cycle GHG emissions associated with using woody biomass feedstocks currently
   eligible under the Renewable Fuel Standard (RFS) for use in thermal energy applications.
   Two pathways are considered: wood chipped directly from eligible feedstocks, and wood
   pellets produced from eligible feedstocks;

2) Quantify life cycle greenhouse gas emissions associated with using fossil fuels for thermal
   energy applications. Two fuels are considered: natural gas and heating/fuel oil;

3) Compare the life cycle greenhouse gas emissions for the woody biomass thermal applications
   with those of the fossil fuels considered; and

4) Compare the greenhouse gas benefits/impacts of these pathways for using eligible woody
   biomass feedstocks to those already approved for Renewable Identification Number (RIN)
   generation in the RFS.

    1.1 Study Contents
This Study includes the following sections:
    1. Introduction
    2. Methods and Data
    3. LCA Results
    4. Sustainability Assessment
    5. Conclusions

Section 1 provides an introduction to the woody biomass, GHG emissions, and LCA. The
methods and data used in the Study are described in Section 2, which includes a description of
upstream fuel cycle inputs, as well as the energy inputs for wood pellet and chip production
and other data. Section 3 takes the data in Section 2 and estimates the environmental impacts
of wood pellets and chips used in heating and compares them with those of heating oil and

2
 This Study calculates the GHG reductions based on different displaced fuels. While natural gas is not considered a
baseline fuel under the RFS, the comparison is still of interest.

1   |
natural gas. Section 4 provides an overview of current sustainability programs in the US. Section
5 summarizes the conclusions of this Study.

     1.2 Background
Recently, agriculture and forestry have emerged as potential mechanisms to meet U.S. energy
demands and to address resource and climate change concerns through biomass-based energy.
The potential benefits, such as increased domestic energy security, reduced GHG emissions,
and increased support for rural and agricultural economic development, have focused the
attention of industry, policymakers, and the environmental and scientific communities on the
development of biomass-based energy. Since agriculture, forestry, and energy production all
have significant impacts on resources and the environment, developing sustainable3 production
methods and consumption patterns in each of these sectors is critical.

     1.3 Regulation for Biofuels and Biomaterials
Use of biofuels is on the rise in the United States. An important driver of the increased use of
biofuels in the United States is the federal and state level regulations and tax incentives that
have been passed over the past decades. The Federal Renewable Fuel Standard program was
created to reduce greenhouse gas emissions and expand the renewable fuels sector while
reducing reliance on fossil fuels.

1.4 Renewable Fuel Standard (Federal)
The Renewable Fuel Standard (RFS) was signed into law under the Energy Policy Act of 2005,
and was expanded through the Energy Independence and Security Act of 2007 (EISA). The RFS
program establishes requirements for volumes of renewable fuel that must be blended into on-
and off-road petroleum fuels, with the dual goals of increasing energy independence and
reducing climate change impacts. The RFS legislation falls under the Clean Air Act (CAA), and
the Environmental Protection Agency (EPA) has the responsibility of setting annual renewable
standard amounts. The RFS2, the current set of regulations enacted in 2007, requires the use of
36 billion gallons of renewable fuel annually by 2022 in the United States, 21 billion of which
must be non-cornstarch ethanol biofuels such as cellulosic biofuel or biomass-based diesel. It
required the use of 16.55 billion gallons of renewable fuel in 2013, 1.28 billion gallons of which
had to be biomass-based diesel substitutes. However, production of cellulosic biofuels has so
far been well below required levels (EIA, 2012; EPA, 2020).

Under the RFS2, gasoline and diesel fuel refiners and importers are required to purchase a
certain quantity of renewable fuels annually. This is called their Renewable Volume Obligation.
In order to verify that their obligations have been met, refiners must submit renewable fuel
credits to the EPA. These tradable credits are called Renewable Identification Numbers (RINs),
which are generated through the production of biofuels. One RIN corresponds to 1 gallon of
ethanol equivalent. RINs are generated when renewable fuels can be shown to achieve a
certain percentage reduction in life cycle greenhouse gas emissions as compared to a

3
    See Reijnders (2006) for a discussion of sustainable forestry management practices.

2   |
petroleum fuel baseline. The emissions are measured in terms of kilogram of emissions per MJ
of fuel, commonly known as a fuel’s carbon intensity (CI). The required reduction percentage
varies by biofuel. Currently, this percentage is 20% for corn ethanol, 50% for advanced biofuels,
and 60% for cellulosic biofuels. Table 1 shows the official RFS definitions for the renewable fuels
covered in the regulation.
Each batch of renewable fuel is assigned a unique identifier that applies to a given calendar
year and producer, and this is its renewable identification number (RIN). A batch can be any
volume less than 1 million gallon-RINs. A RIN is assigned to a batch of fuel at the time when its
ownership is being transferred (EPA, 2012).
Table 1. Product Definitions Under the RFS2
Products RFS2 Definition
Advanced a renewable fuel, other than ethanol derived from cornstarch, that has life
biofuel cycle greenhouse gas emissions that are at least 50 percent less than
baseline life cycle greenhouse gas emissions.
Biomass-based a renewable fuela that has life cycle greenhouse gas emissions that are at
diesel least 50 percent less than baseline life cycle greenhouse gas emissions and
meets all of the requirements of paragraph (1) of this definition:
(i) Is a transportation fuel, transportation fuel additive, heating oil, or
jet fuel.
(ii) Meets the definition of either biodiesel or non-ester renewable
diesel.
(iii) Is registered as a motor vehicle fuel or fuel additive under 40 CFR
part 79, if the fuel or fuel additive is intended for use in a motor
vehicle.
Biodiesel a mono-alkyl ester that meets ASTM D 6751 (incorporated by
reference, see §80.1468).
Cellulosic a renewable fuel derived from any cellulose, hemi-cellulose, or lignin that
biofuel has life cycle greenhouse gas emissions that are at least 60 percent less
than the baseline life cycle greenhouse gas emissions.
Cellulosic diesel Any renewable fuel that meets both the definitions of cellulosic biofuel
and biomass-based diesel, as defined in this section 80.1401. Cellulosic
diesel includes heating oil and jet fuel made from cellulosic feedstocks.
Renewable a blendstock made from renewable biomass that is composed of only
gasoline hydrocarbons and which meets the definition of gasoline blendstock in
blendstock §80.2(s).
Non-ester A renewable fuel which is all of the following:
renewable (1) A fuel which can be used in an engine designed to operate on
diesel (NERD) conventional diesel fuel, or be heating oil or jet fuel.
(2) Not a mono-alkyl ester.
a
Note that a renewable fuel that is co-processed with petroleum is not considered to be biomass-based
diesel.
3 |Table 2 describes several pathways for cellulosic biofuels (table excerpted from 40 CFR 80.146)
made from waste feedstocks that would otherwise decompose and produce GHG or might be
repurposed into lower-value products such as crop residue. As the RFS endorses converting
vegetative waste streams into high-value heating oil in exchange for the highest-value RIN (D3),
it logically follows that cellulosic feedstock such as slash, pre-commercial thinnings, and tree
residue ought to be similarly endorsed under the RFS for the purpose of space-heating via
cellulosic (wood) pellets. In the U.S., wood pellets and cord wood account for approximately 2
percent of the primary residential space heating fuel (Voegele, 2019). The Northern Forest
Region of New England (Buchholz et al., 2017) as well as many other regions in the U.S. are
well-situated to support switching to wood pellet heat and to utilize wood chips as heating fuel.
Table 2. RIN Pathways for Cellulosic Feedstocks
Production
Path Fuel Type Feedstock Process D-Code
Requirements
Cellulosic biomass from crop residue,
slash, pre-commercial thinnings and tree
7
Cellulosic residue, annual cover crops, switchgrass,
(cellulosic
diesel, miscanthus, energy cane Arundo donax
biofuel or
L jet fuel and and Pennisetum purpureum; cellulosic Any
biomass-
heating components of separated yard waste;
based
oil. cellulosic components of separated food
diesel)
waste; and cellulosic components of
separated municipal solid waste (MSW).
Must utilize
Cellulosic biomass from crop residue,
natural gas,
slash,
Renewable biogas,
pre-commercial thinnings and tree
gasoline and/or
residue, annual cover crops; cellulosic 3
and biomass as
M components of separated yard waste; (cellulosic
renewable the only
cellulosic components of separated food biofuel)
gasoline process
waste; and
blendstock. energy
cellulosic components of separated
sources
MSW.
Currently, the EPA RFS2 does not include a fuel pathway for biomass as process fuel or space-
heating fuel, however, there are numerous pathways that use biomass, including forest residue,
as feedstock to produce biofuels that replace fossil fuels. Included in these pathways are
biomass to space-heating oil pathways. Biomass itself is a source of energy. When burned in
wood stoves or boilers, or industrial boilers as a substitute for fossil fuels, it can reduce GHG
emissions. Sustainable forest management practices enable the monitoring and verification of
best harvesting practices4 and assure that the net carbon balance of a forest is neutral, with
4
Per Sustainable Forest Management Standards (Sustainable Forestry Initiative, 2019).
4 |new growth making up for harvested material. In addition, the RFS has specific requirements
for the treatment of slash and thinnings5 with additional insight from Forest Service
Publications (Power, 2013; Graham, 1999).
Since biomass-based fuel qualifies as a renewable feedstock under the RFS (Table 3), its use for
heating would be consistent with RIN generation under the RFS2. Moreover, since heating oil
from cellulosic biomass has a defined pathway under the RFS (L, D7) (Table 2), and wood pellets
and wood chips are substitutes for fossil heating oil, their treatment as an additional fuel under
pathway L would also follow.
Table 3. U.S. Renewable Fuel Volumes Produced under RFS2
Fuel Volumes (Billion Gallons/year)
2019 2020 2020 2020 2021
EPA EPA EPA
Actual Statutory
Fuel Category Proposed Final Final
Cellulosic biofuel 0.42 10.5 0.54 0.59 N/A
Biomass-based diesel 2.1 ≥1.0 N/A 2.43 2.43
Advanced biofuel 4.92 15 5.04 5.09 N/A
Renewable fuel 19.92 30 20.04 20.09 N/A
1.5 Feedstock and Pelleting Options
Wood pellets and wood chips are two common forms of biomass fuels. Wood pellets are
primarily used for residential and small commercial heating, while wood chips are used for
commercial and institutional heating.
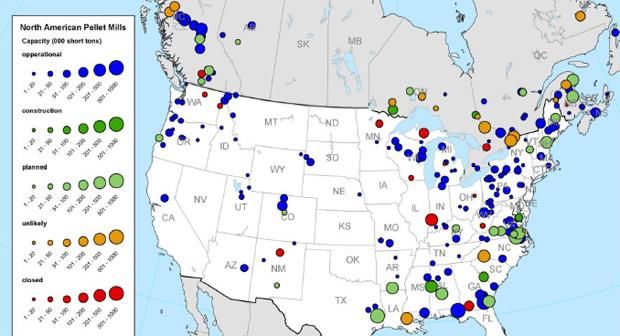
1.5.1 Pellet Mill Operations
Wood pellet mills are located throughout North America and are most abundant in the eastern
third of the U.S. (Figure 1. Locations of wood pellet mills in North America. Wood pellets are
made from various woody biomass sources within their regions, however, in order to comply
with RFS and generate RINs, sources should correspond to one of the biomass types required
under the RFS. The source of woody biomass feedstock can be classified into two main
categories: wood residue and harvested trees. According to the RFS, in order to use harvested
trees from tree plantations for bioenergy purpose, the bioenergy must be obtained from non-
federal lands.
Wood pellets serve several markets including industrial and home heating for domestic use as
well as export to Europe. Many pelleting operations serve local markets, however, those
exporting to Europe are predominantly located in the southeastern U.S.
5
https://www.epa.gov/fuels-registration-reporting-and-compliance-help/what-materials-non-federal-forestlands-
meet
5 |The function of pelleting is to take woody biomass feedstock and process it though a pelleting
mill to produce pellets that meet moisture specifications. Pellet processing is powered by
biomass fuel or natural gas. Mechanical work required to move or cut/chip source material at
pellet plants is accomplished using electric power. This analysis considers both natural gas and
biomass energy sources.
Figure 1. Locations of wood pellet mills in North America.
Source: Thran et al., 2017.
Woody Biomass Processing Description
This section provides a brief overview of the steps required to convert raw material woody
biomass into woodchips and pellets.
Feedstock collection/transportation/production
Feedstock is sourced from a variety of woody biomass (for example, see Figure 2 for pellet
sourcing). The amount of energy consumed to collect and transport woody biomass feedstock
varies depending on a number of factors, including whether the source is from urban or
forested areas, whether it is chipped in the field or transported to a chipping mill, the distance
traveled from source location to either storage facility or chipping/pellet mill, and the type of
fuel used to power the in-field chippers, transportation vehicles, as well as equipment in the
chipping facilities, including forklifts and chipping machines. Emissions associated with
renewable power sources will be lower than for conventional fossil-based fuels, such as diesel.
Transport Distances
Typically finished product wood chips and pellets require two phases of transport: distance
travelled from the feedstock source to a chipping or pelleting plant, and distance travelled from
the chipping or pelleting plant to market. In some cases, woody biomass feedstock may be
chipped at the source location, for example, within a forest, and shipped directly to market.
6 |Figure 2. Wood pellet feedstock sourcing.
Source: Drax, 2014.
Pelletization Process
The biomass pelletization process
consists of multiple steps including
raw material preparation,
pelletization and post-treatment.
Feedstock preparation includes
selecting suitable feedstock,
filtration to remove unwanted
materials, debarking and chipping,
storing excess material, drying,
cutting feedstock to appropriate
size in a hammer mill, pelletizing,
cooling, packaging, and shipping
(Figure 3).
The moisture content (MC) in
biomass feedstock can vary greatly.
For example, freshly cut forest
residue and urban tree
removal/trimmings are typically
about 50% moisture, ranging from
35-60% depending on vegetation
Figure 3. Biomass pelletization process. type and time of year when
Source: Zafar, 2020. harvesting occurs (Badger, 2002).
Moisture content at time of
7 |transportation from source area is typically 45% (Argonne National Labs, 2019). Drier biomass
feedstocks include insect-infested forest residue (10 – 16% MC (for lodgepole pine, Page et al.,
2014)) and shipping pallets and donnage (12 - 15% MC (Donovan, 1994)). The maximum
moisture content permissible for wood to be used as a fuel is in the range of 65 to 68 percent
(Badger, 2002). Above this moisture content, the energy required to evaporate the moisture is
greater than the energy in the dry matter of wood, and combustion cannot be sustained
without a supply of external energy. Therefore, feedstock moisture content is an important
operational parameter to factor into an LCA, as it needs to be reduced to 10 to 15% prior to
pelletization. The wood pellet product moisture content is typically 6 to 10% (MA Division of
Energy Resources, 2007; Pellet Fuels Institute, 2020).
The feedstock drying process is energy
intensive and can account for 70% of the
total energy used in the pelletization
process, and approximately 25% of the
cost to run a pellet plant (Figure 4).
Rotary drum dryers are the most
common equipment used for this
purpose. A typical industrial-level wood
pellet mill has the capacity to run two
rotary dryers (Biomass Magazine, 2020).
Superheated steam dryers, flash dryers,
spouted bed dryers and belt dryers can
also be used. Drying increases the
efficiency of biomass and produces
virtually no smoke on combustion.
Feedstock chipping comprises a
considerable portion of a plant’s
processing energy. A typical industrial
pellet plant is equipped with
Figure 4. Pellet plant costs. approximately two 1,200 horsepower
Source: Huang, 2013. (hp) chipper lines, and ten 400 hp
hammer mills (Biomass Magazine, 2020).
1.5.2 Feedstock Categories
The source of woody biomass feedstock falls into two main categories: wood residue and
harvested trees. According to the RFS, in order to use harvested trees from tree plantations for
bioenergy purpose, the biomass must be obtained from non-federal lands (Table 4 and 5).
8 |Table 4. RFS-Compliant Biomass Feedstocks for Wood Pellets and Wood Chips
Feedstock Source Land Type Current Fate
per RFS
a
Clean sawdust from Planted trees Non-federal MDF/particleboard/
sawmill and planning forestland wood pellets/animal
mills bedding/mulch/energy/
landfilling/pile decomposition
a
Clean sawdust from Planted trees Non-federal Pellets, mulch, landfill, energy
furniture industry forestland
Salvaged material Pre-commercial Non-federal Firewood/hog fuel/
(insect/disease, ice thinnings/ forestland decomposing to CO2/fire/on-
storms, wind events), salvage harvest site burning
fire hazard reduction
Logging residue Slash/pre-commercial Non-federal On site burning/ hog
thinnings/ forestland fuel/slash piles/ firewood
planted trees
Urban wood waste Non-federal Landfilling/composting/
b
(UWW) lands mulch/pile decomposition
Hardwood and Planted and naturally Non-federal Pulp and paper
softwood pulpwood regenerated trees lands
a
Trees and tree residue from actively managed tree plantations on non-federal land cleared at any time
prior to December 19, 2007 (US EPA, 2010). These are primarily located in VA, GA, and SC.
b
The portion of the wood waste stream that can include sawn lumber, pruned branches, stumps, and
whole trees from street and park maintenance. The primary constituents of UWW are used lumber,
trim, shipping pallets, trees, branches, and other wood debris from construction and demolition clearing
and grubbing activities (CalRecycle, 2020). Construction debris is not a likely RFS feedstock since the
source of the wood cannot be readily proven.
Table 5. Sources of Biomass under RFS
Category Federal Land Non-Federal Land
Slash/Residue from tree plantation No Yes
Natural Forests TBDa Yes
Harvest from plantations No Yes, if planted before 2007b
a
The RFS rule explicitly prohibits the use of tree residue from tree plantations on federal land. The
language in this exclusion does not prohibit the use of tree residue from natural forests such as those
damaged by bark beetles. The use of these materials is subject to interpretation from the EPA.
b
Definition of plantation varies by region.
While the prohibition (Figure 5) on removal of slash and residue from non-plantation (natural
forest) federal lands is unclear, slash and wood residue generate GHG through decomposition,
planned burns, and wildfires. As demonstrated in this Study, were EPA to interpret the
collection of slash and tree residues from federal lands as allowable under the RFS, such
residues could have alternative fates involving more favorable climate effects.
9 |Cellulosic residues are defined under the RFS and include planted trees from actively managed tree plantations on non-federal land. The regulatory impact analysis EPA (2010) defines a tree plantation as a stand of no less than one acre composed primarily of hand-planted or machine- planted trees, however, trees originating from natural seeding by mature trees growing on a plantation can also be categorized as renewable biomass. Therefore, EPA’s definition excludes materials from forests that are managed to allow natural tree regrowth in the Lake States, Northern New England, Central Appalachians, and other regions. Including such managed forests in the RFS would require revisions to its definition of renewable biomass. Converting planted tree residue to wood pellets, however, may generate stakeholder concern due to net carbon balance, or indirect land use conversion. Figure 5. The RFS2 prohibits the use of forest residue from tree plantations on federal land. Source: EPA, 2013. The RFS2 prohibition, as stated in Figure 5, does not exclude the use of thinnings and residues from non-tree-plantation federal lands. The use of non-federal lands, however, is the most straightforward source of forest material under the RFS. 1.6 Sustainable Biomass Production The use of woody biomass for energy purposes has been increasing in recent decades, implying the importance of woody resources in sustainable economies, due to opportunities to replace consumption of fossil fuel with renewable resources and reduce GHG emissions (Quinteiro et al., 2019). While some argue that harvesting woody biomass for bioenergy production endangers biodiversity and reduces carbon stock in forests, several studies have shown that harvesting biomass from sustainably managed forest lands for bioenergy purposes 10 |
not only reduces the GHG emission by reducing fossil energy usage but also increases the
carbon stock in forests (Dale et al., 2017; Kim et al., 2018; IEA Bioenergy, 2018).

Dale et al. (2017) studied the impact of wood-based pellet production on forest conditions in
the southeastern United States by using the U.S. Department of Agriculture Forest Service
(USFS) Forest Inventory and Analysis (FIA) annual survey data for 2002–2014. In this study
several fuelsheds including Chesapeake, Virginia, and Savannah, Georgia, were assessed. The
results showed that production of wood-based pellets in the southeast US enhances GHG
sequestration. In another study, Kim et al. (2018) evaluated the impact of growth in biomass
demand on global forests and concluded that bioenergy expansion can drive forest resource
investment at the intensive and extensive margins, resulting in a net increase in forest carbon
stocks for most regions of the world, including the U.S.

 1.7 Greenhouse Gases and Climate Change
 1.7.1 The Greenhouse Effect
The greenhouse effect is a natural process that results in warmer temperatures on the surface
of the earth than that which would occur without it. The effect is due to concentrations of
certain gases in the atmosphere that trap heat as infrared radiation from the earth is re-
radiated back to outer space. The greenhouse effect is essential to the survival of most life on
earth, by keeping some of the sun’s warmth from reflecting back into space and sustaining
temperature that make the Earth livable (Myhre et al., 2013).

1.7.2 Greenhouse Gases
The gases emitted globally that contribute to the greenhouse effect are known as greenhouse
gases (or GHG). Primary GHG include water vapor, carbon dioxide (CO2), methane (CH4), nitrous
oxide (N2O), and other trace gases. Natural sources of GHG include biological and geological
sources such as plant and animal respiration, forest fires and volcanoes. However, industrial
sources of GHG are the primary concern. The GHG of primary importance are CO 2, CH4, and N2O
because they represent the majority of the GHG emitted by industry. Because CO 2 is the most
abundant of these gases, GHG are usually quantified in terms of CO2 equivalent (CO2e), based
on the relative longevity in the atmosphere and the related global warming potential (GWP).

1.7.3 Wildfire Risk
The increase in the size and acreage burned by wildfires, particularly in the Western US, is
another risk of great concern associated with climate change (Congressional Research Service,
2019). Although wildfire is not a factor in the RFS, it effectively displaces wood combustion, and
therefore is factored into this analysis as an alternative fate. Recent bark beetle infestations
(Collins et al., 2012) and drought (Stephens et al., 2018) have also resulted in widespread tree
mortality and caused concern regarding the associated increased fuel load. Climate change and
disease have increased wildfire risk, creating a concern that wildfires are inevitable, and
therefore, a pragmatic solution for harnessing this fuel load into predictable and useable fuel
sources is a good idea. Wildfires result in much higher methane emissions than combustion in a

11   |
stove and presumably less than decomposition (US EPA, 1995; CARB, 2000; CARB 2020a). Table
6 lists emission factors used in regulatory contexts (US EPA, 1995; Jenkins, 1996; Argonne
National Laboratory, 2019), and otherwise reported (Akagi et al., 2011; Springsteen et al., 2011;
Urbanski, 2013; Whittaker et al., 2016) illustrating that values for the GREET model used in this
Study approximate the median of these reported ranges.

Table 6. Open Field Burning Emission Factors
                                                                 Emission Factors g/dry kgc
 Data Source            System                                 CH4          N2 O         CO2
 Prichard et al.,                                             4.294        1.304        1595.6
 2020a                  Forest                             (3.387 SD) (0.839 SD)      (166.2 SD)
 Argonne National
 Laboratory, 2019       Sugarcane Bagasse                      2.7           0.07           1660
 California Air
 Resources Board,
 2018a b, c             Rice Straw                           1.17            0.02           1830
                        SE Conifer, Prescribed            2.32 (1.09)     0.16 (0.21)    1703 (171)
                        SW Conifer, Prescribed            3.15 (0.91)     0.16 (0.21)     1653 (34)
                        NW Conifer, Prescribed            4.86 (1.37)     0.16 (0.21)     1598 (39)
 Urbanski, 2013a,d
                        Western Shrubland
                        Prescribed                        3.69 (1.36)     0.25 (0.18)     1674 (38)
                        NW Conifer Wildfire               7.32 (0.59)     0.16 (0.21)     1600 (19)
 Springsteen et al.,
 2011a                  Woody Biomass Open Piles               3             N/A            1833
 Akagi et al., 2011a    Temperate Forest                  3.92 (2.39)     0.16 (0.21)     1637 (71)
                        Crop Residue                      5.82 (3.56)        N/A         1585 (100)
 U.S. EPA, 1995
 (AP42)                 Conifer Logging Slash, Piled        1.0 - 8.5f       N/A             NA
                        Pile Burn                           1.0 - 4.7g       N/A             NA
Values reported in brackets represent authors' estimates of observed parameter variation, unless
otherwise specified as standard deviation (SD).
a
  These references report multiple emission factors from previously conducted studies.
b
  Based on Jenkins, 1996; unit is % of fuel dry mass.
c
  For this Study, 3 g CH4/dry kg and 0.16 g N2O/dry kg. This is a conservative value within the reported
range presented here.
d
  N2O values listed are from Akagi et al., 2011.
e
  A wide range of methane and nitrous dioxide have been attributed to avoided wildfire. For the
  purposes of this study, the methane estimates from Springsteen, 2011 and Akagi et al.,2011 provided
  an estimate of the GHG intensity (15,073 g CO2e/MMBtu, HHV) with the AR4 GWP factors.
f
  Reported range reflects the following combustion categories: flaming, fire, and smoldering
g
  Range reflects various conifer species.
  Whittaker et al., 2016a,c
The methane, nitrous oxide and carbon dioxide emission factors listed in Table 6 include the
fraction of smoldering emissions in contrast to those produced from high temperature
combustion in boilers.

12   |
Interest and investment in forest carbon offset projects has increased recently, however, the concordant spate of wildfires in the Western U.S., and doubling of the mean 100-year integrated risk of moderate and severe wildfire across U.S. ecosystems between 2000 and 2017 (Anderegg et al., 2020) has demonstrated the fragility of the permanence of forest carbon credits. this situation has led some to question the sufficiency of the buffer pool mechanism for programs such as the California Cap and Trade that constitutes an insurance program to hedge risk of fire (2-4%), drought, insect infestation, or other unintended events that may cause a loss of carbon from forest carbon projects (Anderegg et al., 2020; Herbert et al., 2020). In this context, forest wildfire risk management may both serve to increase the relative permanency of forest carbon projects and reduce GHG emissions if culled material is processed into alternative biomass fuels. 1.7.4 Biomass Composting Many types of feedstock, such as urban wood waste, are processed by composting which generates methane emissions. The avoided methane emissions represented in this Study are calculated based on the Tier 1 Biomethane-derived from Anaerobic Digestion of Organic Waste Calculator provided for the California Low-Carbon Fuel Standard. This calculator estimates an overall emission factor for urban landscaping waste of 277 grams CO2e per wet kg based on the range of values in Table 7. These values include calculations from the CARB tier1 calculator that examined emissions from landfilling of urban landscaping waste and wood waste as well as composting these materials. The emission factors in the CARB model are based on controlled landfills (Lee, 2017)6 and CARB’s assessment of composting emissions. However, residue piles from forest product mills are not actively managed and aerated. Therefore, the midpoint of the IPCC emission factors for composting provide the basis for this Study. Note that emissions from managed composting may be lower; however, this situation is not the likely treatment for many of the alternative fates. Some studies show higher emissions from unmanaged sawdust piles (Pier & Kelley) with 7 times higher GHG emissions than those assumed here. 6 The tier1 1 OW calculator also shows 3315.4 g CH4/wet tonne with 60% moisture wood. These emissions would correspond to 41,44 g CH4/wet ton with 50% moisture (0.5 kg dry matter/0.4 kg dry matter); so, the 4,097 value in the tier1 OW model provided the basis for the calculations in this study. 13 |
Table 7. Composting and Landfilling Emission Factors for Wood Waste
                                                    Emission Factors g/AR kg
                                                                                             Moisture
    Data Source       Material     Fate                       CH4         N2 O     CO2e
                                                                                               (%)
                      Wood         Landfilling, 75% CH4
                                                             9.16         0.09     255.9        45%
                      Wastea       capture
                      Wood         Managed
                                                             0.82         0.09      47.3        45%
    California Air    Wastea       Composting
    Resources         Wood         64.1% Compositing,
    Board, 2018b                                             3.81         0.09     122.2        45%
                      Wastea       35.9% landfilling
                                   64.1% composting
                      Wood
                                   35.9% Landfill 50%        13.2         0.09     357.1        45%
                      Wastea
                                   CH4 Capture
                      Forest
    Pier & Kelley     Products     Waste Piles                78           0       1,950     62.9±1.1
                      Mill Waste
    Amlinger et       Green        Managed
                                                             0.604       0.178       68         50%
    al., 2008         Wasteab      Composting cd
    Pipatti et al.;   Solid        Range of                    10
                                                                          0.6       429         60%
    IPCC 2006         Wastebc      Composting             (0.08 to 20)
                      Woody        Unmanaged
    This Study                                                10          0.09      277         45%
                      Biomass      Composting
a
   CH4 and N2O emissions calculated from CARB tier1 OW calculator. CO2e emissions exclude the net
emissions from stored carbon in the landfill (which does not apply to composting). The values are based
on wood waste only with 45% moisture (excluding yard waste).
b
  garden and park sources
c
 food, garden, and park
d
  Includes aeration via regular mechanical turning

1.7.5 Global Warming Potential
GWP is a measure of the potential of a gas to have an effect that could lead to climate change
due to prolonged residence time in the atmosphere. The GWP can be used to quantify and
communicate the relative and absolute contributions to climate change of emissions of
different GHG (Myhre et al., 2013) and of emissions from countries or sources. Table 8 shows
the GWP values from the Intergovernmental Panel on Climate Change (IPCC), an international
body founded by the United Nations for the 100-year and 20-year time horizons from the two
latest IPCC Assessment Reports, (AR4 and AR5), about the state of scientific, technical and
socio-economic knowledge on climate change.

14   |
Table 8. Global Warming Potential of GHG Pollutants
IPCC Assessment AR5a AR4b
GWP Time Horizon 100 20 100 20
CO2 1 1 1 1
CH4 30a 85 25a 72
N2O 265 264 298 289
a
IPCC Fifth Assessment Report 5 (AR5) published in 2014 includes a GWP of 28 for biogenic CH4. Since
the biogenic source would be emitted either as CO2 or CH4, the difference between the GWP of 30 and
28 represents in the indirect effects of methane decomposition to CO2. (Myhre, 2013)
b
Fourth IPCC Assessment report published in 2007
The United Nations Framework Convention on Climate Change uses the 100-year GWP. The
United States primarily uses the 100-year GWP for reporting of GHG emissions. The State of
Washington Greenhouse Gas Reporting program (Section 173-441 of the Washington
Administrative Code) also uses the 100-year GWP. The 20-year GWP is sometimes used as an
alternative to the 100-year GWP. The 20-year GWP prioritizes gases with shorter lifetimes,
because it does not consider impacts that happen more than 20 years after the emissions
occur. Because all GWPs are calculated relative to CO2, emission calculations based on a 20-
year GWP will be larger for gases with lifetimes shorter than that of CO2, and smaller for gases
with lifetimes longer than CO2 (EPA). Values in this Study are based on the AR4 100-year GWP
for consistency with International and United States reporting requirements.
In addition to more well-known GHG gases, including carbon dioxide, nitrous oxide, and
methane, the GREET model is also configured with particulate matter and black carbon
emissions on a life cycle basis. The AR4 values with zero GWP for black carbon were used in the
2010 EPA Regulatory Impact Analysis (RIA) for Air Pollution Regulations. This Study will examine
the sensitivity of the GWP factors. Particulate emissions from wood combustion, including black
carbon, are a concern for local air quality, as shown in Figure 6.
Climate Change
The phenomena of natural and human-caused effects on the atmosphere that cause changes in
long-term meteorological patterns due to global warming and other factors is generally
referred to as climate change. The global climate changes continuously, as evidenced by
repeated episodes of warming and cooling documented in the geologic record. But the rate of
change has typically been incremental, with warming or cooling trends occurring over the
course of thousands of years. The past 10,000 years have been marked by a period of
incremental warming, as glaciers have steadily retreated across the globe. However, scientists
have observed an unprecedented increase in the rate of warming over the past 150 years (IPCC,
2018). This recent warming has coincided with the Industrial Revolution, which resulted in
widespread deforestation to accommodate development and agriculture along with increasing
use of fossil fuels. These changes in land uses and consumption of fossil-based, carbon-laden
fuels have resulted in the release of substantial quantities of greenhouse gases – to the extent
that atmospheric concentrations have reached levels unprecedented in the modern geologic
record.
15 |Figure 6. Particulate emissions associated with heating fuels.
Source: analysis by FutureMetrics using US EPA and OkoFEN data
The accumulation of GHG in the atmosphere affects the earth's temperature. While research
has shown that the Earth's climate has natural warming and cooling cycles, the overwhelming
preponderance of evidence indicates that emissions related to human activities have elevated
the concentration of GHG in the atmosphere far beyond the level of naturally-occurring
concentrations, and that this, in turn, is resulting in more heat being held within the
atmosphere. The IPCC has concluded that it is "very likely" – representing a probability of
greater than 90 percent – that human activities and fossil fuels, commonly referred to as
anthropogenic emissions, explain most of the warming over the past 50 years (IPCC 2018).
The IPCC (2018) predicts that under current human GHG emission trends, the following results
could be realized within the next 100 years:
• global temperature increases between 1.1 to 6.4 degrees Celsius;
• potential sea level rise between 18 to 59 centimeters or 7 to 22 inches
• reduction in snow cover and sea ice;
• potential for more intense and frequent heat waves, tropical cycles and heavy
precipitation; and
• impacts to biodiversity, disease outbreaks, drinking water and food supplies.
GHG affect climate change in the same manner irrespective of the location of emissions, and
the impacts on climate are felt globally. Emissions from combustion as a wood stove fuel, or as
decomposition of forest material, have the same affects across locations. While general
16 |consensus is that anthropogenic GHG emissions are a cause of climate change, it is the cumulative effect of all emission sources in the atmosphere rather than individual sources that is the cause. It is not generally possible to equate a specific climate change response to a specific emissions source from an individual project. 1.8 Goal and Scope Definition The goal of this Study is to quantify the GHG emissions associated with burning wood pellets and wood chips as alternatives for heating oil and natural gas used for heating purpose. This Study also compares the life cycle GHG emissions for the woody biomass thermal applications with those of the fossil fuels. As part of EPA’s 2010 Regulatory Impact Analysis (RIA) of the Renewable Fuel Standard (RFS), it conducted a life cycle assessment (LCA) of the biofuels specified in RFS2 using GREET_1.8c. Therefore, GHG emissions of wood pellets and wood chips are examined using GREET1_2019 (the most recent version of GREET) as well as GREET_1.8c. 1.9 Life Cycle Assessment Background Since the effect of GHG emissions occur over a long duration, the life cycle and total global emissions are considered the relevant metric7. Life Cycle Assessment (LCA) is a technique used to model the environmental impacts associated with the production of a good. LCA models can assess environmental impacts over a range of categories, including GHG emissions as well as others. This is done by taking a full inventory of all the inputs and outputs involved in a product’s life cycle. This Study takes a partial LCA approach by identifying GHG emissions associated with burning woody biomass, heating oil and natural gas for heating purposes. Upstream emission are calculated on a life cycle basis to enable the calculation of cradle to grave emissions in combination with direct or end-use emissions, which is consistent with the ISO 14040 methodology (ISO, 2006). The upstream life cycle emissions correspond to the Scope 2 and Scope 3 emissions that are part of statewide inventory reporting (World Resources Institute, 2004). Most LCA tools are spreadsheet or database models that use life cycle inventory (“LCI”) data to calculate the environmental impacts associated with the material flows and inputs. Additionally, LCA has been used to support regulatory and/or legislative initiatives for renewable targets, such as targets for GHG emission reductions. This Study follows the process for Life Cycle Assessment defined by international standards shown in Figure 7. Life cycle emissions are generally considered to cover the full life cycle from resource extraction to end use. Life cycle assessments are generally limited to the manufacturing, construction and operation periods. An LCA includes the upstream emissions for inputs to a process. In most cases, upstream emissions occur in the production of upstream inputs. For example, producing the natural gas used for generation of electric power on site requires upstream energy inputs. Upstream energy inputs like these are accounted for in this Study. 7 For example, consider electric cars with zero emissions during driving. The life cycle emissions including upstream emissions provide the relevant basis for comparison with other transportation options. 17 |
You can also read