Light-Duty Vehicle Emissions - A look at what lies ahead for the automobile sector: policy uncertainty, hybrid/electric vehicles, and autonomous ...
←
→
Page content transcription
If your browser does not render page correctly, please read the page content below

The Magazine for Environmental Managers   April 2020

Light-Duty
Vehicle               Emissions
A look at what lies ahead for the
automobile sector: policy uncertainty,
hybrid/electric vehicles, and
autonomous transportation.

Staff and Contributors
                                                                      Steven P. Frysinger, Ph.D.
Stephanie M. Glyptis                                                  James Madison University
A&WMA Headquarters

Executive Director                                                    Term Ends: 2021
Air & Waste Management Association
Koppers Building                                                      Keith Gaydosh
436 Seventh Ave., Ste. 2100                                           Affinity Consultants
Pittsburgh, PA 15219                                                  Term Ends: 2021
1-412-232-3444; 412-232-3450 (fax)                                    Jennifer K. Kelley
em@awma.org                                                           General Electric
www.awma.org                                                          Term Ends: 2020

                                                                      John D. Kinsman
Jeff Schurman
Advertising
                                                                      Edison Electric Institute
1-412-904-6003                                                        Term Ends: 2022
jschurman@awma.org
                                                                      Mingming Lu
                                                                      University of Cincinnati
Lisa Bucher
Editorial
                                                                      Term Ends: 2022
Managing Editor
1-412-904-6023                                                        David H. Minott, QEP, CCM
lbucher@awma.org                                                      Arc5 Environmental Consulting
                                                                      Term Ends: 2020

Teresa Raine, Chair                                                   Brooke A. Myer
Editorial Advisory Committee

ERM                                                                   Indiana Department of Environmental Management
Term Ends: 2022                                                       Term Ends: 2022

Bryan Comer, Vice Chair                                               Brian Noel, P.E.
International Council on Clean Transportation                         Trinity Consultants
Term Ends: 2020                                                       Term Ends: 2020

Leiran Biton                                                          Golam Sarwar
U.S. Environmental Protection Agency                                  U.S. Environmental Protection Agency
Term Ends: 2022                                                       Term Ends: 2022

Gary Bramble, P.E.                                                    Melanie L. Sattler
Retired                                                               University of Texas at Arlington
Term Ends: 2021                                                       Term Ends: 2022

James Cascione                                                        Anthony J. Schroeder, CCM, CM
SABIC Innovative Plastics                                             Trinity Consultants
Term Ends: 2022                                                       Term Ends: 2022

Prakash Doraiswamy, Ph.D.                                             Justin Walters
RTI International                                                     Southern Company Services
Term Ends: 2020                                                       Term Ends: 2022

Ali Farnoud                                                           Susan S.G. Wierman
Ramboll Environ                                                       Johns Hopkins University
Term Ends: 2020                                                       Term Ends: 2021

Layout and Design: Clay Communications, 1.412.704.7897

EM, a publication of the Air & Waste Management Association, is published monthly with editorial and executive offices at
The Koppers Building, 436 Seventh Ave., Ste. 2100, Pittsburgh, PA 15219, USA. ©2020 Air & Waste Management Association
(www.awma.org). All rights reserved. Materials may not be reproduced, redistributed, or translated in any form without prior
written permission of the Editor. A&WMA assumes no responsibility for statements and opinions advanced by contributors to
this publication. Views expressed in editorials are those of the author and do not necessarily represent an official position of the
Association. A&WMA does not endorse any company, product, or service appearing in third-party advertising.

EM Magazine (Online) ISSN 2470-4741 » EM Magazine (Print) ISSN 1088-9981
ACE 2020 GATEWAY TO INNOVATION
                                   Air & Waste Management Association’s 113th Annual Conference & Exhibition
                                   June 29 – July 2, 2020 • San Francisco, CA

          Be a part of the culmination of environmental innovation
                Join us at ACE this year for an exceptional opportunity for professionals in industry, consultants,
                researchers, students, and exhibitors to share knowledge and learn the latest information and solutions on
                environmental technology and regulation.

                Take advantage of all that ACE has to offer to help you gain knowledge, explore solutions, and make connections!

                      • The Keynote Session “Environmental Challenges for Transportation” will feature an interactive discussion among
                        executives from Tesla, UC Berkeley Haas Energy Institute, and the CA Independent System Operator.
                      • Three days of technical sessions and over 40 panels on the hottest topics including: alternative energies, air
                        quality, regulatory direction, zero waste, emerging contaminants, and more

                      • The 50th Critical Review on Wildfire and Prescribed Burning Impacts on Air Quality

                      • Technical tours to the Port of Oakland, Chevron, Tesla, and the Livermore National Ignition Facility and Sandia
                        Combustion Research Labs

                             • Ten professional development courses on Air Dispersion Modeling, EPI/QEP Prep, Air Quality Permitting and
                               Compliance, CEMS, Sustainability, Cap-and-Trade, and more

                                     • Networking opportunities include the Opening Reception, YP/Student Networking Event, Honors &
                                       Awards Luncheon, Women’s Professional Development Workshop, and more.

                                                          Find details on the technical sessions, keynote, courses, tours, and
                                                          events at www.awma.org/ACE2020 and register now.

                                                                                    Become a sponsor or exhibitor and gain recognition,
                                                                                    generate leads, and support the environment!

Thank you to our sponsors:

                                                                                                                                  West Coast Section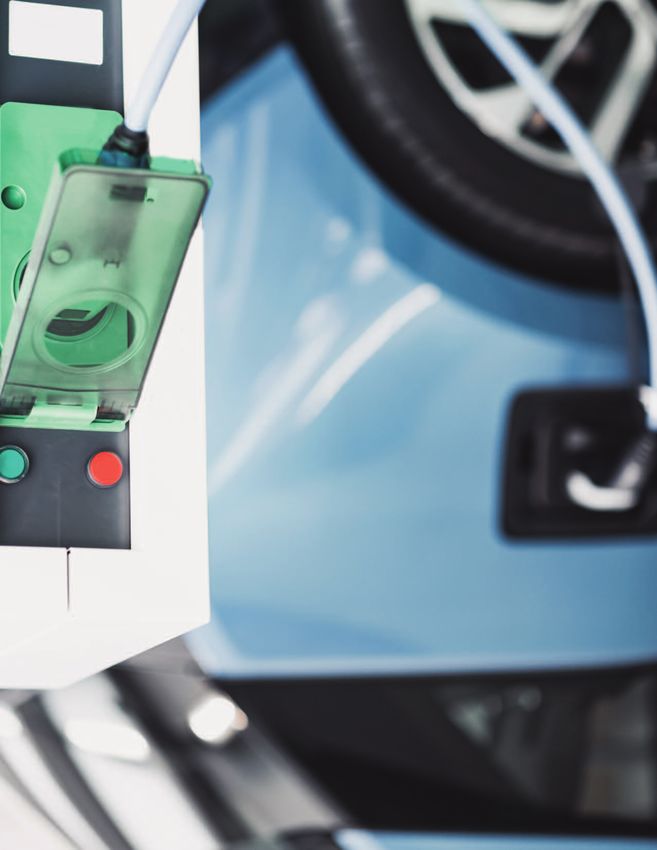
Table of Contents

                                 Light-Duty Motor Vehicle Emissions
                                 by Justin Walters
                                 Recent policy changes to mileage standards affecting light-duty vehicles
                                 in the United States have resulted in increased uncertainty for the
                                 automobile industry. At the same time, electric vehicles are growing in
                                 popularity and penetration is expected to substantially grow over the next
                                 decade. The focus for this month’s EM is the emissions trajectory of the
                                 light-duty vehicle sector.

Features

What’s Ahead for Light-Duty Motor                          Light-Duty Vehicle Emissions:
Vehicle Emissions?                                         An Automotive Perspective
by H. Christopher Frey and Michael P. Walsh                by T.J. Wallington, J.E. Anderson, X. He, W.C. Ruona,
                                                           W. Shen, R. Vogt, and S.L. Winkler

Are Electric Vehicles a Panacea for                        California’s Commitment to the
Reducing Ozone Precursor Emissions?                        Rapid Transition to Zero-Emission
by Gary A. Bishop                                          Vehicles is Undeterred
                                                           by Alberto Ayala

Columns                                                    Departments
                        PM File: Backlog:                                 Message from the President:
                        An Eye to the Future                              Challenges for Cleaner Transportation
                        by David Elam                                     by Kim Marcus
                        A look at backlog and
                        why it is an important
                        metric for environment,            Back In Time: A&WMA’s Annual
                        health, and safety (EH&S)          Critical Review Turns 50
                        consulting firms.                  A look at the 1971 Critical Review, “National Air Quality
                                                           Standards for Automotive Pollutants” by Heuss, et al.

                         em • The Magazine for Environmental Managers • A&WMA • April 2020
Cover
                                                  Message
                                                      Story by
                                                            from
                                                               Melanie
                                                                 the President
                                                                        L. Sattler

                                              Challenges
                                              for Cleaner
                                              Transportation
                                              Kim Marcus » president@awma.org

This month, EM focuses on the dynamic between                        during an interactive panel discussion. Featured speakers
light-duty vehicles and issues around emission                       include: Severin Borenstein of the Haas School of Business,
standards, and the increasing acceptance, quality, and               whose current research projects include the economics of
place of electric vehicles. The surge of technology, infra-          renewable energy, economic policies for reducing green-
structure, and the public’s acceptance of electric vehicles          house gases, alternative models of retail electricity pricing,
signals the next quantum leap for transportation. We are             and competitive dynamics in the airline industry; Delphine
moving from depending on the use of carbon-based                     Hou, who develops regulatory strategy for the California
resources to the direct use of the sun’s energy. Clearly,            Independent System Operator (CAISO); and Laurie
as with any major change, not everyone will embrace this             Shelby, who leads worldwide environment, health, and
shift, but enough people are moving in that direction that           safety operations for Tesla, Inc.
we can anticipate a meaningful reduction in future fossil
                                                                     It is not too late to start planning to attend ACE. Other
fuel use. To learn more, read the feature articles in this
                                                                     conference highlights include the 50th Annual A&WMA
issue that focus on the emissions trajectory of the light-
                                                                     Critical Review on “Wildfire and Prescribed Burning
duty vehicle sector.
                                                                     Impacts on Air Quality in the United States” by Dr. Daniel
Looking ahead to A&WMA’s Annual Conference &                         A. Jaffe; a mini symposium on “Embracing Innovation”;
Exhibition (ACE; www.awma.org/ace2020) in San Fran-                  and over 300 platform, panel, and poster presentations.
cisco later this summer, one of the conference highlights            Add to that the many professional development and
includes a Keynote plenary session on “Environmental                 networking opportunities, as well as a truly beautiful
Challenges for Transportation” featuring leading industry            venue, and you have all the makings for a great confer-
executives who will share their perspective and solutions            ence. Hope to see you there! em

 A&WMA Career Center

                                                              Photo courtesy of Apache Corp

   Connecting job seekers and employers in the environmental industry
    Looking to make a career move?                                   Need to find qualified professionals?
    Take advantage of your free member                               Create an account online and:
    benefit, and:
                                                                     •   Post jobs quickly and easily
    •   Post your resume                                             •   Choose from many affordable packages
    •   Apply for hundreds of open positions                         •   Manage applications
    •   Get career coaching                                          •   Search hundreds of resumes
    •   Sign up for new posting alerts                               •   Sign up for new resume alerts

    Land a job!                                                      Hire the perfect candidate!
                                Get started now at www.awma.org/careers.

                              em • The Magazine for Environmental Managers • A&WMA • April 2020
Cover Story by Justin Walters

       Light-Duty Motor
       Vehicle Emissions
       Recent policy changes to mileage standards affecting
       light-duty vehicles in the United States have resulted in
       increased uncertainty for the automobile industry. At the
       same time, electric vehicles are growing in popularity and
       penetration is expected to substantially grow over the next
       decade. The focus for this month’s EM is the emissions
       trajectory of the light-duty vehicle sector.

em • The Magazine for Environmental Managers • A&WMA • April 2020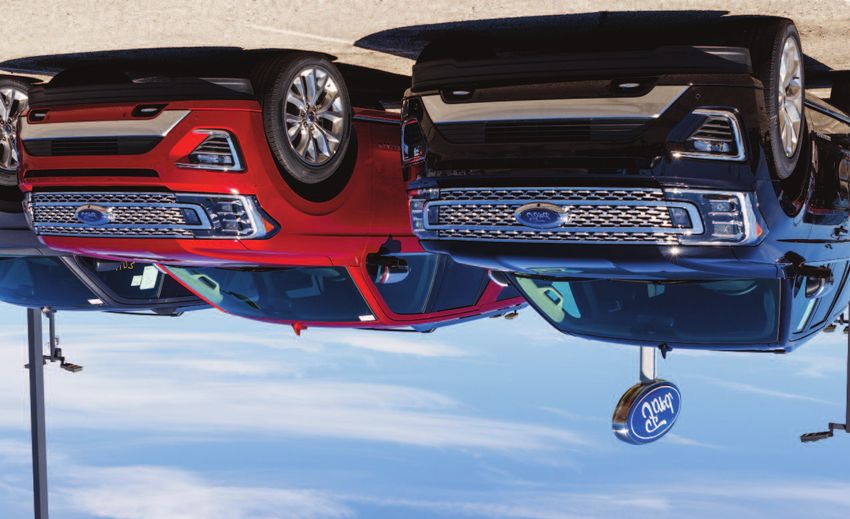
Cover Story by Justin Walters

Are you in the market for a new vehicle? A look around the
local auto mall may have your head spinning with options.
While many Americans are enamored with SUVs and pick-up
trucks, the popularity of low- and zero-emitting vehicles has
grown substantially over the past decade. According to the
2019 Electric Vehicle Outlook by Bloomberg New Energy
Finance (https://about.bnef.com/electric-vehicle-outlook/),
battery prices are expected to continue to fall dramatically
over the next few years, which may help zero-emitting plug-in
electric vehicles reach price parity with internal combustion
                                                                             While low-emitting technology options
                                                                             continue to expand, recent policy
engine vehicles by the mid-2020s.

While low-emitting technology options continue to expand,                    changes leave a great deal of regulatory
                                                                             uncertainty for the automobile industry.
recent policy changes leave a great deal of regulatory
uncertainty for the automobile industry. In 2012, aggressive
light-duty vehicle (LDV) emissions and fuel economy targets
were established for model-years 2017 through 2025.                       have so far been achieved. Further reductions in these
However, the U.S. Environmental Protection Agency (EPA)                   pollutants from LDVs will likely be dependent upon
and the U.S. National Highway Traffic Safety Administration               addressing emissions from high emitters that are on the
(NHTSA) recently proposed to freeze targets at 2020 levels                road. As zero-emission vehicles gain market share, the
through 2026 and withdrew California’s waiver to set its                  emissions footprint from these vehicles, including carbon
own greenhouse gas emissions standards and zero-emitting                  dioxide, will be dependent upon upstream emissions from
vehicles mandates.                                                        the electricity sector.

In this issue, we consider these and other drivers impacting              Gary Bishop discusses research conducted by the
the auto industry as we examine what’s ahead for LDV                      University of Denver, using data collected recently in
emissions and regulations.                                                Denver, Chicago, and Los Angeles, showing that a small
                                                                          number of vehicles are responsible for a large portion of
In the first article, Chris Frey and Michael Walsh discuss                emissions. His article highlights the importance of focusing
several factors that could impact emissions from LDVs, both               on addressing high emitters to achieve further emission
domestically and internationally, particularly emissions of               reductions from the transportation sector.
carbon dioxide. While LDVs continue to be more efficient,
trends in vehicle preference toward SUVs and increasing                   In the final article, Alberto Ayala with the Sacramento
vehicle miles traveled could overwhelm these efficiency                   Metropolitan Air Quality Management District provides a
gains. Domestic and international policy will be important                critical perspective on how policy changes, such as the Safer,
for adoption of low-emission technologies and continued                   Affordable, Fuel-Efficient (SAFE) Vehicles Rule, present
emission reductions from LDVs.                                            challenges for states like California that have areas that are
                                                                          struggling to meet U.S. National Ambient Air Quality Stan-
Next, T.J. Wallington, et al. with Ford Motor Company                     dards. California emissions standards have been a driver for
provide an historical overview of vehicle emissions trends,               zero-emission vehicle technology development and the state
discussing the significant reductions in emissions of pollu-              is expected to continue to seek ways to force technology solu-
tants such as nitrogen oxides and carbon monoxide that                    tions to reduce emissions from the transportation sector. em

  Justin Walters, Principal, Environmental Policy & Engagement, Southern Company. Walters is a member of the EM Editorial Advisory Committee.

      Check Out
      EM via the
      A&WMA App!

                                                Read EM on the go, wherever, whenever.

                                 em • The Magazine for Environmental Managers • A&WMA • April 2020
Light-Duty Motor Vehicle Emissions by Chris Frey and Michael Walsh

In the future, connected autonomous vehicles could coordinate with each
other by forming platoons and by creating gaps to allow for merging vehicles.

                What’s Ahead for
                Light-Duty Motor
               Vehicle Emissions?
            An overview of the projected trajectory for light-duty motor
            vehicle emissions, trends, and standards.

                                      em • The Magazine for Environmental Managers • A&WMA • April 2020
Light-Duty Motor Vehicle Emissions by Chris Frey and Michael Walsh

The global stock of on-road light-duty vehicles (LDVs)            U.S. LDV greenhouse gas emissions increased by 13% from
grew by nearly 32% from 2010 to 2018, reaching over               1990 to 2018 to 1.09 billion metric tons of carbon dioxide
1.3 billion (see Figure 1), with increases to over 2.4 billion    (CO2)-equivalent.2
vehicles projected by 2050. Much of this growth will occur
in Asia. Although market shares of alternative vehicles—in-       Improvements in Conventional
cluding plug-in hybrid electric vehicles (PHEVs), battery-        Vehicle Technology
powered electric vehicles (BEVs), natural gas-fueled vehicles,    Conventional LDVs are becoming more energy efficient
and hydrogen fuel-cell vehicles (FCEVs)—are expected to in-       through the use of improved technologies (e.g., direct
crease, in the absence of policies to the contrary, the vehicle   injection, more efficient transmissions, hybridization).3
fleet is expected to be dominated by internal combustion          Although average vehicle weight is approximately the same,
engine (ICE) fossil-fueled vehicles for the next few decades.1    and although average engine horsepower is 70% greater, the
                                                                                          U.S. LDV fleet today is approximately
                                                                                          twice as fuel efficient as it was in 1970.
                                                                                          While fuel economy improvements
                                                                                          could lead to net reductions in energy
                                                                                          consumption in developed countries,
                                                                                          growth in vehicle stock and vehicle
                                                                                          miles traveled (VMT) elsewhere is likely
                                                                                          to increase global energy consumption
                                                                                          (see Figure 2).1,4

                                                                                         Trends in Consumer Choices
                                                                                         The rise of sport utility vehicles
                                                                                         (SUVs) has been one of the major
                                                                                         drivers of recent global CO2 emissions
                                                                                         growth, according to the International
                                                                                         Energy Agency, putting increased
                                                                                         pressure on advanced technologies
                                                                                         for reducing CO2 emissions from
                                                                                         vehicles. The U.S. market share of
                                                                                         light-duty trucks, including SUVs, has
   Figure 1. Global light-duty vehicle stock, projected to 2050.                         recently far outpaced that of sedans
   Source: U.S. Energy Information Agency, 2019 International Energy Outlook             and wagons (see Figure 3). In 2018,
   (http://www.eia.gov/ieo)                                                              the fuel economy of truck-based SUVs
                                                                                         averaged only 22 miles per gallon
                                                                                         (mpg), compared to 30 mpg for
                                                                                         sedans.2

                                                                                         Social attitudes toward transport
                                                                                         may be changing in ways that could
                                                                                         increase energy consumption. For
                                                                                         example, energy consumption for vehi-
                                                                                         cles used in ridesourcing services (e.g.,
                                                                                         Uber, Lyft) may be substantially higher,
                                                                                         by 40%–90%, compared to previous
                                                                                         transport mode choices, because of
                                                                                         miles accumulated to reach a service
                                                                                         territory and during deadheading
                                                                                         (driving without passengers) between
                                                                                         rides.5 However, although some
   Figure 2. Global light-duty vehicle energy consumption for                            ridesharing is replacing walking and
   Organization of Economic Cooperation and Development (OECD)                           mass transit use, much of it replaces
                                                                                         private car or taxi usage; thus, the
   and non-OECD countries, projected to 2050.
                                                                                         overall effect on vehicle miles traveled
   Source: U.S. Energy Information Agency, 2019 International Energy Outlook
                                                                                         and greenhouse gas emissions is
   (http://www.eia.gov/ieo)
                                                                                         small.6

                              em • The Magazine for Environmental Managers • A&WMA • April 2020
Light-Duty Motor Vehicle Emissions by Chris Frey and Michael Walsh

                                                                                 equivalent ICE vehicles and, as coal gradually
                                                                                 gets phased out, this CO2 advantage will in-
                                                                                 crease. The global share of power generation
                                                                                 from renewables, such as wind and solar, is ex-
                                                                                 pected to increase, and the emissions intensity
                                                                                 of power generation is expected to decrease.3

                                                                                 Emissions from battery manufacturing are
                                                                                 roughly comparable to that for ICEs used in
                                                                                 conventional vehicles, and will decrease as
                                                                                 electric power is decarbonized.9 There are un-
                                                                                 likely to be raw resource constraints (e.g., rare
                                                                                 earth metals) on battery production capacity.10
                                                                                 EVs are also not likely to be constrained by
   Figure 3. U.S. annual new vehicle sales for passenger cars                    power generation capacity, although there will
   and trucks (SUVs, pickups, minivans), 1990–2018.                              be a growing need for home and public
   Source: Table I-17, U.S. Bureau of Transportation Statistics                  chargers. Public policies to promote new vehi-
   (https://www.bts.gov/content/new-and-used-passenger-car-sales-and-leases)     cle technologies tend to benefit disproportion-
                                                                                 ately wealthy populations.11 To address equity
                                                                                 in BEV adoption, California has been piloting
                                                                                 a Clean Vehicle Assistance Program aimed at
                                                                                 low-income adopters.12

                                                                                 Disruption from
                                                                                 Autonomous Vehicles
                                                                                 The emergence of autonomous vehicles (AVs)
                                                                                 is likely to disrupt trends in LDV energy use and
                                                                                 emissions. The effect of AVs will depend on
                                                                                 many factors, such as levels of autonomy,
                                                                                 vehicle connectivity, whether vehicles are
                                                                                 shared, and the mix of AVs and traditional
                                                                                 vehicles, as well as choices of fuels and power-
                                                                                 trains. Broadly, AVs are likely to have two major
   Figure 4. Annual U.S. sales of advanced technology                            impacts: at the individual vehicle level and at the
   vehicles, 2011–2018.                                                          macroscopic level.
   Source: Auto Alliance Advanced Technology Vehicle Sales
   Dashboard (https://autoalliance.org/energy-environment/advanced-                At the individual vehicle level, AVs could be
   technology-vehicle-sales-dashboard/)                                            operated more efficiently by smoothing speed
                                                                                   trajectories and coordinating with traffic and
Adoption of New Technologies                                        infrastructure. However, AV performance goals may differ
The adoption of new energy vehicle technologies in the              by manufacturer and may not emphasize energy efficiency.
United States is relatively modest. New U.S. LDV sales in           Vehicles could be controlled, for example, to minimize travel
2018 were over 17 million, of which only 654,000 were               time rather than energy use.
advanced technology vehicles, such as hybrid electric
vehicles (HEVs), PHEVs, BEVs, or FCEVs (see Figure 4).
Following a few years of rapid growth, U.S. new vehicle             At the macroscopic level, such as for an urban region, AVs
technology sales have been stagnant from 2013 to 2018.              may dramatically change trip-taking activity. For example,
Plug-in electric vehicle sales in Europe increased from             children not old enough to drive a traditional vehicle may
407,000 in 2018 to 579,000 in 2019.7 The electric vehicle           be allowed to use AVs. AVs could be used by elderly or
market share in China is 4.7% with annual sales well over           disabled persons who are not easily able to drive a tradi-
one million per year.8                                              tional vehicle. Furthermore, leisure time in an AV could lead
                                                                    to tolerance of longer commutes and increased sprawl in
BEVs are zero-emitting at the point of use, except for brake        land-use patterns. Depending on these and other factors,
and tire wear, and therefore, can play an important role in         AVs could substantially reduce or increase transport energy
achieving health-based air quality standards in urban areas.        consumption, by roughly a factor of two.13,14
Even in countries that produce significant proportions of
electric power from coal, such as the United States and             International Policy and Regulation
China, BEVs already emit less CO2 per mile driven than              Although light-duty diesel vehicles (LDDVs) are more fuel

                              em • The Magazine for Environmental Managers • A&WMA • April 2020
Light-Duty Motor Vehicle Emissions by Chris Frey and Michael Walsh
Figure 5. Passenger car CO2 emissions and fuel consumption values for selected countries,
projected to 2030 and normalized to the New European Driving Cycle.
Source: International Council on Clean Transportation
efficient and lower CO2-emitting than equivalent gasoline vehicles (ZEVs), including BEVs, is approaching that of ICE
vehicles, their future is uncertain. Markets that have histori- vehicles, with cost parity expected within five to seven
cally had high shares of LDDVs, particularly the European years.15 Increased affordability could enable more wide-
Union (EU) and India, have promulgated more stringent spread adoption of BEVs.
tailpipe nitrogen oxides and particulate matter emission
standards, which require expensive emission controls. California’s Unique Leadership Role
Many European cities are restricting diesel cars in light of Because of historically uniquely severe air quality problems,
the VW diesel emissions scandal. The prospect of such California has the right under the U.S. Clean Air Act to
restrictions leads to loss of consumer confidence that, if request a waiver from the U.S. Environmental Protection
they buy a diesel car, they will be able to drive it as they Agency (EPA) to set its own state-level motor vehicle emis-
normally have. sion standards. For example, the California Air Resources
Board (CARB) adopted the first ZEV mandate in 1990,
Numerous countries are adopting passenger car CO2 emis- primarily to address the serious ozone air pollution problem
sion and fuel consumption regulations (see Figure 5). The EU in the Los Angeles basin. As concerns regarding climate
is currently the most aggressive with stringent requirements change increased, CARB viewed growth of ZEVs as critical
going into effect in 2020, 2025, and 2030. Meeting these to addressing that problem as well. Based on Section 177
standards in the future will be difficult without BEVs. BEVs of the Clean Air Act, other U.S. states can adopt either
are inherently clean and do not require large and ongoing the federal or California standard. Thirteen states follow
investment in strong emissions compliance programs. To ad- California’s Low Emission Vehicle (LEV) standards of which
dress climate change, many countries and cities are calling for nine also follow the ZEV mandate.
the elimination of ICE vehicles. For example, the sale of petrol
and diesel cars would be banned in Ireland from 2030 under To place California’s role in historical context, the state’s
draft proposals for a new climate law. The Irish proposal sees technology-forcing regulations led to the introduction of
the country join Denmark, Sweden, and the Netherlands in three-way catalysts (TWC) to reduce carbon monoxide,
targeting a 2030 deadline. France and Spain have announced hydrocarbon, and nitrogen oxides emissions from gasoline
similar plans with a 2040 date, while the United Kingdom cars; advanced electronic controls and fuel-injection systems
and Norway plan to ban sales of petrol and diesel cars from to assure proper air fuel mixture controls to optimize the per-
2035 and 2025, respectively. formance of TWCs; onboard diagnostics to monitor emissions
performance; and BEVs. These technologies have been
Numerous manufacturers have announced investment of adopted globally and have profoundly changed the global
hundreds of billions of dollars for the production of BEVs motor vehicle industry and its emissions footprint. For exam-
and batteries, assuring an increasing variety of models and ple, following California’s technology and policy lead, China,
vehicle types and thereby increasing consumer options. which is the world’s largest new car market, is now also the
As sales volumes climb, the cost of so-called zero-emissions largest ZEV market.
em • The Magazine for Environmental Managers • A&WMA • April 2020Light-Duty Motor Vehicle Emissions by Chris Frey and Michael Walsh
Reversal of U.S. Policy on 2025 than the 2012 rule. All parties expect the legal issues
Vehicle GHG Emissions relating to California’s authority to set standards for vehicle
The recent U.S. trajectory toward more energy-efficient GHG emissions and to mandate ZEV sales to go to the U.S.
vehicles is being tempered by climate change deregulatory Supreme Court for final resolution over the next year or so.
efforts of the current administration. In 2012, in an effort to
assure a single national program, EPA, the U.S. National Looking to the future, if California is prevented from contin-
Highway Traffic Safety Administration (NHTSA), and CARB uing its leadership role in reducing climate-related pollutants
agreed to tighten greenhouse gas (GHG) and fuel economy from vehicles, the likelihood of achieving the transportation
standards through model-year 2025. To monitor progress, emissions targets necessary to adequately address the
they provided for a mid-course review. In January 2017, EPA climate crisis will be greatly diminished.
carried out an extensive review and concluded that the stan-
dards through model-year 2025 were feasible and more Summary
cost-effective than originally estimated. However, in April Light-duty vehicle energy use and emissions are affected by
2017, then-EPA Administrator Scott Pruitt reversed EPA’s a variety of trends, such as the current rollback of vehicle
decision with the intent to freeze standards at 2020 or 2021 GHG emission standards in the United States, policies in
model-year levels. other countries to promote cleaner vehicles, and manufac-
turer commitments to various technology options. Changing
In 2018, EPA and NHTSA issued a proposed regulation that user needs for mobility and changing preferences for how
would reverse California’s waiver, at least with regard to mobility needs can be met will affect energy use and
GHG emissions and the ZEV mandate. The EPA/NHTSA emissions. The anticipated emergence of autonomous
proposal received strong criticism from the environmental vehicles may be highly beneficial or adverse with respect to
and scientific communities, including EPA’s own Science energy use and emissions, depending on how technology
Advisory Board.16 In particular, the modeling assumption adoption and deployment is managed. There is a growing
that lowering the purchase price of new cars would result need for research, demonstration, and implementation
in overall VMT reductions was considered by many to be related to innovative technologies and policies to help
illogical. As of the time of writing, a final rule has not been manage these large changes. Technology-forcing regulation
promulgated, but is expected to require much more modest is an essential component of policies that can effectively
efficiency and CO2 improvements annually from 2021 to reduce vehicle GHG emissions. em
H. Christopher Frey, Ph.D., is the Glenn E. and Phyllis J. Futrell Distinguished University Professor at North Carolina State University. He
chaired the U.S. Environmental Protection Agency’s Clean Air Scientific Advisory Committee from 2012 to 2015 and authored A&WMA’s
2018 Critical Review (https://www.tandfonline.com/doi/full/10.1080/10962247.2018.1454357) on vehicle emissions. Michael P. Walsh is
the founding chair of the Board of Directors of the International Council on Clean Transportation (https://theicct.org/). He has directed
motor vehicle emission control programs and received a MacArthur Fellowship in 2005 for his innovative vehicle emissions work.
References
1. U.S. Energy Information Agency, 2019 International Energy Outlook; www.eia.gov/ieo.
2. Draft Inventory of U.S. Greenhouse Gas Emissions and Sinks; EPA-430-P-20-001; U.S. Environmental Protection Agency, Washington, DC, February
2020. Table A-121 of Annex 3.2; https://www.epa.gov/sites/production/files/2020-02/documents/us-ghg-inventory-2020-main-text.pdf.
3. The 2018 Automotive Trends Report; EPA-420-R-19-002; U.S. Environmental Protection Agency, Washington, DC, 2019; https://www.epa.gov/
automotive-trends/download-automotive-trends-report.
4. Frey, H.C. 2018 Annual A&WMA Critical Review: Trends in onroad transportation energy and emissions; J. Air & Waste Manage. Assoc. 2018, 68
(6), 514-563; doi:10.1080/10962247.2018.1454357.
5. Wenzel, T.; Rames, C.; Kontou, E.; Henao, A. Travel and Energy Implications of Ridesourcing in Austin, Texas; Transportation Research Part D:
Transport and Environment 2019, 70, 18-34.
6. Leard, B.; Xing, J. What Does Ridesharing Replace?; Working Paper 20-03; Resources for the Future, Washington, DC, February 2020.
7. Global electric vehicle sales database. See http://www.ev-volumes.com/.
8. Holland, M. China 2019 Electric Vehicle Market Share Grows To 4.7% Despite Tighter Incentives; CleanTechnica, January 13, 2020; https://
cleantechnica.com/2020/01/13/china-2019-electric-vehicle-market-share-grows-to-4-7-despite-tighter-incentives/.
9. Hall, D.; Lutsey, N. Effects of battery manufacturing on electric vehicle life-cycle greenhouse gas emissions; Briefing; International Council on
Clean Transportation, February 2018; https://theicct.org/publications/EV-battery-manufacturing-emissions.
10. Messagie, M. Electric vehicle life-cycle analysis and raw material availability; Transport and Environment, Brussels, Belgium, 2017;
https://www.transportenvironment.org/publications/electric-vehicle-life-cycle-analysis-and-raw-material-availability.
11. Farkas, Z.A.; Shin, H.S.; Nickkar, A. Environmental Attributes of Electric Vehicle Ownership and Commuting Behavior in Maryland: Public Policy and
Equity Considerations; Technical Report; Morgan State University, 2018; https://www.morgan.edu/Documents/ACADEMICS/CENTERS/NTC/
Environmental%20Attributes%20of%20Electric%20Vehicle%20Ownership%20and%20Commuting%20Behavior%20in%20Maryland%
20-%20Public%20Policy%20and%20Equity%20Considera.pdf.
12. California Clean Vehicle Assistance Program. See https://cleanvehiclegrants.org/.
13. Brown, A.; Gonder, J.; Repac, B. An analysis of possible energy impacts of automated vehicle. In Road Vehicle Automation; Eds. G. Meyer and S.
Beiker; Lecture Notes in Mobility; Springer, 2014, pp. 137-153; doi:10.1007/978-3-319-05990-7_13.
14. Wadud, Z.; MacKenzie, D.; Leiby, P. Help or hindrance? The travel, energy, and carbon impacts of highly automated vehicles; Transportation
Research Part A: Policy and Practice 2016, 86 (Suppl. C)), 1-18; doi:10.1016/j.tra.2015.12.001.
15. Lutsey, N.; Nicholas, M. Update on electric vehicle costs in the United States through 2030; Working Paper 2019-06; The International Council on
Clean Transportation, April 2, 2019; https://theicct.org/sites/default/files/publications/EV_cost_2020_2030_20190401.pdf.
16. Science Advisory Board (SAB) Consideration of the Scientific and Technical Basis of the EPA’s Proposed Rule titled The Safer Affordable Fuel-
Efficient (SAFE) Vehicles Rule for Model Years 2021–2026
Passenger Cars and Light Trucks; Draft Letter; M. Honeycutt, Chair, EPA Science Advisory Board, to A. Wheeler, Administrator, U.S. Environmental
Protection Agency, undated, accessed January 31, 2020; https://yosemite.epa.gov/sab/sabproduct.nsf/ea5d9a9b55cc319285256cbd005a472e/
3bd8a1aea4943223852584e1005463de/$FILE/SAFE%20SAB%20Draft%20Review__10_16_19_.pdf.
em • The Magazine for Environmental Managers • A&WMA • April 2020An Automotive Perspective by T.J. Wallington, et al.
Light-Duty Vehicle Emissions:
An Automotive
Perspective
by T.J. Wallington, J.E. Anderson, X. He, W.C. Ruona, W. Shen, R. Vogt,
and S.L. Winkler, Research & Advanced Engineering, Ford Motor Company
The authors provide a condensed and updated version of their 2018
published perspective1 of what’s ahead for light-duty vehicle emissions.
em • The Magazine for Environmental Managers • A&WMA • April 2020An Automotive Perspective by T.J. Wallington, et al.
Most light-duty vehicles (LDVs) are powered by internal
combustion engines using gasoline or diesel fuel. Tailpipe
emissions include carbon dioxide (CO2), non-methane
hydrocarbons (NMHC), carbon monoxide (CO), nitrogen
oxides (NOx), and particulate matter of size less than 2.5
microns (PM2.5). Emissions of CO, NMHC, NOx, and PM2.5
can adversely impact local air quality and have been regu-
lated since the 1970s. In the United States, federal Tier 3
and California Low Emission Vehicle (LEV) III LDV standards
are phasing in from 2015 to 2025. California LDVs will
need to meet the Super Ultra Low Emitting Vehicle (SULEV)
standard of combined emissions of NOx and NMHC of
0.030 g/mile (SULEV30) in 2025. In the European Union,
the Euro 6 LDV standard went into effect in 2015 and real
driving emissions (RDE) standards started in 2017. Increases
in stringency in emission limits (i.e., Tier IV and Euro 7) are
under discussion and are likely to be implemented post
2025.
Historical Success
Vehicle Emissions
To meet regulations, advanced vehicle emission after-treat-
ment systems such as three-way catalytic converters, lean
NOx traps, selective catalytic reduction (SCR), and diesel
particulate filters (DPFs) have been developed and fuel sulfur
concentration reduced. The combined after-treatment and
fuel approach has enabled highly effective emission control
systems. Starting in the early 1990s, the successive LDV Figure 1. U.S. and EU highway vehicle (LDV,
emission standards have lowered the regulated emission HDV, commercial vehicle, and motorcycle)
intensity (g/mile or g/km) of NMHC+NOx emissions by NOx, VOC, and CO emissions in millions of
98% in the United States (Tier 1 to Tier 3) and by 80–85% tonnes (Mt).
in the European Union (Euro 1 to Euro 6). Heavy-duty Source: (top panel) U.S. Environmental Protection
vehicle (HDV) emissions standards for NMHC+NOx have Agency (EPA); (bottom panel) European Environment
decreased by 95% or more since 1988 in the United States. Agency (EEA).
The New European Drive Cycle (NEDC) and test procedure
did not fully reflect on-road emissions, and the decrease in Air Quality
NOx emissions from on-road diesel vehicles in the European Air quality has improved reflecting the decreases in emissions
Union was less than expected based on laboratory emission from vehicle and stationary sources. As shown in Figure 2,
measurements. Nonetheless, gasoline vehicle on-road NOx ambient concentrations of ozone (O3), CO, NO2, and PM2.5
emission rates decreased by approximately a factor of 10 are declining in U.S. cities. O3 (annual 4th highest 8-hr aver-
since pre-Euro 1 emissions controls.2 In the current Euro 6 age), CO (2nd maximum 8-hr average), and NO2 (annual
regulations, the NEDC has been replaced by the Worldwide 98th percentile of daily maximum 1-hr average) concentra-
Harmonized Light Vehicle Test Procedure (WLTP) and a real tions decreased 31%, 83%, and 61%, respectively, from
driving emission (RDE) component has been added to bring 1980 to 2018. PM2.5 (seasonally weighted annual average)
on-road emissions close to the standards as measured in levels decreased by 39% from 2000 to 2018. The O3 con-
laboratory emissions testing. centrations in Los Angeles have decreased by approximately
a factor of 5 since the 1950s when peak 1-hr oxidant levels
In the United States, the vehicle miles traveled tripled be- were approximately 600 parts per billion (ppb)!3
tween 1970 and 2017. In the European Union, the number
of registered passenger cars grew about 45% from 1995 to While country-wide average air quality today is much
2017 and passenger car travel (passenger km) increased improved in the United States and Europe, local concentra-
25%. Despite increased vehicle mileage, U.S. and EU total tions can still exceed the ambient air quality standards. In
highway vehicle (LDV, HDV, commercial vehicle and motor- many U.S. urban areas, especially California, O3 concentra-
cycle) NOx and volatile organic compound (VOC) emissions tions continue to exceed the air quality standard (70 ppb).
have decreased 60–80% since 1990, as shown in Figure 1. Many EU monitoring stations exceed the O3 standard
em • The Magazine for Environmental Managers • A&WMA • April 2020An Automotive Perspective by T.J. Wallington, et al.
Table 1. U.S. and EU standards and emissions from selected light-duty gasoline ICE vehicles and
BEVs and non-exhaust brake and tire wear emissions from Winkler et al.1
Standards and Emission mg/km
PM2.5 NOx+HC NOx SO2 CO
Vehicle Standards (test cycle)
US Tier 3 2 53 0.6 1,057
Euro 6 (Gasoline) 0.3 60 1,000
Euro 6 (Diesel) 0.3 170 80 500
U.S. ICE
2020 Best-in-class (HEV) (test cycle) 0.06 2 0.3 31
2018 Fleet average (on-road) 56 20 153
EU ICE
Average Euro 6 gasoline DI ICE (RDE) 0.2–0.4 12–20 17–100
Typical 2020 BEV electricity emissions
2014 U.S. elec. grid 7 71 70 123
2016 U.S. elec. grid 53 59
2018 U.S. elec. grid 46 50
2018 CA elec. grid 28 3
2030 U.S. elec. grid 27 31
Non-tailpipe emissions
Brake wear 2-6
Tire wear 1–5 (PM2.5)
4–13 (PM10)
Notes: BEV emissions and 2018 fleet average were updated. The 2018 California electric grid was added.
Creative Commons License: https://creativecommons.org/licenses/by/4.0/.
(120 mg/m3 on more than 25 days per year). The EU annual generation emissions for a BEV can be comparable to ICE
air quality standard for NO2 is still widely exceeded at roadside vehicle tailpipe emissions. A typical U.S. 2020 BEV has a
sites, although with the progressing fleet renewal toward Euro label electricity consumption of approximately 25 kWh/100
6 and electric vehicles this exceedance is declining and will miles. The U.S. electric grid, on average, produces 0.33 g
continue to decline in the future. NOx/kWh of generated electricity. Assuming 5% grid loss,
the BEV produces upstream NOx emissions of 0.086 g/mile
What’s Ahead? (0.053 g/km), the same as the vehicle standard of 0.086 g
Zero-Emission Vehicles NOx+NMHC/mile (53 mg/km in Table 1). The best-in-class
Limits or bans on internal combustion engine (ICE) vehicles ICE vehicle, a hybrid electric vehicle (HEV) for example,
in several major city centers are being implemented or con- emits 0.004 g NOx+HC/mile, 21 times less than the BEV,
sidered to further control emissions, with the Netherlands, but ICE emissions occur closer to residential areas.
Norway, France, and the United Kingdom considering bans
on the sale of new gasoline and diesel cars by 2025–2040. Table 1 compares the emissions of criteria pollutants for the
The EU Parliament is in favor of registering zero-emission U.S. BEV, best-in-class ICE, and average on-road fleet, a
vehicles (ZEVs) only, starting 2040, as a contribution to the typical Euro 6 gasoline direct-injection (DI) ICE, and the
planned EU target of net carbon neutrality by 2050 (EU applicable EU and U.S. vehicle standards. Ranking by total
Green Deal). ZEV mandates are in place in California, 10 NOx emissions per km, ICE emissions are less than BEV
other U.S. states, and China. emissions, and both are below the new vehicle standards.
As seen in Table 1, California has a grid that is cleaner than
ZEVs—including battery-powered electric vehicles (BEVs) the U.S. average. Electricity generation must transition to
and hydrogen fuel-cell vehicles (FCVs)—have zero tailpipe renewables (e.g., wind, solar) for ZEVs to match ICE vehicle
emissions, but are not zero-emission. Upstream electricity lifecycle NOx emissions. The share of renewable electricity
em • The Magazine for Environmental Managers • A&WMA • April 2020An Automotive Perspective by T.J. Wallington, et al.
Figure 2. Trends in O3, CO, NO2, and PM2.5 in ambient air in U.S. cities.
Source: EPA Air Trends (accessed January 2020).
Note: The solid symbols are the averages and the open symbols are the 10th and 90th percentiles.
The dashed lines are NAAQS.
needs to further increase in all regions to fully leverage the will lead to a significant reduction in NO2 concentrations
advantages of electric vehicles. and it is estimated that less than 1% of roadside air monitors
in Germany in 2030 will exceed the NO2 standard
Non-exhaust emissions have become relatively more impor- compared with 59% in 2016.5
tant as the tailpipe emissions have decreased. Tire and brake
wear PM emissions are of the same magnitude or perhaps With large reductions in LDV emissions the relative impor-
higher than tailpipe emissions. Tire wear is a function of tance of emissions from other sectors have increased.
many factors: heavier BEVs are expected to give more tire Aviation is now the largest transportation source of lead
wear PM emissions while brake wear PM emissions can be emissions in the United States.6 Air quality modeling7
lower on electrified vehicles, which use regenerative braking. indicates that electrification of off-road equipment (e.g.,
Windshield washer fluid is a source of VOC emissions that is garden equipment, construction equipment) would provide
regulated in some locations. greater air quality improvement than on-road electrification.
Consumer products (e.g., adhesives, personal care products,
Future Air Quality etc.) are becoming the single largest source of petrochemical
Air quality models can be used to estimate the benefits of VOC emissions in industrialized cities.8
future vehicle emission regulations and programs. In 2030,
when U.S. Tier 3 standards are fully reflected in the on-road Zero-Impact Emission Vehicles
fleet, it has been projected that O3 will be reduced in most With tailpipe emissions from modern ICE vehicles decreas-
areas, but there may be some exceedances of the standard.4 ing to very low levels, a new concept of “zero-impact emis-
There are diminishing returns of successive vehicle emission sions” is being discussed.9 Zero-impact refers to a level of
regulations. For example, peak O3 declined by 1–13% from emissions so low that it has a negligible impact on air quality.
2008 to 2018 (Tier 1 to Tier 2) but is projected to only As a simple example, Figures 1 and 2 show the large de-
decrease by 1–4% from 2018 to 2030 (Tier 2 to Tier 3). crease in CO emissions since 1970 and the current situation
Substantial air quality improvements are projected in with all monitoring sites having CO levels well below
Europe. Fleet turnover with Euro 6 RDE-compliant vehicles the U.S. National Ambient Air Quality Standard (NAAQS).
em • The Magazine for Environmental Managers • A&WMA • April 2020An Automotive Perspective by T.J. Wallington, et al.
Figure 3. Sustainable mobility options based on low-carbon electricity.
From the viewpoint of CO emissions, modern vehicles are Electrofuels
zero-impact emission vehicles. Climate change is a pressing societal issue and there is a
need for large reductions in fossil CO2 emissions from
Automotive research suggests additional tailpipe emission vehicles and other sources. Electrofuels (E-fuels) are chemical
reductions are possible. By adjusting engine operation fuels synthesized from electricity and water.11 E-fuels
and the aftertreatment system in a research vehicle, exhaust produced using CO2 captured from the air and renewable
NMHC+NOx emissions in the laboratory have been (e.g., wind, solar, or hydro) or nuclear electricity offer
reduced by a factor of 10 below the future SULEV30 net-zero carbon emissions for transport, and would probably
standard.10 see first use in aviation and heavy-duty vehicles where other
em • The Magazine for Environmental Managers • A&WMA • April 2020An Automotive Perspective by T.J. Wallington, et al.
options are more limited. Use of fossil fuels combined with emissions shown in Figure 1 will continue. ICE vehicle
capturing and sequestering CO2 from the air offers an criteria pollutant emissions have reached very low levels.
additional net-zero carbon option. Figure 3 shows the diversity Air quality and human and ecosystem health research is
of options based on renewable electricity to power BEVs, needed to define zero-impact levels for criteria emissions.
hydrogen FCVs, and E-fueled ICE vehicles. It is too early to Electric vehicles eliminate local emissions and when powered
pick winners. A technology neutral framework is needed to using clean grids (e.g., California) have major CO2 and criteria
develop a portfolio of options from which customers can pick pollutant benefits. Future vehicle emissions reduction efforts
according to their needs. might be targeted on reducing the effect of gross emitters,
which represent 2–5% of the fleet, but can produce up to
Future Opportunities half the emissions.12 A lower emissions future lies ahead,
As the on-road fleet turns over and as increasing stringent enabled by ultra-clean internal combustion engine vehicles,
emissions standards come into force, the trend of decreased electric vehicles, and hydrogen fuel-cell vehicles. em
References
1. Winkler, S.L.; Anderson, J.E.; Garza, L.; Vogt, R.; Ruona, W.; Wallington, T.J. Vehicle criteria pollutant (PM, NOx, CO, HCs): emissions: How low should we go?;
Climate and Atmospheric Science 2018, 1 (26); doi:10.1038/s41612-018-0037-5.
2. Chen, Y.; Borken-Kleefeld, J. Real-driving emissions from cars and light commercial vehicles–Results from 13 years remote sensing at Zurich/CH; Atmos.
Environ. 2014, 88, 157-164; doi:10.1016/j.atmosenv.2014.01.040.
3. Calvert, J.G.; Orlando, J.J.; Stockwell, W.R.; Wallington, T.J. The mechanisms of reactions influencing atmospheric ozone; Oxford University Press, 2015.
4. Collet, S.; Minoura, H.; Kidokoro, T.; Sonoda, Y.; Kinugasa, Y.; Karamchandani, P. Evaluation of light-duty vehicle mobile source regulations on ozone concen-
tration trends in 2018 and 2030 in the western and eastern United States; J. Air Waste Manage. Assoc. 2014, 64, 175-183;
doi:10.1080/10962247.2013.845621.
5. Toenges-Schuller, N.; Schneider, C.; Vogt, R.; Hausberger, S. NO2 Air Quality in German Cities: Trend Forecast and Scenarios; Atmos. Environ. 2020,
submitted.
6. Lead Emissions; Report; U.S. Environment Protection Agency, not dated; https://cfpub.epa.gov/roe/indicator_pdf.cfm?i=13.
7. Nopmongcol, U.; Grant, J.; Knipping, E.; Alexander, M.; Schurhoff, R.; Young, D.; Jung, J.; Shah, T.; Yarwood, G. Air Quality Impacts of Electrifying Vehicles
and Equipment Across the United States; Environ. Sci. Technol. 2017, 51, 2830-2837; doi:10.1021/acs.est.6b04868.
8. McDonald, B.C.; de Gouw, J.A.; Gilman, J.B.; Jathar, S.H.; Akherati, A.; Cappa, C.D.; Jimenez, J.L.;
Lee-Taylor, J.; Hayes, P.L.; McKeen, S.A.; Cui, Y.Y.; Kim, S.-W.; Gentner, D.R.; Isaacman-VanWertz, G.; Goldstein, A.H.; Harley, R.A.; Frost, G.J.; Roberts, J.M.;
Ryerson, T.B.; Trainer, M. Volatile chemical products emerging as largest petrochemical source of urban organic emissions; Science 2018, 359 (6377), 760-
764; doi:10.1126/science.aaq0524.
9. Reitz, R.D.; et al. Editorial: The future of the internal combustion engine; Int. J. Eng. Res. 2020, 21, 3-10 doi:10.1177/1468087419877990.
10. Kawaguchi, B.; Umemoto, K.; Misawa, S.; Hirooka, S.; Kawai, T. ICE Vehicle Challenge toward Zero Emissions: Future Technology Harmonization in Electrified
Powertrain System; SAE Technical Paper 2019, 01, 2217.
11. Lehtveer, M.; Brybolf, S.; Grahn, M. What Future for Electrofuels in Transport? Analysis of Cost Competitiveness in Global Climate Mitigation; Environ. Sci.
Technol. 2019, 53, 1690-1697; doi:10.1021/acs.est.8b05243.
12. Bishop, G.A.; Schuchmann, B.G.; Stedman, D.H.; Lawson, D.R. Multispecies remote sensing
measurements of vehicle emissions on Sherman Way in Van Nuys, California; J. Air Waste Manage. Assoc. 2012, 62, 1127-1133; doi:10.1080/10962247.
em • The Magazine for Environmental Managers • A&WMA • April 2020Electric Vehicles by Gary A. Bishop
Are Electric Vehicles a
Panacea for Reducing
Ozone Precursor
Emissions?
As electric vehicles begin to enter the market
in increasing numbers, the author asks what
vehicles are they most likely to displace in
evaluating their ability to have a meaningful
impact in reducing ozone precursor emissions
across the United States?
em • The Magazine for Environmental Managers • A&WMA • April 2020Electric Vehicles by Gary A. Bishop
During the past three decades emissions from on-road fuel-specific emission measurements from passing vehicles
vehicles have been reduced dramatically.1,2 With the intro- at locations across the United States since the late 1980s.
duction of new vehicles that have met increasingly stringent Using absorption spectroscopy our Fuel Efficiency Auto-
emissions standards, reductions of 80%–90% in carbon mobile Test (http://www.feat.biochem.du.edu) units measure
monoxide (CO) and hydrocarbon (HC) emissions have been tailpipe emitted pollutants as molar ratios to CO2, which can
achieved, while oxides of nitrogen (NOx) emissions have been be easily converted into grams of pollutant/kilogram of fuel
cut by more than half. These reductions have enabled all consumed knowing the carbon fraction of the fuel.5 One of
areas of the country to meet the U.S. National Ambient Air the most significant results of this work has been to highlight
Quality Standards (NAAQS) for CO and nitrogen dioxide. the importance of the vehicle fleet’s emission distribution to
However, ozone, which is a secondary product formed in the total emissions.
atmosphere from the reaction of HC and NOx emissions, still
exceeds the standard in many areas of the country.3 Vehicle emissions are not normally distributed—where the
median vehicle in the fleet is close to also representing the
The continuing difficulty in meeting the NAAQS for ozone, mean emission vehicle—but are highly skewed, where a
combined with the large reductions in vehicle emissions small number of vehicles are responsible for a disproportion-
that has already occurred, has led some state authorities to ate share of the total. In today’s on-road fleets, it is common
look at electrification of the vehicle fleet as a way to further to find that the highest emitting 1% of the fleet is responsi-
reduce vehicle tailpipe emissions. For example, the Denver ble for more than a third of the CO and HC emissions, and
metro area was recently reclassified from a moderate to a a quarter of the NOx emissions. In these distributions one
serious ozone non-attainment area and the Governor of finds that the most common vehicle (the median) has emis-
Colorado has publicly touted electric cars as one way the sions that are factors of 2 to 10 lower than the mean. This
state plans to meet the ozone NAAQS by 2021.4 This is results from the fact that the majority of vehicles in the cur-
an easy sell to the public because the idea of replacing an rent U.S. fleet (60% or more, depending on the pollutant)
internal combustion engine with a “zero-emitting” vehicle today have near-zero tailpipe emissions.
seems a simple slam dunk for quickly reducing all tailpipe
emissions, not just carbon dioxide (CO2) emissions. How- Emissions Percent Contributions
ever, careful analysis of current fleet emission distributions Figure 1 contains three graphs that detail the emissions
leads to predictions of significantly lower reductions from percent contributions by fuel and vehicle type versus model-
this strategy in the near term. year for CO (top), HC (middle), and NOx (bottom) emissions
using data all collected in 2018 in Denver (January),
Fuel Efficiency Automobile Tests Chicago (September), and Los Angeles (May). For these
The University of Denver has been remotely collecting graphs, gasoline trucks, as classified for emission purposes
Be a part of the premier conference on measurements technology.
One of our most popular specialty conferences, the Air Call for Abstracts open through May 4. Submit
Quality Measurement Methods and Technology abstracts of 200-400 words to measurements@awma.org.
Conference returns in 2020 with its extensive coverage of
Topics include, but are not limited to:
all aspects of air measurement methodologies including
associated quality assurance protocols and how to use and • Air monitoring
interpret data. • Fenceline monitoring
• Toxic air containment (TAC) measurements
Sessions will focus on current hot topics including • Low-cost sensors
emerging contaminants such as PFAS, low-cost sensors, • Next generation emissions monitoring (NGEM)
next generation emissions monitoring (NGEM), and
• Remote sensing of greenhouse gases
airborne measurements to assess impacts from wildfires.
• Mobile monitoring platforms
This conference features a vendor exhibit with 30 booths,
Sponsorship and exhibit opportunities are available at
courses, a reception, and plenty of networking
various levels. Reserve your spot now, this exhibit sells
opportunities. out quickly.
Find the full Call for Abstracts and conference details at www.awma.org/measurements.
em • The Magazine for Environmental Managers • A&WMA • April 2020Electric Vehicles by Gary A. Bishop
Chicago has the youngest fleet (7.5
8 8 years old), likely due to wintertime road
Denver
Percent Contribution
2009 & Newer salt, and the lowest diesel fraction
gCO/kg of Fuel 6 57% of Fleet 6 (1.6%). Denver has the oldest fleet
Fleet Percent
7% of CO (9.2 years old) and the largest truck
(69%) and diesel fractions (3.4%),
4 4 while the Los Angeles site has the
highest percentage of vehicles classi-
2 2 fied as passenger (59%) and hybrids
(7%). While these differences are influ-
enced by factors specific to that region
0 0
of the country, the emissions behavior
8 Chicago of the vehicles result in an emissions
Percent Contribution
2009 & Newer 8 distribution that are all similar.
gHC/kg of Fuel
6 73% of Fleet
Fleet Percent
58% of HC
6 Beginning with the 2009 model-year,
Diesel all new vehicles sold in the U.S. met
4 Gas Truck 4 the Federal Tier II or California Low
Gas Passenger
Fleet Percent Emission Vehicle (LEV) II standards for
2 2 tailpipe emissions. These vehicles have
Median MY
proven to have consistently low emis-
0 0 sions for CO, HC, and NOx and the
8 West Los Angeles
ability to maintain those low emissions
Percent Contribution
for many years.6 This is reflected in the
2009 & Newer 8
gNOx/kg of Fuel
61% of Fleet annotations for each city that details
6
Fleet Percent
10.5% of NOx the fraction of the fleet represented
6 by these 2009 and newer vehicles and
4 their contribution to the total emissions.
4 For CO and NOx, the overwhelming
2 majority of the emissions are con-
2 tributed by a minority of the fleet that
is older than these 2009 and newer
0 0 model-year vehicles. HC is the one ex-
1981 1986 1991 1996 2001 2006 2011 2016 ception; however, keep in mind that
Model Year these graphs are the percent of the
total emissions generated by the ob-
served fleet. Successful reductions in
Figure 1. Percent emissions contribution by fuel and vehicle
HC emissions have extended to vehi-
type (left y-axis) for CO in Denver (top), HC in Chicago (middle),
cles significantly older than the 2009
and NOx emissions in West Los Angeles (bottom) versus model- model-year vehicles and we now gen-
year data collected in 2018. erally find that HC emissions do not in-
Notes: The fleet percent (dashed line) is plotted on the right y-axis. Each city’s crease with age until after the first 20
median model-year vehicle is the open circle. The percent of the total of each model years that have the same near-
fleet 2009 and newer model-year vehicles is given and its contribution to the zero emissions.2 This results in the
total emissions. emissions contribution trend closely fol-
lowing the fleet percentage trend as
seen in the middle graph.
by the U.S. Environmental Protection Agency (EPA), include
vans, sport utility vehicles (SUVs), and light- and medium-duty As emissions have decreased, dramatic changes in the fleet
trucks (weight classes 1-6). The fuel-specific percent contribu- makeup have occurred as well. U.S. vehicle fleets have histori-
tion (left axis) of the fleet total is the product of each model- cally been dominated by passenger vehicles with trucks being
year’s mean emissions and its fleet percent representation largely composed of pickups. With the popularity of vans and
(right axis) divided by the total. The median model-year for all sizes of sport utility vehicles the in-use truck fleet, as classi-
each data set is plotted as an open circle and the minimum in fied by EPA emissions certification standards, has steadily
fleet percentage seen in 2009 is the result of the 2008 reces- grown to where today trucks are typically the dominant type
sion. Each species graph looks substantially similar regardless found. This is often also reflected in the emission contributions
of location used.6 We have chosen to show a different species breakdown, as shown in Figure 1, where trucks (gas and
for each city to emphasize that this is a not just a characteristic diesel) account for 59% of the total CO in Denver, 47% of the
of a single area of the country but reflects the entire U.S. fleet. HC in Chicago, and 58% of the total NOx in West Los Angeles.
em • The Magazine for Environmental Managers • A&WMA • April 2020You can also read