LOWER TANA DELTA INDIGENOUS AND COMMUNITY CONSERVED AREA - ECOSYSTEM SERVICES ASSESSMENT - Nature Kenya
←
→
Page content transcription
If your browser does not render page correctly, please read the page content below
LOWER TANA DELTA
INDIGENOUS AND COMMUNITY
     CONSERVED AREA
ECOSYSTEM SERVICES ASSESSMENT
         REPORT 2021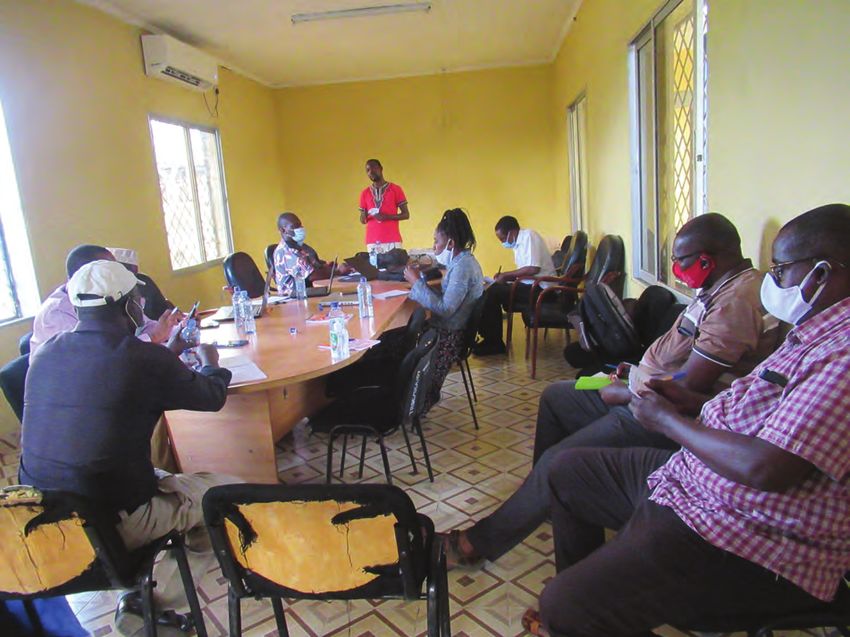

LOWER TANA DELTA
INDIGENOUS COMMUNITY CONSERVED AREA
 ECOSYSTEM SERVICES ASSESSMENT REPORT

              NATIONAL MUSEUMS OF KENYA

                 where heritage lives on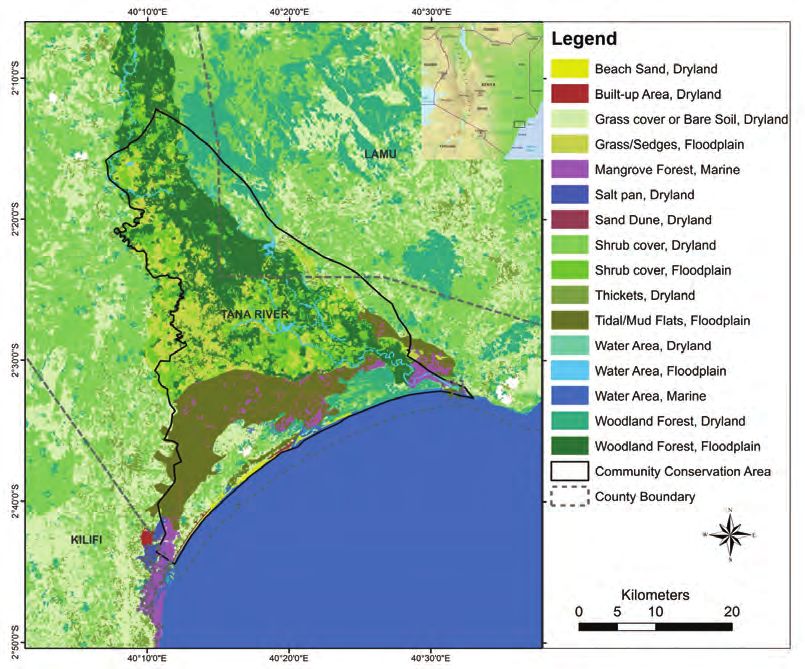
LIST OF ABBREVIATIONS
EN		             Endangered
CR		             Critically Endangered
IVM		            Institute for Environmental Studies
CBO		            Community based organisation
GHG		            Greenhouse gas
GIS		            Geographical information system
GWP		            Global warming potential
IBA		            Important Bird Area
ICCA		           Indigenous and community conservation area
IPCC		           International Panel on Climate Change
IUCN		           International Union for Conservation of Nature
KFS		            Kenya Forest Service
Ksh		            Kenyan shilling
KWS		            Kenya Wildlife Service
LUP		            Land Use Plan
NEMA		           National Environment Management Authority
NGO		            Non –governmental organisation
PES		            Payment for ecosystem service
RSPB		           Royal Society for the Protection of Birds
SEA		            Strategic Environmental Assessment
TESSA		          Toolkit for Ecosystem Service Site-based Assessment
WRA		            Water Resource Authority
WWF		            World Wide Fund for Nature
BPS		            British Psychological Society
TARDA		          Tana and Athi Rivers Development Authority
NAFIS		          National Farmers Information Service
LAPPSET          Lamu Port and Lamu Southern Sudan-Ethiopia Transport Corridor
UNEP-WCMC        United Nations Environment Programme – World Conservation Monitoring Centre
ICIPE		          International Centre of Insect Physiology and Ecology

Compiled by
Rob Field
Paul K. Muoria
Paul Gacheru
Chris Magin
Paul Matiku
Serah Munguti
George Odera
Dickens Odeny

Edited by
Fleur Ngw’eno
John Mwacharo

Disclaimer
The contents of this report are the sole responsibility of its authors and do not necessarily reflect the
views of the funders (Darwin Initiative and Global Environment Facility)

ISBN 9966-761-45-4

Suggested Citation
Field, R., Muoria P., Gacheru, P., Magin, C., Matiku. P., Munguti, S., Odera, G., Odeny, D., Makhanu,R. (2018)
Ecosystem Service Assessment of the implementation of a Community Conserved Area in the lower
Tana Delta. Nature Kenya/RSPB. Nairobi.

                                                      ii
TABLE OF CONTENTS
LIST OF ABBREVIATIONS ............................................................................................................................ ii
TABLE OF CONTENTS ................................................................................................................................. iii
LIST OF TABLES ........................................................................................................................................... iv
LIST OF FIGURES ......................................................................................................................................... iv

EXECUTIVE SUMMARY ................................................................................................................................. 1

1. INTRODUCTION ......................................................................................................................................... 3
   1.1  Site Description .................................................................................................................................................... 3
        1.1.1   Geographical Location and General Information ............................................................................ 3
        1.1.2   Biodiversity Value .......................................................................................................................................... 3
   1.2  Ecosystem Services from Tana Delta ICCA ................................................................................................ 4
   1.3  Stakeholders within Tana Delta ..................................................................................................................... 4
   1.4  Rationale for Ecosystem Service Assessment .......................................................................................... 4
        1.4.1   Importance of Tana Delta Ecosystem Service Assessment ....................................................... 4
        1.4.2   General Approach ......................................................................................................................................... 5

2. PARTICIPATORY SCOPING OF ECOSYSTEM SERVICES PROVIDED BY TANA COMMUNITY
CONSERVED AREAS ..................................................................................................................................... 7
  2.1  Introduction ........................................................................................................................................................... 7
  2.2  Methods .................................................................................................................................................................. 7
  2.3  Results ..................................................................................................................................................................... 8
       2.3.1  Outcome of the Stakeholder Workshop .............................................................................................. 8
       2.3.2  The Importance of Ecosystem Services in the Current and
              in Plausible Future Scenarios ................................................................................................................... 8
  2.4  Recommendations from Scoping Exercise .............................................................................................. 10

3. SOCIO ECONOMIC CONTEXT OF THE ICCA DEPENDENT LOCAL COMMUNITY ............................... 11
  3.1  Introduction .......................................................................................................................................................... 11
  3.2  Methods .................................................................................................................................................................. 11
  3.3  Results .................................................................................................................................................................... 11

4. DETAILED ASSESSMENT ....................................................................................................................... 13
  4.1  Description of Alternative States Adopted for Detailed Assessment ............................................. 13
  4.2 Determining Land-Use/Land-Cover Areas and Livestock
       Numbers in the Tana Delta ICCA over the Period 2017-2050 under
       Three Different Development Scenarios ................................................................................................... 13
  4.3 Assessment of Climate Regulation Potential of Tana Delta ICCA ................................................... 14
       4.3.1  Methods ............................................................................................................................................................ 14
       4.3.2  Results ............................................................................................................................................................... 17
       4.3.3. Discussion ........................................................................................................................................................ 19
  4.4 Assessment of the Value of Cultivated Goods ....................................................................................... 20
       4.4.1  Methods ........................................................................................................................................................... 20
       4.4.2 Results and Discussion ............................................................................................................................. 20
  4.5 Assessment of the Value of Harvested Goods ........................................................................................ 22
       4.5.1  Methods ............................................................................................................................................................ 22
       4.5.2  Results ............................................................................................................................................................... 23
       4.5.3  Discussion ........................................................................................................................................................ 26
  4.6 Water provision, Flood Regulation and Water Quality Regulation Services ............................... 27
       4.6.1  Methods ............................................................................................................................................................ 27
       4.6.2  Results ............................................................................................................................................................... 27
       4.6.3  Discussion ........................................................................................................................................................ 32

5. NET VALUE OF SERVICES MEASURED ................................................................................................. 33
  5.1  Results and Discussion ................................................................................................................................... 34

6. CONCLUSIONS AND RECOMMENDATIONS ......................................................................................... 36

REFERENCES ............................................................................................................................................... 37
APPENDICES ............................................................................................................................................... 39

                                                                                          iii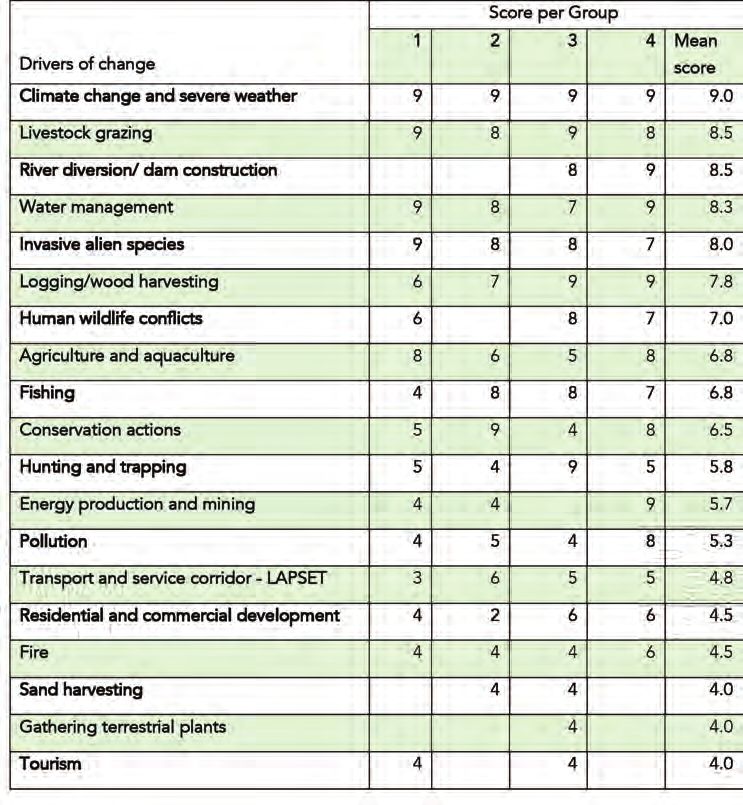
LIST OF TABLES
Table 1 Major threats to ecosystem health of Tana Delta, according to stakeholders ....................... 9
Table 2 Stakeholder perceptions on the importance of various ecosystem services ......................... 9
Table 3 Main livelihood activities of the Household heads ................................................................................ 11
Table 4 Ranks of various expenses by residents according to residents of Tana Delta ICC ........... 12
Table 5 Staple foods for households in the Tana ICCA ........................................................................................ 12
Table 6: Predicted changes in land-use/land-cover areas in the Tana Delta ICCA
over the period 2017-2050 under three different development scenarios ............................. 14
Table 7: Predicted changes in domestic livestock numbers in the Tana Delta ICCA
over the period 2017-2050 under three different development scenarios ............................. 14
Table 8 Carbon storage factors applied to land-cover areas for each scenario ..................................... 15
Table 9 Land-cover/land-use emissions factors applied to land-cover areas for
each scenario .............................................................................................................................................................. 16
Table 10 Livestock emissions factors applied to scenario livestock herd numbers .............................. 17
Table 11 Calculation of the output and costs attributable to arable production for village
farms, the commercial rice farming and commercial sugar farming on land
within the ICCA ........................................................................................................................................................ 20
Table 12 Total net income from rice, sugar cane and village farming across current
and future possible land areas ......................................................................................................................... 21
Table 13 Total food yield in tonnes from subsistence farming, and commercial rice and sugar
farming enterprises across current and three possible future land-use scenarios ........... 21
Table 14 Proportional change in the value of ecosystem services between 2017 and
three future scenarios ........................................................................................................................................... 23
Table 15 Value of livestock fodder in Tana Delta ...................................................................................................... 24
Table 16 Goods harvested by respondents interviewed in the proposed ICCA ...................................... 25
Table 17 Value of harvested goods in the ICCA ......................................................................................................... 25
Table 18 Fisheries production in Tana Delta ............................................................................................................... 27
Table 19 Quantity of water used by ICCA residents ................................................................................................. 21
Table 20 Costs of Greenhouse Gas Emissions on world markets for various schemes ...................... 33
Table 21 Estimates of net value of services measured and value-able in the
Lower Tana Delta ICCA, using two estimates of costs of CO2 and GHG emissions ........... 35
Table 22 Estimated value of selected services from Tana Delta Mangrove forest ................................ 35
LIST OF FIGURES
Figure 1 Study Site ........................................................................................................................................................................ 3
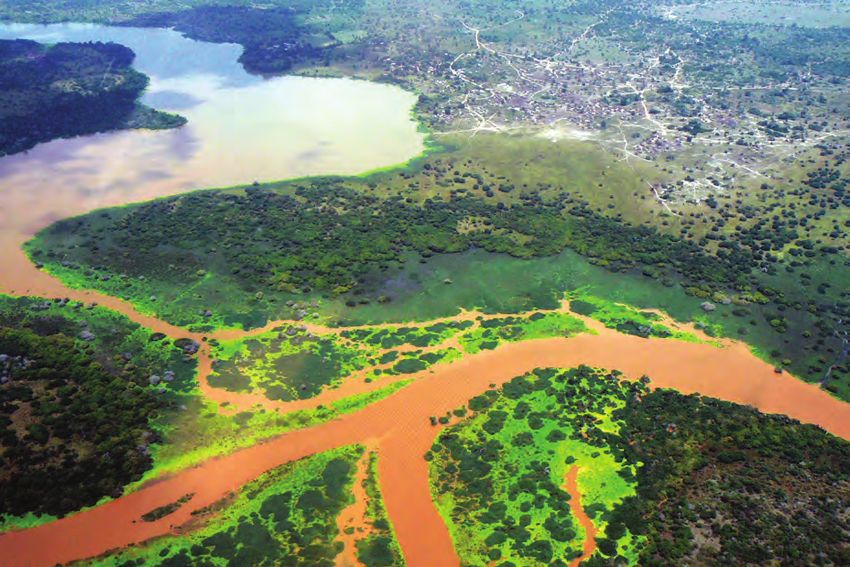
Figure 2 Sea water intrusion in the Tana Delta ICCA ................................................................................................ 5
Figure 3 Stakeholder perception on changes in ecosystem service provision in the
current and future scenarios ............................................................................................................................. 10
Figure 4 Age distribution of Household heads in Tana ICCA .............................................................................. 11
Figure 5 Monthly income of residents of Tana Delta ICCA .................................................................................. 12
Figure 6 Sources of income for Tana River ICCA residents .................................................................................. 12
Figure 7 Percentage difference in total carbon stored in vegetation and soil in the
Tana Delta area under three land-use scenarios between 2017 and 2050 ............................. 17
Figure 8 Change in annual global warming potential of land-cover and land-use in
the Tana Delta ICCA from 2017 to 2050 across the three land-use scenarios ...................... 18
Figure 9 Difference in the annual global warming potential of the Tana Delta ICCA
under three land use scenarios between 2017 and 2050 ................................................................. 18
Figure 10 Sources of water for residents in Tana Delta ICCA ............................................................................... 28
Figure 11 Sources of water for various uses by season ........................................................................................... 28
Figure 12 Perceived variation in water adequacy for irrigation (a) and for livestock
production (b) in Tana ICCA .............................................................................................................................. 29
Figure 13 Proportion of Tana River ICCA who have problems with water quality (a)
and type of problem (b) ...................................................................................................................................... 30
Figure 14 Annual trend in the Frequency of flooding based on respondents .......................................... 30
Figure 15 Perceived flooding pattern in Tana River Delta ..................................................................................... 31
Figure 16 Negative impacts of flooding ........................................................................................................................... 31
Figure 17 Perceived advantages of flooding ................................................................................................................. 31
iv
ACKNOWLEDGMENTS
The work reported here was made possible by the generous support of the United Kingdom (UK)
Government through the Darwin Initiative, Project number: 24-013: Balancing water services for
development and biodiversity in the Tana-Delta; and the Global Environment Facility (The Restoration
Initiative) project: Enhancing Integrated Natural Resources Management to Arrest and Reverse Current
Trends in Biodiversity Loss and Land Degradation for Increased Ecosystem Services in the Tana Delta,
Kenya.

Our gratitude to all members of the communities and stakeholders of the Tana River Delta who gave
their time to enable compilation of this report.

Our appreciation also to Dickens Odeny for GIS support; Peter Nelson for assistance with developing
scenarios; and enumerators for their assistance in data collection.

                                                 v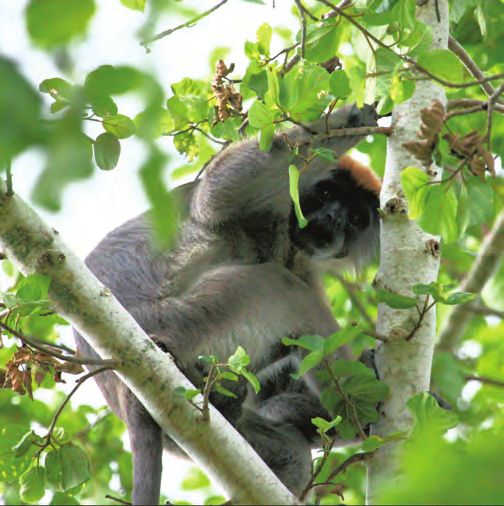
EXECUTIVE SUMMARY
The Tana River Delta is globally recognized as a Ramsar Site and encompasses two Important Bird Areas.
Forest fragments found along Tana River are the only home for two globally threatened primates – the
Critically Endangered Tana River Red Colobus (Piliocolobus rufomitratus) and the Endangered Tana
River Mangabey (Cercocebus galeritus). The delta ecosystem supports agriculture, livestock keeping
and fishing – the dominant livelihoods of the local communities.

Recently, the Delta’s ecosystems have come under increasing threat. The rapidly expanding human
population is exerting increased pressure on land availability. Larger livestock herds have led to
overgrazing while water and resource competition have caused inter-ethnic conflicts. The Delta has
attracted private and state corporations which are keen on converting part of the Delta into large scale
agricultural enterprises.

The region has been experiencing a major challenge due to climate change, with frequent prolonged
droughts interspersed with flooding events during the wet season. Large scale infrastructure
development planned by the Kenya Government in the wider Tana River Basin (including large scale
dams for irrigation and electric power generation) are expected to exacerbate pressure on the lower
Delta ecosystems.

In 2015 the County Governments of Tana River and Lamu completed a Land Use Plan that sought to
balance the conflicting interests of various Tana Delta stakeholders. The land use plan recommends
management of 140,700 hectares out of the Delta’s 225,000 hectares (2,250 km2) as habitats for nature
conservation. This encompasses the 116,867ha Tana Delta Indigenous and Community Conservation
Area (ICCA) which forms a large chunk of land to be managed for nature conservation in the lower flood
plain. This ecosystem service assessment was conducted to inform the implementation of the proposed
ICCA.

This assessment was conducted using the methods of the Toolkit for Ecosystem Service Site-based
Assessment (TESSA) protocols (Peh et al., 2013). A participatory ecosystem service scoping exercise was
carried out in July 2017. Thereafter, we conducted detailed assessments of the 2017 value of climate
regulation, cultivated goods, harvested wild goods and water services. Most of the data on cultivated
crops, harvested wild goods and water services were obtained by interviewing residents of the proposed
ICCA.

We then extrapolated the value of these services in three future alternative scenarios initially elaborated
in the Tana Delta Strategic Environmental Assessment and Land Use Plan (Odhengo et al., 2014a, b)
namely: Scenario C (Hybrid scenario), Scenario ‘B Sugar’ (Bs) and Scenario ‘B No Sugar’ (Bns). In Scenario
C conservation and development coexist. In Scenario Bs a commercial development pathway that allows
for significant areas to be used for commercial development including sugar production is allowed.
Scenario Bns allows for commercial development and livestock herd increases but no commercial sugar
production.

We used published estimates of carbon stocks of equivalent habitats to estimate carbon stocks in the
different habitats of the proposed ICCA. We also based our estimates of fluxes of greenhouse gases (CO2,
CH4 and N2O) and emissions factors on published, peer-reviewed values. Our results indicated that the
amount of carbon stocks will be lower in all the future scenarios compared to the 2017 levels, but the
decrease will be greatest in the Bs scenario. Although the site had a climate cooling effect in 2017 this
service will be lost if livestock numbers continue rising while forest cover reduces.

To estimate the net value of measured services offered by the ICCA, the values of marketable services
(cultivated and wild harvested goods and recreation) were added to the estimated values of (or cost of)
the emissions of GHGs caused or not by the land-uses within the ICCA under each scenario.

The total value of harvested goods was estimated at over Ksh 2 billion in 2017 but at Ksh 1.13 billion, 1.75
billion, and 4.65 billion under Scenarios C, Bs and Bns, respectively. Livestock grazing was the most
valuable harvested wild good valued at Ksh1.85 billion in 2017, Ksh 0.55 billion in scenarios C, about Ksh
1 billion in scenario Bs and Ksh 4 billion in scenario Bns. It is however important to note that livestock
numbers cannot continue growing indefinitely in the commercial scenario due to limitation of land.
Other harvested wild goods included fuel (charcoal and firewood), honey and construction materials
(building poles, thatching material and timber).

A Wetland of International Importance especially as Waterfowl Habitat www.ramsar.org
1

                                                             1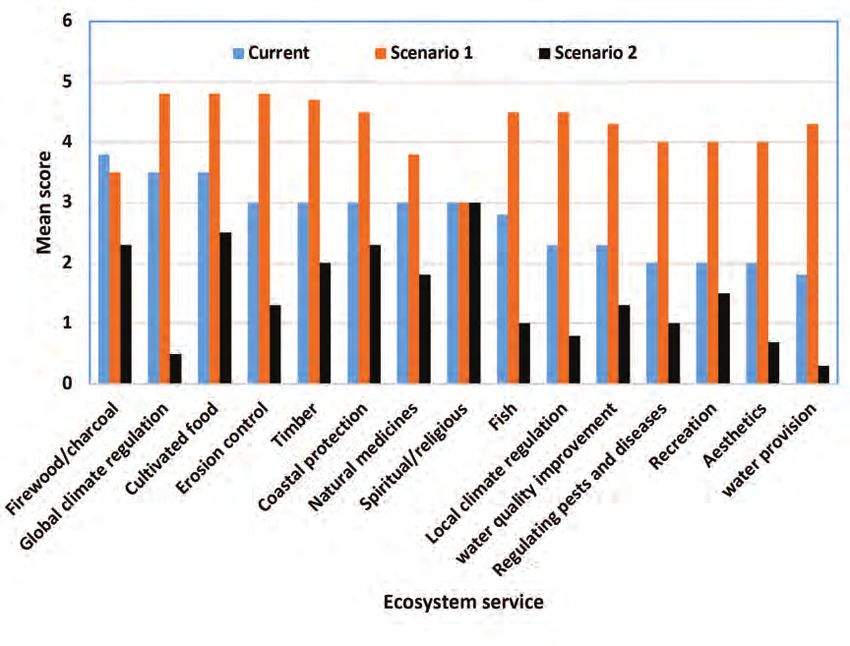
All the residents of the ICCA currently obtain water for their various uses from several sources within
the ICCA. Flooding was perceived to be a problem by about 62% per cent of the residents due to
disease outbreaks, crop destruction, livestock loss, damage to infrastructure including houses and
other equipment, displacement, disruption of transport and education. However, the residents
acknowledged flooding leads to improved food security through improved fisheries, livestock and
agricultural production. A hydrological study conducted alongside the ecosystem services assessment
recommended that 1,000ha be placed on community driven pumped irrigation schemes in the period
2018-2025 or until a river regulating reservoir is constructed upstream of the Tana River Primate National
Reserve (Nelson, 2018).

There is need to explore sustainable ways of enhancing the economic status of the local residents.
Payment for Ecosystem Services (PES) can be one of the mechanisms for enhancing the income levels of
the local residents. This study has demonstrated the potential to develop a PES scheme based on carbon
credits. Another option is developing the tourism potential. However, this is hindered by insecurity and
poor infrastructural development in the area. Livestock production can also be improved with emphasis
on sustainable production by targeting breed improvement and value addition of livestock products.
Other sectors that can be improved include apiculture and ecotourism. Although commercial sugar
production seems to be profitable, it has high environmental and societal costs and would not uplift the
income levels of the local residents.

In this study we have put into context some of the future plans for the ICCA and compare the effects
on some of the major services. However, further studies on some of the ecosystem services including
tourism/recreation potential, cultural values attached to the various ecosystems and the value of coastal
protection need to be carried out so that a more complete balance sheet of the possible future uses of
services and land in the lower delta can be developed.

                                                   2
1. INTRODUCTION

1.1 Site Description                                         globally threatened Madagascar Pratincole were
                                                             observed arriving in the Delta.
1.1.1 Geographical Location and General
Information                                                  Tana River forests are characterised by high levels
This ecosystem service assessment was conducted              of endemic plant and animal species. At least 61
for the proposed Indigenous and Community                    plants found in the forests are globally or nationally
Conservation Area (ICCA) located at the heart of             rare species (Bennun and Njoroge, 1999). The
the lower Tana Delta flood plain. It comprises a rich        forests are the only home for two endangered
mosaic of habitats including riverine forest, lakes,         primates – the Tana River Red Colobus (Procolobus
swamps, open water, river channels, mangroves                rufomitratus) and the Tana River (Crested)
and grassland (Figure 1, Table 1). The ecosystem is          Mangabey (Cercocebus galeritus) which are both
dependent on the continued flow of River Tana.               endemic to the site, with the Tana River Red
Administratively, a large percent of the site is             Colobus being among the 25 most endangered
within Tana River County while the rest is within            primates in the world (Schwitzer et al., 2015). Other
Lamu County.                                                 mammalian species of conservation concern at
                                                             the site include the Dugong (Dugong dugong),
1.1.2 Biodiversity Value                                     Hippopotamus        (Hippopotamus        amphibius),
The site is part of Tana River Delta which has two           Elephants (Loxodonta africana), and the range-
Important Bird Areas (Tana Delta and Tana River              restricted East African coast subspecies of the
Forests); it is a Ramsar Site, a Key Biodiversity Area       Topi (Damaliscus lunatus topi). The first three
(KBA) and a Global Biodiversity Hotspot that is part         are all are listed as vulnerable and the fourth as
of the Coastal Forests of Eastern Africa Hotspot.            endangered by IUCN (http://www.iucnredlist.org).
At least 345 species of birds including 5 globally           Twenty-two freshwater fish species are recorded
threatened species (Southern Banded Snake                    from the lower Tana (BirdLife International,
Eagle, Fischer’s Turaco, East Coast Akalat, Plain-           2018). This includes three eels Anguilla spp. and a
backed Sunbird and Basra Reed Warbler) and four              distinct subspecies of Petrocephalus catostoma.
regionally threatened bird species were identified           The mangroves are important breeding grounds
by Bennun and Njoroge, 1999. Recent surveys                  for many fish and crustaceans. Three globally
have revealed that the Tana Delta holds globally             threatened turtles (Chelonia mydas (Endangered),
important populations of Critically Endangered               Eretmochelys imbricata (Critically Endangered)
White-backed Vulture. Hooded (CR), White-                    and Lepidochelys olivacea (Endangered)) nest in
headed (CR) and Lappet-faced (EN) vultures also              the Delta’s sandy beaches.
occur. Furthermore, in April 2019 thousands of

                                              Fig 1. Study Site

                                                         3
1.2 Ecosystem Services from Tana Delta • The national government agencies with a
ICCA mandate in environmental conservation and
Ecosystem services are the goods and services agriculture including, but not limited to, Kenya
humans derive from ecosystems for well-being. Forest Service (KFS), Kenya Wildlife Service
The potential ecosystem services that can be (KWS), National Environmental Management
obtained from ecosystems like Tana Delta can Authority (NEMA), and Water Resources
be classified as provisioning, regulating, cultural Authority (WRA).
or supporting services (Millennium Ecosystem • Conservation NGOs operating in the Delta
Service Assessment, 2005; Hamerlynck in Odhengo including Nature Kenya, BirdLife International,
et al., 2014). WWF (World Wide Fund for Nature).
• Community based organisations (CBOs)
• Provisioning Services: Forests within the delta operating at the site level.
provide fuel wood, timber and other building
materials and store water. Forests also provide 1.4 Rationale for Ecosystem Service
bush meat, wild fruits, mushrooms, honey Assessment
and herbal medicines to many forest-adjacent
communities. Goods from wetlands in the 1.4.1 Importance of Tana Delta Ecosystem
delta include livestock fodder, fish, water, clay Service Assessment
(for house construction, brick making and for The key socio-economic and environmental issues
pottery), honey and palm wine. relevant to Tana Delta were extensively discussed
• Regulating Services: Forests and swamps are by Odhengo et al., (2014b). Some of these revolve
some of the most important carbon sinks. around the fact that the Delta is currently largely
Through the process of photosynthesis, plants unprotected, leading to influx of land prospectors,
sequester carbon, and are therefore important including small and large farming interests.
in regulating global climate. Forest vegetation Another key issue is changes in the hydrology
traps and absorbs water, and releases it slowly and water use. The river’s dynamic water course
thereby regulating water supply and flooding. (Wahungu et al., 2005) leads to changes in the
By storing and releasing water, forests reduce spatial and temporal resource use dynamics. In
the effects of drought. Forests also moderate addition, there has been upstream over-abstraction
local weather and climatic conditions and of water, and resource-based conflicts between
prevent soil erosion. A healthy delta ecosystem pastoralist and agricultural communities. Human-
provides diverse services thus enabling local wildlife conflicts are rising without commensurate
communities to adapt to impacts of extreme benefits to the affected communities. At the same
events particularly those associated with time, the human population in the delta is rising
climate change. at a rate of 2.9 % per annum in Tana River County
• Cultural Services: Tana Delta has a high but (https://www.citypopulation.de/php/kenya-admin.
unrealized tourist potential due to its diverse php?adm2id=04 ) and 3.4% in Lamu County
wildlife and landscapes. In addition, some (https://www.citypopulation.de/php/kenya-admin.
forest patches are the sites of religious and php?adm2id=05 ). The delta ecosystem services
cultural ceremonies. and the associated livelihoods are likely to be
• Supporting Services: Provisioning, cultural negatively affected by climate change (Odhengo
and regulating services are supported by et al., 2014b) including sea water intrusion which
processes like nutrient cycling, water cycle and currently affects a fifth of the delta. The affected
primary production. area is 30 kilometres from the sea, an area of 28,294
Ha. Socio-economic developments in the entire
1.3 Stakeholders within Tana Delta Tana River basin, resulting in increasing water
The site’s ecosystem services are of interest to abstraction for irrigation and for rapidly urbanising
many stakeholders including: human settlements, are expected to negatively
• Local communities who rely on the Delta impact the Delta’s capacity to sustain ecosystem
for food (fish and cultivated crops), livestock service provision to the Delta communities.
fodder, water, fuelwood, herbal medicines, Implementation of the Tana Delta Land Use Plan
timber and other building materials. (Odhengo et al., 2014a) is designed to balance
• Large scale private agricultural enterprises these competing and conflicting interests. The
which view the Delta as prime agricultural establishment of an Indigenous and Community
land. Conserved Area is a contributory activity to
• Tana River and Lamu county governments achieving this balance. A clear understanding of
who have the legal mandate on community the value of ecosystem services currently being
owned land. provided by the ICCA and how the value of these
services will change is necessary.
4Fig 2. Sea water intrusion in the Tana Delta ICCA. The affected area is 30
kilometers from the sea, an area of 28,294 Ha—tidal area in the map – D. Odeny
1.4.2 General Approach data source for assessing the value of harvested
The Toolkit for Ecosystem Service Site-based wild goods, cultivated goods (including honey
Assessment (TESSA) Peh et al., (2013: http:// production) and water services. This questionnaire
www.birdlife.org/worldwide/science/assessing- was administered in 28 villages within the proposed
ecosystem-services-tessa) was used to conduct ICCA. Villages were first clustered using the land
this exercise. A participatory ecosystem service use practices in which most of the residents were
scoping exercise was carried out on 14 July 2017 engaged. The clusters were eight farming villages,
following the methods of TESSA. This helped to eight pastoralist villages, five villages in mangrove
identify ecosystem services to be included in the and river mouth habitat, and seven villages in
detailed assessment, as well as in the formulation the upper parts of the ICCA including those in
of plausible alternative states (see Chapter 2). Lamu County. One enumerator was recruited
Thereafter we conducted detailed assessments from each of the villages. To ensure that the local
of climate regulation, cultivated goods, harvested community was effectively engaged and aware of
wild goods and water services. Most of the data the exercise, Nature Kenya organized awareness
on cultivated crops, harvested wild goods and creation meetings in strategic locations in the
water services were obtained by interviewing 408 proposed ICCA. In addition, each enumerator led
residents of the proposed ICCA. As outlined in Box a meeting with key stakeholders in their villages
1, we ensured that all interviews complied with the to further publicize the exercise locally. Before
ethical standards required for human research, the enumerators commenced the exercise, they
following the code developed by the British were trained in the required methodologies. We
Psychological Society (BPS, 2014), as implemented estimated that each village in the Delta has about
by the RSPB Human Ethics Committee. Detailed 350-400 households. We attempted to sample 3 -
methods for estimating the quantity of each 4 % of the households in each village equivalent to
service in the current and future scenarios are about 15 respondents per village.
presented in Chapter 4.
We used the main path, track or road in each village
Methodology for conducting socio-economic as a sampling transect to standardize participant
survey selection. Each enumerator then estimated the
A socio-economic survey using a detailed number of households along the transect and
questionnaire (Appendix 1) developed from divided that number by 15 (sample size) to select
templates in Peh et al., (2013) was the primary participants.
5Box 1: Ethical considerations while conducting interviews
Before any interview commenced, the enumerator explained to potential respondents that the
survey was part of Tana Delta Ecosystem Service Assessment whose results were intended to
inform the sustainable management of Tana Delta for the benefit of all the Delta’s stakeholders.
They were also informed of the type of data that was being sought concerning general socio-
economics, water provisioning and flooding regulation, and the quantity of wild and cultivated
goods harvested from the Delta. Potential respondents were informed that the interview could
take a maximum of 2 hours and that participation was completely voluntary. Respondents were
free to decline to participate, without consequence, at any time prior to or during the activity.
They were assured that any information provided was to be kept confidential, used only for the
purposes of completing the assessment, and was not be used in any way that could identify them.
Respondents were also informed that the results of the interview would be used exclusively by
the project partners and may be published in project reports and/or a scientific paper accessible
to the public. They were made aware that there were no risks involved in participating in the
interview, beyond those risks experienced in everyday life. The interview only commenced when
the respondent gave verbal consent. To ensure individual privacy and confidentiality, we did not
require the respondent’s names or contacts. After the interview there was a debriefing session
during which the resident’s participation was acknowledged and they were given the opportunity
to ask any question(s) in relation to the interview and the work of the participating institutions.
The respondent was also provided with the contact of the Nature Kenya office in case of the need
to follow up on the results.
This procedure was approved by the RSPB Human Ethics Committee.
Units of area/extent and financials gas emissions etc.) to aid comparisons, and the
sensitivity of estimates of values across service
Area/extent types to international markets for carbon dioxide.
Areas are presented in both acres and hectares (ha). However, most values obtained during our
Hectares are the SI unit of measurement for area assessments were in Kenyan shillings, and so
and are used in GIS systems and in international values have also been reported in this currency. In
literature. However, the common local unit of area 2017, $1 = Ksh 102 (https://www.poundsterlinglive.
in Kenya is the acre, and this is used also, especially com/best-exchange-rates/us-dollar-to-kenyan-
where quoting responses from residents. 1 acre = shilling-exchange-rate-on-2017-11-01).
0.405 hectares.
Some values from literature used in comparisons
Financial were in other currencies (e.g. euro (€)) and dated
The commonest unit of international finance significantly before 2017. These were converted to
is the US dollar ($) and this has been used for US dollars at the 2017 rate using information from
comparing values of commodities and services XE.com and US Bureau of Labor Statistics (2015)
across service types (food produced, greenhouse respectively.
62. PARTICIPATORY SCOPING OF ECOSYSTEM SERVICES
PROVIDED BY TANA COMMUNITY CONSERVED AREAS
2.1 Introduction impact score. We then calculated mean impact
This participatory scoping exercise was conducted score for the four groups.
as a precursor to a more detailed assessment.
2. Participatory formulation of alternative
The objectives were to: (plausible future states) for Tana Delta
1. Create awareness of the ecosystem service The stakeholders then discussed the threats
values of the Tana Delta ecosystem among identified in step 1 and considered the following:
stakeholders. i. The possibility of conservation and
2. Identify threats to the sustainability of management interventions being
ecosystem service delivery. implemented by various stakeholders in the
3. Evaluate the impact of current drivers of delta to counter threats identified in step 1,
change on ecosystem service provision within ii. The possibility of implementation of the Tana
the Delta. River Delta Land Use Plan (LUP) (Odhengo et
4. Recommend the ecosystem services to be al., 2014a)
measured in a full assessment. iii. The reality of continuing over-abstraction of
5. Determine the current (2017) land cover types water upstream due to numerous demands
and land uses. particularly for urban water supply, irrigation
and for hydroelectric power generation.
2.2 Methods
On 14th July 2017, the Toolkit for Ecosystem After deliberation, these two plausible future
Service Site-based Assessment (TESSA)(v1.2) Peh scenarios were agreed upon:
et al., (2013) was used to conduct a participatory • Scenario 1: A future in which Tana River
ecosystem service appraisal for Tana Delta. A total environmental flows are maintained thus
of 43 participants representing diverse interest maintaining appropriate water levels, the Land
groups were involved (see Appendix 2 for the list Use Plan (LUP) is implemented and an ICCA is
of participants). The participants worked in four established and is operational.
groups each facilitated by Nature Kenya staff. The • Scenario 2: A future in which although LUP is
purpose of this exercise was to: implemented, the Delta is deprived of water
1. Identify the current drivers of change and due to continued over-abstraction of water
their impact. upstream.
2. Formulate plausible future states (Scenarios)
based on the current threats. 3. Comparing ecosystem services provided by
3. Compare ecosystem services provided by the the current and alternative states
Delta in current and alternative future states. Each of the four groups was provided with a list of
potential ecosystem services that local residents
1. Identifying current drivers of change and their and other stakeholders derive from the Delta.
impact They were requested to add any other that was not
Each of the four groups was provided with a list of in the list. Each group deliberated on the list and
possible drivers/threats of change relevant to the scored the importance of each ecosystem service
site. The group added any other driver of change/ at the current and each plausible future scenario.
threat that was not in the list provided. Group Scores ranged from 0 (very low importance) to
members discussed each threat and agreed on a 5 (very high). Based on the scores from the four
score for timing, scope and impact of each of the groups of stakeholders, we calculated the mean
drivers/threats on the Delta. The scores were as score of each of the ecosystem services identified.
follows:
Timing 1= Likely in long-term (beyond 10 years)
2= likely in the short term
3= Happening now
Scope 0= Little of area (90%)
Impact 1= Low (1-9%)
2= Moderate (10-30%)
3= High (>30%)
For each driver of change, the timing, scope and Stakeholders discussing the ecosystem services
impact scores were summed up to give a total supplied by Tana Delta. PHOTO: GEORGE ODERA
72.3 Results Human wildlife conflicts: Wild animals, particularly
various primate species and also buffaloes, wild
2.3.1 Outcome of the Stakeholder Workshop pigs and elephants destroy crops thus reducing
the food security of the local residents. Animals
2.3.1.1 Current drivers of change in Tana Delta and like hippos, elephants and snakes are a danger to
their impacts local communities due to their potential to injure
According to stakeholders, the most important or to cause loss of human life.
drivers of change operating in Tana Delta include
climate change and severe weather, livestock Agriculture: Conversion of natural habitats to
grazing, water management issues including river agricultural fields by small scale farmers and some
diversion and dam construction, invasive alien large-scale commercial interests like TARDA rice
species, logging/wood harvesting, human wildlife farming enterprise poses the greatest threat to
conflicts, agriculture and aquaculture, fishing, Tana River Delta ecosystems.
conservation actions, hunting and trapping,
energy production and mining, and pollution Conservation actions and tourism: These
(Table 1). Others included the Lamu Port South are positive developments that contribute to
Sudan Ethiopia Transport Corridor (LAPSSET), sustainable use of some of the Delta’s ecosystem
residential and commercial development, fire, services. The County Governments of Tana
sand harvesting, gathering terrestrial plants and River and Lamu, many governmental and non-
tourism. Below we elaborate on some of the drivers governmental conservation organizations, and
as per the stakeholder’s perceptions. local communities have worked together to
produce a Land Use Plan (LUP) for the sustainable
Climate change and severe weather: Stakeholders use of the Delta. In addition, conservation
mentioned that the site has experienced impacts organizations operating in the area have also
of climate change including prolonged droughts been implementing activities that can contribute
and severe flooding. In addition, they noted that to the Delta’s conservation. Although tourism
the sea seems to be invading the land. development has lately been impacted negatively
by insecurity, it has the potential to improve the
Livestock grazing: Tana Delta is an open access welfare of local communities through provision of
resource that serves as a dry season grazing area jobs and markets for local goods.
for pastoralists from as far as northern Kenya and
even from Somalia. Lack of grazing regulation has
over the years resulted in overgrazing and conflicts 2.3.2 Ecosystem Services Provided by Mount
with agricultural communities. Kenya
According to stakeholders, the most important
Water management issues including river ecosystem services in the current state include
diversion: The ecology of the River Tana ecosystem firewood/charcoal provision, global climate
is dependent on continuous flow of water and regulation, cultivated food supply (including
regular flooding. However, over abstraction of crop farming and livestock rearing), soil erosion
water upstream coupled with change of river control, timber provision, coastal protection,
course downstream due to human interference or natural medicines supply, and spiritual/religious
natural processes has led to the river changing its services (Table 2). Stakeholders were of the
course many times. This denies some stakeholders opinion that in future Scenario 1 (where the Delta
the services associated with the river. will receive enough water, the Tana Delta Land
Use Plan is implemented and a functional ICCA
Invasive alien species: Invasive alien species will be in place), the value of most these services
particularly Prosopis juliflora locally referred to will increase. Additionally, the stakeholders
as ‘Mathenge’ poses a major challenge in parts of thought that the importance of harvested goods
Tana River Delta. (including fish, and water provision), local climate
regulation, water quality improvement, regulation
Logging/wood harvesting: This is a problem in of pests and vector borne diseases, recreation and
the forest patches along River Tana and also in aesthetics will also increase (Table 2 and Figure
the mangrove forest. This reduces the ecosystem’s 3). Stakeholders were in agreement that failure
climate regulation potential and destroys habitat to maintain water flows (i.e. Scenario 2) in the
for many globally threatened species. Delta will have a catastrophic impact on most of
the ecosystem services even if the Land Use Plan
is implemented.
8Table 1. Major threats to ecosystem health of Tana Delta, according to stakeholders. Impact
scores are derived from a combination of their estimated timing, scope and severity
(Peh et al., 2013)
Table 2. Stakeholder perceptions on the importance of various ecosystem services
9Fig 3. Stakeholder perception on changes in ecosystem service provision in the
current and future scenarios
2.4 Recommendations from Scoping 3. Water services particularly water provision for
Exercise livestock, domestic use and for irrigation
4. Cultivated goods
Based on stakeholder’s perceptions, it was a. crops - including rice, subsistence crops
recommended that a detailed ecosystem service e.g. maize, beans, cowpeas, and green
assessment, based on the current and two future grams
scenarios outlined above, be conducted following b. livestock
the methods outlined by Peh et al., 2013. The 5. Coastal protection
assessment should concentrate on:
1. Global climate regulation However, TESSA v1.2 does not contain methods for
2. Harvested wild goods – focusing on fish, the assessment of coastal protection services. This
fuel wood/charcoal, medicinal herbs, and service was therefore not assessed.
construction material.
103. SOCIO ECONOMIC CONTEXT OF THE ICCA
DEPENDENT LOCAL COMMUNITY
3.1 Introduction was 47 (±0.65) years. About 44% of the respondents
Wetland ecosystem services are linked to the were within 35-50 age group which represented
livelihood strategies of the dependent human the largest number of the respondents. The lowest
communities. The strategies adopted by the represented age group was 65-80 which was 6%
different wetland users in turn influences the (Figure 4).
ecological character of the wetland. High poverty
levels in wetland dependent communities usually
results in unsustainable exploitation of natural
resources. It is therefore important to understand
the socio-economic circumstances of the residents
of a proposed ICCA to inform decisions about
future usage of ecosystem services.
3.2 Methods
A socio-economic survey was conducted to gather
data on household characteristics, income and
other general aspects (See Appendix 1 for details).
This involved interviewing household heads
or their representatives from 408 households
distributed across 28 villages from the ICCA as
explained in section 1.2.2. Fig 4. Age distribution of Household heads in
Tana ICCA
3.3 Results
Household Demographics
Most households (82%) were male headed with The highest level of education in 41% of the
18% headed by women. The household heads households was primary school, 19% had
were 91% married, 5% were headed by widows, 1% secondary level education and 4% has tertiary level
separated. The main religion practiced within the education. It was noted that 34% of respondents
Delta communities is Islam (75%) with Christianity had no formal education.
accounting for 25%. Close to half (47%) of household
heads were farmers while 25% were pastoralists. Income and Expenditure
Trade and fishing were the main occupations About a quarter of respondents had a monthly
for 10% and 8% of residents, respectively. Other income of between KSh 2,500-5,000 while 22%
household heads were involved in formal earned less than KSh 2,500 per month and 13%
employment and mixed farming (Table 3). earned KSh 7,500- 10,000 (Figure 5).
The mean household size was 7.02 (range: 2-26)
individuals. The average age of household heads
Table 3. Main livelihood activities of the Household heads
11Table 4. Ranks of various expenses by residents
according to residents of Tana Delta ICCA
Fig 5. Monthly income of residents of Tana
Delta ICCA
Income was pooled from a diverse range of
activities (Figure 6). About 37% and 34% of the Sources of Energy
respondents derived their income from livestock Four main sources of cooking energy were
sale and farm produce sale, respectively. These two identified at household level within the Delta.
accounted for the highest percentage of income Firewood accounted for 74%, charcoal 28%,
source. Other income sources included 20% from kerosene 3% and gas 0.2%. Majority of the villages
milk sale, 17% from family remittances and 11% from still do not have electricity connection. An average
fish sales. However, 84% of respondents indicated household uses a sack of charcoal per month and
that income was not enough to meet their basic a bundle of firewood every 10 days. The average
household needs. Some 81% reported that income household spends KSh 310 and KSh 265 for the
levels had decreased over the past five years while purchase of charcoal and firewood respectively
18% said there was no change. each week.
Energy for lighting was varied; electricity, kerosene
lamps, rechargeable lamps, solar and other
sources. Kerosene accounted for 42% of lighting
energy followed by solar 44%. 11% of households
were connected to the national electricity grid.
Food Security
Fifty two percent (52%) of households stated they
have at least three meals a day, with 43% having at
least two meals a day. Rice, maize meal/ugali and
milk were the most dominant staple foods (Table
5). Other foods mentioned include beans, fish,
and bananas. The main sources of animal proteins
Fig 6. Sources of income for Tana River ICCA for the residents include fish, beef, mutton, goat
residents meat, chicken and milk. A typical homestead
consumed around 2.7 kg of animal protein per
To make up for the deficit in income, 49% of week, comprising of 2.1 kg of fish, 0.1 kg of chicken,
the households relied on relief support from and 0.7 kg of beef, mutton or goat meat.
governments and aid agencies mainly as food
supplies. 65% indicated they relied on natural
resources to meet their deficit, mainly through Table 5. Staple foods for households in the
hunting or fishing. Table 4 shows that respondents Tana ICCA
prioritize food in their expenses. Other priority
expenditure items include clothing, school fees
and medical expenses.
Structures and Utilities
Most households had only one housing structure
in their compound. For those that had more than
one structure, this was usually a kitchen and store
detached from the main household structure.
For the main house, 43% had iron sheet roofing,
while 56% had palm leaves or were grass thatched
implying the high reliance on natural resources.
95% of the houses have earth walls and floor.
124. DETAILED ASSESSMENT
4.1 Description of Alternative States to households participating in the livelihood
Adopted for Detailed Assessment questionnaire and multiplied this by the number
The ‘alternative states’ (as defined in Peh et al., 2013) of households calculated for the ICCA area (based
used for comparison with the current situation on the 2009 national census and a 2.8% annual
in the proposed Tana Delta ICCA were chosen to population growth rate). This area (12,291 ha) was
represent two alternative futures for the area in subtracted from the mapped areas of grassland
the year 2050, to align with the future alternative and scrub in an area of 5 km from all known
land-use possibilities outlined in the Tana River villages within the ICCA, in proportion to the
SEA (Odhengo et al., 2014a). We chose the future occurrence of those habitats in the ICCA area.
Industrial Development Scenario B, to represent This area was increased for the 2050 scenarios
a future in which continued industrial agriculture using the projected population increase within
is allowed to displace small-scale agriculture the ICCA over the period 2017-2050, based on a 3%
and grazing, with no regard for finite resources population growth per annum, to 15,517 ha, again
(grazing, water, etc.) and water abstraction from proportionally replacing grassland and scrub.
the River Tana is not controlled. As an alternative, Water, sand and salt areas were assumed to remain
the Hybrid Scenario, C, was chosen to represent the unchanged. In scenario B(sugar) the area of sugar
best likely outcome for the lower delta, with limits plantation (9,980 ha) replaces mapped habitats
on industrialisation, water flow and abstraction, in the central ICCA, and in both B scenarios, the
and implementation of the LUP (Odhengo et al., TARDA rice irrigation scheme is assumed to
2014b): resume production and to replace the current
scrub and grassland habitats as they are mapped.
Scenario B sets out a range of potential Other habitats were reduced pro rata to make up
commercial development options for the Plan the full ICCA area. Scenario C assumed the TARDA
area. No assumptions have been made as to scheme is replaced proportionately by wetland
whether they are compatible with each other, or farming co-operatives around villages, and no
with other objectives of the Land Use Plan, wise sugar is planted. Scrub and grassland habitats are
use of resources or environmental sustainability. increased pro rata to make up the full area. These
Two possible variants of this scenario are used: ‘B areal changes are aligned as much as possible with
Sugar’ (Bs), in which significant areas of grassland the scenarios, areas and spatial extent outlined in
and scrub are given over to sugarcane cultivation, the LUP and SEA (Odhengo et al., 2014a, Odhengo
as well as an increase in the area of other arable et al., 2014b). The land use/land cover in 2017, and
farming, but livestock numbers are limited by the in the three future scenarios, is presented in Table
loss of grazing: and ‘B No Sugar’ (Bns), in which 6.
small scale arable farming increases, but the
livestock herd increases also.
Scenario C is a so-called ‘Hybrid’ scenario,
developed as part of the SEA/LUP process
(Odhengo et al., 2014a, Odhengo et al., 2014b), to
draw together those activities and elements which
are most likely to offer a long term sustainable
future for the Tana Delta. These include limiting
numbers of livestock, retaining semi-natural
habitat corridors to allow wildlife migration, and
conserving existing forest areas.
4.2 Determining Land-use/land-cover
Areas and Livestock Numbers in the
Tana Delta ICCA over the Period 2017- Livestock grazing at the Tana River Delta. PHOTO:
2050 under Three Different Development BIRDLIFE INTERNATIONAL
Scenarios
We have calculated land-use/land-cover areas for Mean per-household livestock numbers were
2017 based upon satellite imagery and ground derived from reported numbers of animals for
truthing. This has provided areas of different 279 of the 408 households participating in the
habitats and land-covers in the ICCA of the lower questionnaire survey. These were multiplied up
delta, with the important exception of subsistence by the projected number of households, based
farming. Small scale village cultivation areas were on the 2017 estimated population and the mean
found to be indistinguishable from scrub and household size of 7.02 reported in the questionnaire
grassland areas, due to the ephemeral nature of survey. Livestock numbers in 2050 were based on
cultivations and fallows typical of subsistence a proportional extrapolation of animals numbers
agriculture. To approximate the area under this as per the LUP/SEA for each scenario (Odhengo et
land-use, an important local economic activity, al., 2014a, Odhengo et al., 2014; Table 7).
we used the mean reported area of land available
13You can also read