Man Down Situation Detection Using an in-Ear Inertial Platform
←
→
Page content transcription
If your browser does not render page correctly, please read the page content below
sensors
Article
Man Down Situation Detection Using an in-Ear
Inertial Platform
Alex Guilbeault-Sauvé                  , Bruno De Kelper and Jérémie Voix *

                                          Université du Québec, École de technologie supérieure (ÉTS), Montréal, QC H3C 1K3, Canada;
                                          alex.guilbeault-sauve.1@ens.etsmtl.ca (A.G.-S.); bruno.dekelper@etsmtl.ca (B.D.K.)
                                          * Correspondence: jeremie.voix@etsmtl.ca; Tel.: +1-514-396-8437

                                          Abstract: Man down situations (MDS) are a health or life threatening situations occurring largely in
                                          high-risk industrial workplaces. MDS automatic detection is crucial for workers safety especially
                                          in isolated working conditions where workers could be unable to call for help on their own, either
                                          due to loss of consciousness or an incapacitating injury. These solution must be reliable, robust, easy
                                          to use, but also have a low false-alarm rate, short response time and good ergonomics. This project
                                          aims to improve this technology by providing a global MDS definition according to a combination of
                                          three observable critical states based on characterization of body movement and orientation data
                                          from inertial measurements (accelerometer and gyroscope): the worker falls (F), worker immobility
                                          (I), the worker is down on the ground (D). The MDS detection strategy was established based on the
                                          detection of at least two distinct states, such as F-I, F-D or I-D, over a certain period of time. This
                                          strategy was tested using a large public database, revealing a significant reduction of the false alarms
                                          rate to 1.1%, reaching up to 99% accuracy. The proposed detection strategy was also incorporated
                                          into a digital earpiece, designed to address hearing protection issues, and validated according to an
                                in vivo test procedure based on simulations of industrial workers normal activities and critical states.


Citation: Guilbeault-Sauvé, A.;           Keywords: man down; fall detection; worker safety; monitoring; inertial platform; wearable sensors
De Kelper, B.; Voix, J. Man Down
Situation Detection Using an in-Ear
Inertial Platform. Sensors 2021, 21,
1730. https://doi.org/10.3390/            1. Introduction
s21051730
                                                Certain areas of industrial workplaces, like mining, forestry, construction and fire-
                                          fighting, are known as precarious and dangerous, involving numerous physical and me-
Academic Editor: Marco Iosa
                                          chanical hazards as well as lone-work situations, where accidents and morbidity are more
                                          frequent. Labour laws require employers and industries to ensure employee protection by
Received: 18 January 2021
Accepted: 23 February 2021
                                          adopting preventive measures, appropriate safety equipment and occupational health and
Published: 3 March 2021
                                          safety training. However, any given workplace will never be totally safe from accidents
                                          especially for a lone worker and high-risk workers. In this context, portable devices alerting
Publisher’s Note: MDPI stays neutral
                                          a control center when an emergency is detected should be worn with main advantage to
with regard to jurisdictional claims in
                                          call help when worker is unable to do it on his own, either due to loss of consciousness or
published maps and institutional affil-   an incapacitating injury. These systems are therefore essential in ensuring occupational
iations.                                  health and safety in the workplace, and their reliability is just as critical. Solutions must
                                          also meet industry requirements in terms of reliability, robustness and ease of use, as well
                                          as featuring low false-alarm rate, short response time and good ergonomics. Poor designs
                                          could result in additional costs for employers, loss of confidence in the technology and
Copyright: © 2021 by the authors.
                                          lesser deployment of this technology in the industry.
Licensee MDPI, Basel, Switzerland.
                                                According to the IRSST, falls from heights, from same level or from slips constitute
This article is an open access article
                                          the greatest causes of occupational injuries, responsible for more than 21% during 2010–
distributed under the terms and           2012 [1]. Compensation paid for victims of injuries in case of falls from heights are
conditions of the Creative Commons        larger than the average and constitute a significant risk of decreased productivity and
Attribution (CC BY) license (https://     quality of life [2]. Many existing devices are designed to detect only falls, according to the
creativecommons.org/licenses/by/          327 studies conducted up to 2013 [3], and available solutions has aimed towards the elderly-
4.0/).                                    care market since the elderly are vulnerable and most prone to fall. Several solutions use

Sensors 2021, 21, 1730. https://doi.org/10.3390/s21051730                                                  https://www.mdpi.com/journal/sensors
Sensors 2021, 21, 1730                                                                                             2 of 15

                         subject post-fall disability state, mostly characterized by immobility or down position state,
                         to limit detection errors whenever the device fails to detect a fall occurrence, making it
                         a very important aspect that should be included in a robust fall detection solution [3].
                         Moreover, the post-fall disability state duration is a direct factor of fall severity, weakness
                         of the victims and mortality rate [3,4].
                              The NSERC-EERS Industrial Research Chair in In-Ear Technologies (CRITIAS), who
                         has developed a unique technology designed to protect industrial workers from noise-
                         induced hearing loss, kickoffs this project to integrate a man down situations (MDS)
                         detection solution into a digital earpiece prototype by incorporating an inertial platform
                         and addressing both issues with a single and simple solution. While some consumer MDS
                         detection devices have recently been developed for elders using hearing-aid devices [5],
                         there has been very few scientific studies on MDS detection usage in workplace. Moreover,
                         MDS definition is not consistent through studies, distinguishing types of emergencies
                         such as falls, dangerous substance exposure, health problems (stroke, incidents, heart
                         attacks) or loss of consciousness [6], which some lead to more complex solutions, as vital
                         signs monitoring (respiration, heart rate and galvanic skin response sensors) and several
                         environmental hazards detection (gas, chemicals, noise).
                              Without state-of-the-art scientific definition of man down situations, this project seeks
                         a global and simple detection solution based on characterization of motion and orientation
                         tracking using an in-ear inertial platform, for all emergencies faced by workers, where
                         nature and causes of danger are innumerable, diverse and hard to predict considering all
                         variables like workplace, work tasks, workers health, physiognomy, etc. The detection
                         strategy and digital earpiece solution implementation will be validated using test scenarios
                         inspired by typical activities performed by targeted workers.

                         2. Materials and Methods
                         2.1. Motion and Orientation Tracking
                               The motion and orientation tracking methodology is based on an inertial measure-
                         ment unit (IMU), which has a 3-axis accelerometer, for linear acceleration measurements
                         a = [ a x ay az ]T , and a 3-axis gyroscope, for rotational speed measurements ω = [ωx ωy ωz ]T .
                         Inertial sensors are affected by numerous measurement errors such as constant error
                         sources due to cross axial coupling, scaling factors, orthogonal axis misalignment and
                         measurement biases [7], and continuous errors that evolve over time due to random noise
                         processes, including numerical quantification, random gyroscope angle walking, contin-
                         uous random walk, bias stability, and continuous measurement drift [8]. Constant error
                         sources are handled with unique static calibration while continuous errors are compensated
                         with dynamic calibration over time. The iterative least-squares method proposed by [9]
                         was used for acceleration measurement calibration since it does not require any external
                         equipment and based on a large acceleration data set of multiple sensor positions. Since the
                         direction and magnitude of the Earth’s gravity is known and constant, the compensation
                         coefficients of the accelerometer model can be determined to correct acceleration vector
                         norm that should ideally represent a unitary sphere centered at the origin. The rotational
                         speed instantaneous bias is corrected firstly by subtracting the average rotational speed
                         offset while the gyroscope is stationary (ω = 0). Then, correction of rotational speed bias
                         drift is proceed by integrating the gyroscope’s rotational errors with respect to the product
                         of both inertial sensor measurements and their fusion [10]. The optimized gradient method
                         from [10] is used to find an optimal orientation estimation, given in quaternion represen-
                         tation, which is a mathematical entity q = [q1 q2 q3 q4 ]T simplifying rotation calculation in
                         space and avoiding the singularity problems of trigonometric functions [11,12].

                         2.2. SisFall Database
                              The large public database SisFall includes 4510 inertial data records of various scenar-
                         ios of activities of daily living (ADL) and falls [13]. The test measurements were captured
                         using an inertial platform, two accelerometers and a MEMS-type gyroscope, placed on the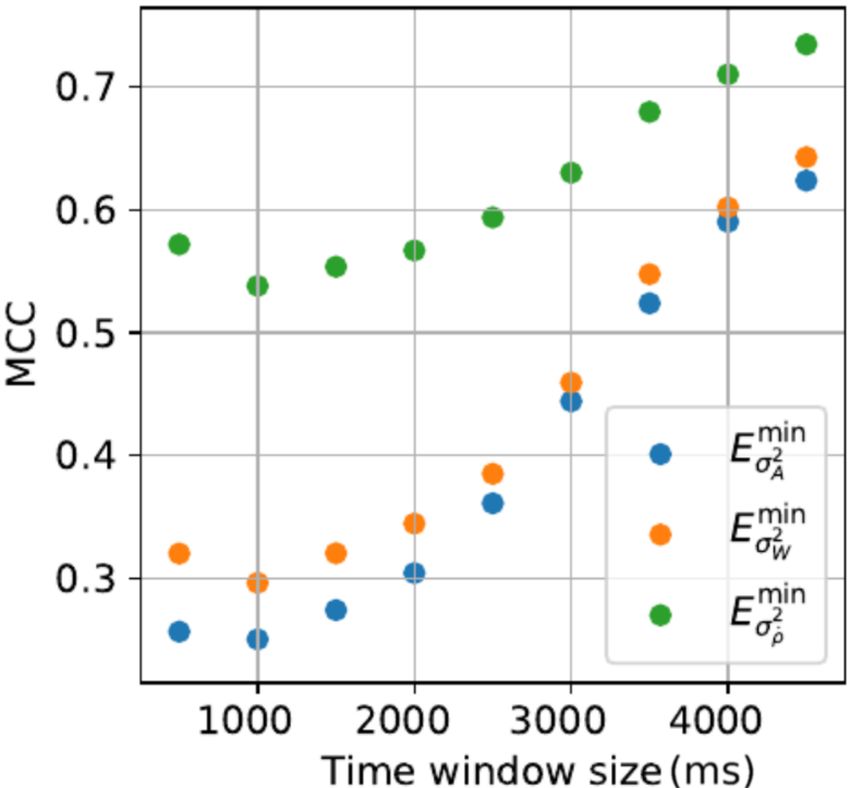
Sensors 2021, 21, 1730                                                                                           3 of 15

                         waist belt of participants. Only data from the Freescale MMA8451Q 3-axis accelerometer
                         (14 bits, ±8 g) and the InvenSense ITG-3200 3-axis gyroscope (16 bits, ±2000◦ /s), with a
                         200 Hz sampling rate, are used in this work.
                              Since the database was specifically intended to classify fall events, body movements
                         making up the MDS are not all represented, however it is an excellent data source to
                         characterize rigorously the critical states and MDS, at the heart of the detection strategy.

                         2.3. Features Characterization
                               The IMU provides raw orientation and displacement data from which are extracted
                         the specific movement features that are relevant to MDS detection. The main difficulty is to
                         discriminate movement features relevant to MDS from natural movement features coming
                         from a wide variety of work environment activities, such as discriminating a critical fall
                         from bending over to pick up an object on the ground, etc. In most cases, the extreme
                         nature of the movements at play in a MDS is the most revealing feature as compared to
                         the movements in play in normal work activities. Hence, the extrema extracted from the
                         signals provided by the IMU have been chosen as the main feature for MDS detection.
                               Inertial data are processed in order to extract relevant physical signals for critical
                         states detection, such as the acceleration norm A(t), the rotational speed norm W (t), the
                         tilt angle ρ and its derivative ρ̇(t).
                                                                              q
                                                   A(t) = || a(t)|| =             a2x (t) + a2y (t) + a2z (t)       (1)
                                                                              q
                                                 W (t) = ||ω (t)|| =              ωx2 (t) + ωy2 (t) + ωz2 (t)       (2)

                                                                    g·v

                                               ρ = arccos                         = arccos ( g · v), v = q∗ gq      (3)
                                                                || g||||v||

                                                                    ρ̇(t) = dρ(t)/dt                                (4)
                              The tilt angle ρ is obtained by calculating the angle between the orientation vector v,
                         from the orientation estimation as a quaternion q, and the vertical axis represented by the
                         gravity vector g. The characterization of the feature signals is based on their extreme values
                         analysis establishes statistical models serving as a basic index of detection probability for
                         each critical state. The statistical models are built based on extreme values distribution
                         of the temporal maximum and minimum of the mean or variance of feature signals,
                         segmented according to different time windows, namely extreme value signals. Depending
                         on the nature of the critical states, specific sets of extreme value signals are analyzed on
                         occurrences of the critical states from the reference dataset.
                              The extreme values are then characterized according to two probability distribution
                         models. First, the normal distribution N (µ, σ2 ), describing random events of natural
                         phenomena, with a probability density function of a random variable X given by

                                                                          ( x − µ )2

                                                                 1
                                               pdfnorm ( X ) =  √   exp −              ,x ∈ R                       (5)
                                                               σ 2π           2σ2

                         where µ is namely the mean and σ the standard deviation.
                               Then, the Gumbel distribution G(u, β), also known as the generalized extreme value
                         distribution of type I (k = 1), commonly used to predict rare events or extreme values of
                         normal-type or exponential initial distribution data [14]. The probability density function
                         is given by

                                                                      ( x −u)       ( x −u)
                                           pdfgumbel ( X ) = β1 exp − β exp − β                ,x ∈ R             (6)

                         where u is namely the distribution locality and β the scale, estimated by resolving the
                         equation system based on maximum likelihood method [15] with β > 0.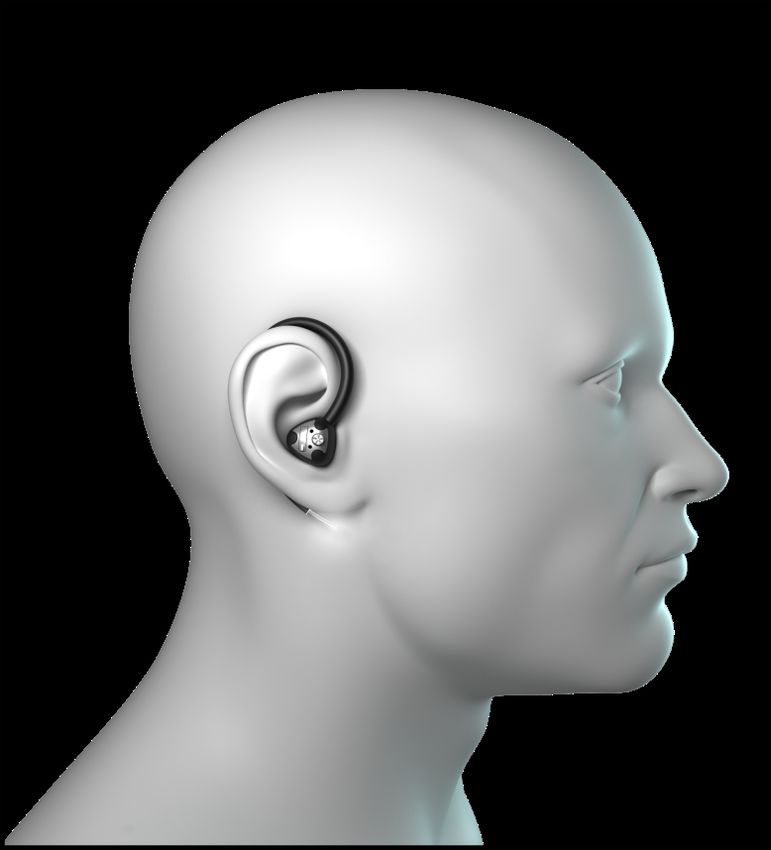
Sensors 2021, 21, 1730                                                                                             4 of 15

                                In practice, Gumbel and normal distributions may have similar appearance, therefore,
                         it is possible to discriminate between the two distributions by using the Ratio of Maximized
                         Likelihood (RML) as test statistic. As such, the logarithm of the RML Function for the
                         normal distribution over the Likelihood Function of the Gumbel distribution with a value
                         greater than zero mandate the use of the normal distribution, and otherwise, the Gumbel
                         distribution [16].

                         2.4. Detection Theory
                               The present study focuses on binary statistical test, also binary classification theory,
                         which defines a mathematically formalized decision-making method based on known
                         statistical models in order to make a predictive decision using an independent data set.
                         The null hypothesis H0 defines the decision that the event did not occur and the alternative
                         hypothesis H1 as the decision that the event did occur. The probability rates of event
                         detection PD when the event actually occurred and the probability rate of a false alarm PFA ,
                         also known as the type I error, are defined by the following equations:

                                                                PD = Pr{ H1 | H1 }                                    (7)

                                                               PFA = Pr{ H1 | H0 }                                    (8)
                              The detection performance is calculated according to the number of positive and
                         negative results of detection as well as by their classification as “true positive” (TP),
                         “false positive” (FP), “true negative” (TN) and “false negative” (FP) as follows their true
                         classification. The accuracy indicates the detection behavior by evaluating the results of
                         true predictions without considering the classification of the tests.

                                                                           TP + TN
                                                              Accuracy =                                              (9)
                                                                            P+N
                              The Matthews correlation coefficient (MCC) is commonly used to evaluate the perfor-
                         mance of predictive models, especially in personalized medicine (genetic testing, molecular
                         analyzes, etc.), and represents a discretization of Pearson correlation for binary classification
                         of two distinct groups. The MCC given by

                                                                (TP)(TN) − (FP)(FN)
                                            MCC = p                                                                  (10)
                                                        (TP + FP)(TP + FN)(TN + FP)(TN + FN)
                         reflects better evaluation of detection performance over accuracy and is considered as a
                         robust and reliable statistical measure with the ability to truthfully bring out any prediction
                         deficiencies from dataset by providing a more complete and informative response [17]. In
                         this study, the MCC is used to determine optimal time window sizes and critical states
                         detection thresholds, instead of the area under the curve (AUC) of the receiver operating
                         characteristic (ROC) curve which have some drawbacks and need the complete analysis of
                         PD ∈ (0, 1) range.

                         2.5. Man Down Situation Definition
                              For the purpose of MDS detection, a global definition is proposed according to the
                         observation of three distinct critical states, namely the Immobility state (I), the Fall state
                         (F) and Down position state (D). The combination of these critical states describes most
                         of emergencies faced by workers in industrial workplaces. In this study, the fall state is
                         defined as the falling phase pre-impact, characterized by a free fall and a large variation
                         of the inclination of the body, and the fall-impact phase, which is characterized by a great
                         force resulting from the collision of the body with either the ground or another object.
                         The immobility state is defined as a low level of movement of the worker’s body during
                         a significant time period. Finally, the down position state is simply defined by the near
                         horizontal body’s angle.
Sensors 2021, 21, 1730                                                                                             5 of 15

                              The proposed hypothesis is that fusion of these three critical states enables a more ac-
                         curate and reliable MDS detection. More specifically by looking for multiple combinations
                         of concurrent critical states, named combinatorial state, describing each a particular set
                         of MDS:
                         •    F-I combinatorial state defines an emergency in which a person who has fallen remains
                              inert thereafter, regardless of his final position;
                         •    F-D combinatorial state defines an emergency in which a person who has fallen
                              remains lying down on the ground thereafter;
                         •    I-D combinatorial state defines an emergency in which a person is inert and lying
                              down on the ground;
                               The man down situations are represented as a function of critical state occurrences,
                         summed up in the set (F ∩ I) ∪ (F ∩ D) ∪ (I ∩ D). However, the F-I-D combinatorial state
                         is already implied in the combinatorial states sets and will not be referred to herein. The
                         I-D state may be counter-intuitive, but it is at the core of the project purpose to develop a
                         robust solution since it is focused on post-fall disability state and can detect some particular
                         cases where fall state has not been detected or situations where the worker goes down but
                         do not fall according to the definition above, for example the worker might feel unwell and
                         squat slowly before going to the ground.

                         2.6. Detection Algorithms
                               The extreme value signals from the inertial measurements processing constitute the
                         detection strategy variables in regards to the fall, immobility and down position states
                         characterization. The detection strategy consists of several processing and analysis stages
                         in order to train the algorithm and predict the critical states occurrence. The training
                         phase begins with the building of statistical distribution models of extreme values of
                         feature signals, segmented by their respective optimally-sized time windows. Then, the
                         optimal threshold for the detection of the critical states is based on the analysis of the
                         fusion of the detection probability provided by the feature signals statistical models. At
                         last, the F-I, F-D and I-D combinatorial states are obtained by applying a simple logic AND
                         function on pairs of detected critical states considering the signal segmentation as well
                         by optimal time window sizes. The prediction phase is the application of the detection
                         strategy on independent data, based on the previous critical states characterization. From
                         Equations (7) and (8), given an extreme value signal Es (t, τ ) of the feature signal s(t)
                         segmented according to a time window size τs , as well as a detection threshold γs , the
                         detection probability can be found by
                                                                                max
                                                                                 >
                                                          PD = Pr{ Es (t, τ )    6 γs | H1 }                        (11)
                                                                                min
                                                                                max
                                                          PFA =   Pr{ Es (t, τ ) <
                                                                                 > γs | H0 }                        (12)
                                                                                min
                         where the detection condition differs depending on the related extremum, the minima (min)
                         or maxima (max) of the extreme values signal. Each optimal threshold and time window
                         size values are determined by maximizing the MCC through the performance analysis.

                         2.6.1. Fall Detection
                              Considering the proposed fall state definition from Section 2.5, the fall detection is
                         based on the analysis of extreme value signals, as such, the mimima and maxima of the
                         mean of the acceleration norm A(t), the maxima of the mean of the rotational speed norm
                         W (t) and the maxima of the mean of the derivative of the tilt angle ρ̇(t). The extreme
                         values of these feature signals are analyzed and studied through the database fall scenarios,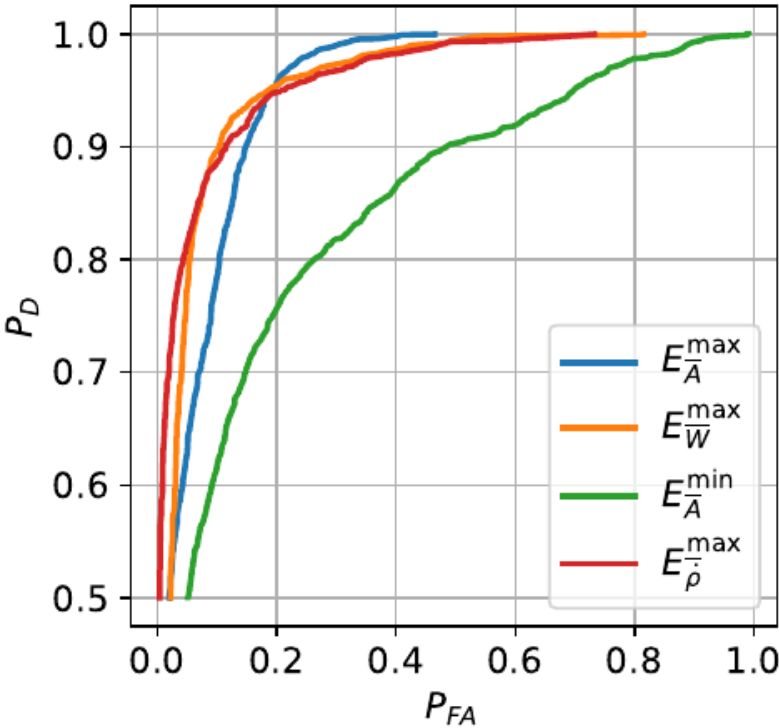
Sensors 2021, 21, 1730 6 of 15
applying time segmentation by specific time window sizes which differ according to the
transient nature of signals. Therefore, the fall detection features signals are given by
Emin (t, τAmin ) min ( A[t, t + τAmin ])
A
Emax (t, τ max ) max ( A[t, t + τ max ])
A A A
EF (t, τF ) = max max = (13)
max ])
EW (t, τW ) max (W [t, t + τW
Eρ̇max (t, τρ̇max ) max (ρ̇[t, t + τρ̇max ])
max τ max ]T are the time window sizes. Since the feature signals
where τF =[τAmin τAmax τW ρ̇
transients do not necessarily coincide in time, the fusion function is defined as the product
of the maximum detection probabilities from the individual extreme values analysis over a
common time segmentation, as
MF
max(pdfi ( EF,i [t, t + τF,L ]))
LF ( EF (t, τF ), τF,L ) = ∏ pdfi,max
(14)
i =1
where MF is the number of feature signals and τF,L is the time window size. In order to
standardize the weight of each detection probabilities in the fusion process, the probability
density function are normalized to a unit scale by respectively dividing by the maximum
probability value pdfi,max . The expression of the fall detection signal yF is defined as
0 if LF ( EF (t, τF ), τF,L ) ≤ γF
yF ( t ) = (15)
1 if LF ( EF (t, τF ), τF,L ) > γF
where γF is the fall detection threshold.
2.6.2. Immobility Detection
Considering the proposed immobility critical state definition from Section 2.5, the im-
mobility state detection is based on observation of minimal body movements by analyzing
the extreme value signals, as such, the minima of the variance of the acceleration norm
σA2 ( t ), the minima of the variance of the rotational speed norm σ2 ( t ) as well as the minima
W
of the variance of the derivative of the tilt angle σρ̇2 (t). The use of signals variance is more
suitable for low level activity detection, ensuring that detection properties persist over
time as these signals low amplitudes may drift over time and compromise the detection.
Therefore, the immobility detection features signals are given by
Eσmin min 2 [ t, t + τ min ])
2 ( t, τσ2 ) min (log10 σA σ2
minA A A
Eσ2 (t, τσmin 2 min
2 ) = min (log10 σW [ t, t + τσ2 ])
EI (t, τI ) =
W (16)
W W
Eσmin min
2 ( t, τσ2 ) min (log10 σρ̇2 [t, t + τσmin
2 ])
ρ̇ ρ̇ ρ̇
where τI =[τσmin
2 τσmin
2 τσmin T
2 ] are the time window sizes. Since the immobility state is constant
A W ρ̇
and non-transitory, the fusion function is defined as the product of the average detection
probabilities from the individual extreme values analysis over a common time segment, as
MI
mean(pdfi ( EI,i [t, t + τI,L ]))
LI ( EI (t, τI ), τI,L ) = ∏ pdfi,max
(17)
i =1
where MI is the number of feature signals and τI,L is the time window size of the feature
signals fusion. The same scaling operation from Equation (14) is apply to standardize each
probability weights. The expression of the immobility detection status signal is defined as
0 if LI ( EI (t, τI ), τI,L ) ≤ γI
yI ( t ) = (18)
1 if LI ( EI (t, τI ), τI,L ) > γI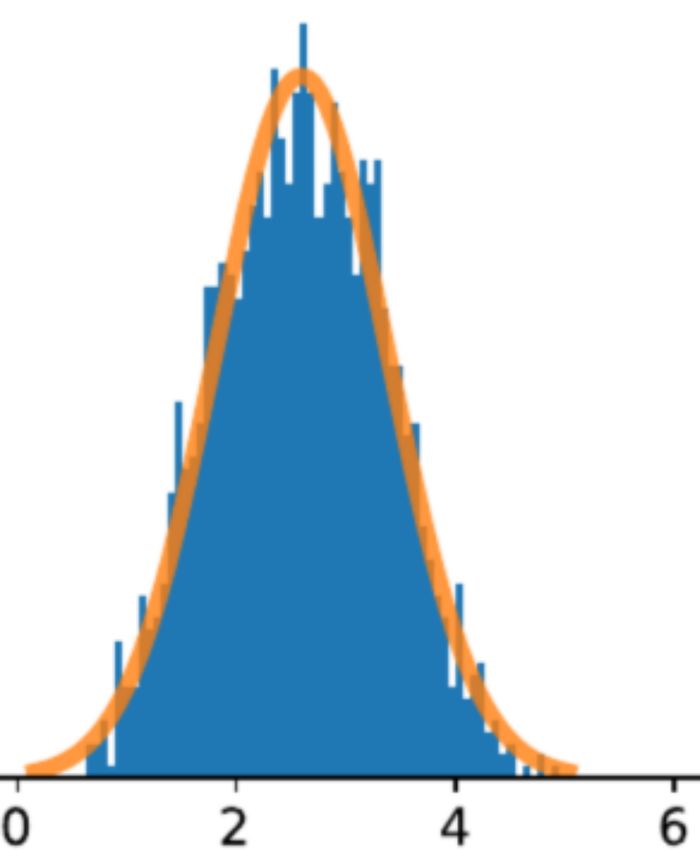
Sensors 2021, 21, 1730                                                                                             7 of 15

                         where γI is the immobility state detection threshold.

                         2.6.3. Down Detection
                              The body tilt angle variable is commonly used in fall detection algorithms to eliminate
                         most of false positive results, by monitoring the vertical (0◦ angle) to horizontal transition
                         of the body orientation, where the post-impact stage of fall event is defined by a critical tilt
                         angle value [18,19]. The measurement of the horizontal position angle is not bounded at
                         90◦ since the position of the device, the topography of the terrain and the way the body lay
                         down are some examples of factors where the angle value could be greater. Considering
                         that a MDS does not necessarily involve a fall, down position state is, as proposed, an
                         independent critical state. The down position state detection is based on the analysis of
                         extreme value signal, such as, the maximum of mean of the tilt angle ρ(t) over a specific
                         time segment. Therefore, the down detection feature signal are given by:
                                                          h                 i h                       i
                                             ED (t, τD ) = Eρmax (t, τρmax ) = max (ρ[t, t + τρmax ])              (19)

                         where τD = [τρmax ] is the time window size. The interpretation of Eρmax data can be altered
                         by several unknown factors such as ground level, infrastructures, etc. Thus, the down
                         position detection threshold is chosen by setting the type II error rate to 1% or PD = 0.99.
                         The function of down position state yD (t) is defined by
                                                                (
                                                                  0 if Eρmax (t, τρmax ) ≤ γD
                                                     yD ( t ) =                                                   (20)
                                                                  1 if Eρmax (t, τρmax ) > γD

                         where γD is the down position state detection threshold.

                         2.6.4. Man Down Detection
                              This study on man down situations solves the detection problem by generalizing
                         these emergencies according to the combination of independent critical states occurrences,
                         namely the combinatorial states. Indeed, based on the proposed global MDS definition in
                         Section 2.5, the detection strategy comes down to detect at least two different critical states
                         occurrences in a certain time frame to identify a MDS. The combinatorial states detection
                         is defined by the logical fusion of pairs of independent critical state detection, basically
                         a logical AND (∧) operation over ANY ( ) critical states occurrence over specific time
                                                                    W

                         segmentation, as

                                                                 {yF [t, t + τF-D ]} ∧       {yD [t, t + τF-D ]}
                                                            W                            W
                                               yF-D (t) =                                                           (21)

                                                                 {yF [t, t + τF-I ]} ∧       {yI [t, t + τF-I ]}
                                                             W                           W
                                                yF-I (t) =                                                          (22)
                                                                 {yI [t, t + τI-D ]} ∧       {yD [t, t + τI-D ]}
                                                             W                           W
                                               yI-D (t) =                                                           (23)
                         where τF-D , τF-I and τI-D are time windows of each combinatorial state. Thus, the MDS
                         prediction is defined as the inclusive disjunction of the combinatorial states, expressed as a
                         logical OR (∨) operation over the combinatorial states detection signals, as

                                                     yMDS (t) = yF-D (t) ∨ yF-I (t) ∨ yI-D (t).                     (24)

                              This algorithm ignores if F, I and D situations appear at the same time or after each
                         others, but rather assess if they appear in a time window specific to each combinational
                         state, and thus avoid to have to determine the beginning and the end of each critical state in
                         order to assess if the states do indeed follow each other. The actual sequence of events does
                         not provide such significant data for our algorithm, where only the presence of a critical
                         state is required for the combination assessment. Moreover, such approach simplifies the
                         algorithm as it avoids the characterization of the timing or interleaving of F-I and F-D.
Sensors 2021, 21, 1730                                                                                                          8 of 15

                                   2.7. Workers Physical Test Protocol
                                        In order to validate the MDS detection strategy and the solution implementation
                                   within the CRITIAS digital earpiece, a formalized physical test protocol is proposed. This
                                   also allows to test the developed detection algorithms using head movements, which
                                   differ from inertial measurements from IMU positioned at the waist as in SisFall database.
                                   Moreover, the scenarios created by state-of-the-art protocols used in fall detection studies
                                   are not suitable for workers typical activities. Thus, the proposed physical tests are designed
                                   to mimic some ADL and typical workers activities that highlight extreme cases and frequent
                                   false alarms situations as well as test scenarios involving the critical states F, I and D,
                                   executed in a controlled environment.
                                        The earpiece prototype used a STMicroelectronics LSM6DS3 IMU. The setup of the
                                   digital earpiece prototype is shown in Figure 1. A Bluetooth wireless module enables the
                                   IMU data transmission to a computer for post-processing purpose. The inertial data
                                   from the IMU was sampled at 100 Hz, which is half frequency used by the reference
                                   SisFall database.
                                        The proposed physical tests protocol, described in Table 1, includes tests that have
                                   already been used in protocols from other fall detection studies [20–22] and were also
                                   inspired from firefighter’s fitness assessment test [23]. The equipment used to perform the
                                   physical tests are: a chair, a flight of stairs, a mattress (≥0.75 m thick), a stick (1.5 m); a ball
                                   (0.30 m diameter, 10 kg); and a sled (20 kg).

                                                Table 1. Workers physical test protocol.

    #                        Description                   Chair         Stairs      Mattress         Stick       Ball       Sled
    1                    Take a Ground Object
    2                     Long Bend (1 time)
     3             Lean repeatedly (5 times)
     4               Lie down on the back
     5         Lie on the floor on your stomach
     6        Lie on the ground on the right side
     7         Lie on the ground on the left side
     8                   Sit on a chair
     9                         Stay
    10                    Fall forward
    11                   Fall backward
    12                    Walk (20 m)
    13                       Run (20 m)
    14              Alternate walk-run (40 m)
    15                     Cough
    16            Up, down stairs (10 steps)
    17                Jump on the spot
    18           Jump from the top of a chair
    19        Jump a length without momentum
    20          Jump a length with momentum
    21                        Roll
    22                  Ground Crawl
    23             Roll a ball while moving
    24                  Roll a ball back
    25              Push a sled to weight
    26             Hammer with two hands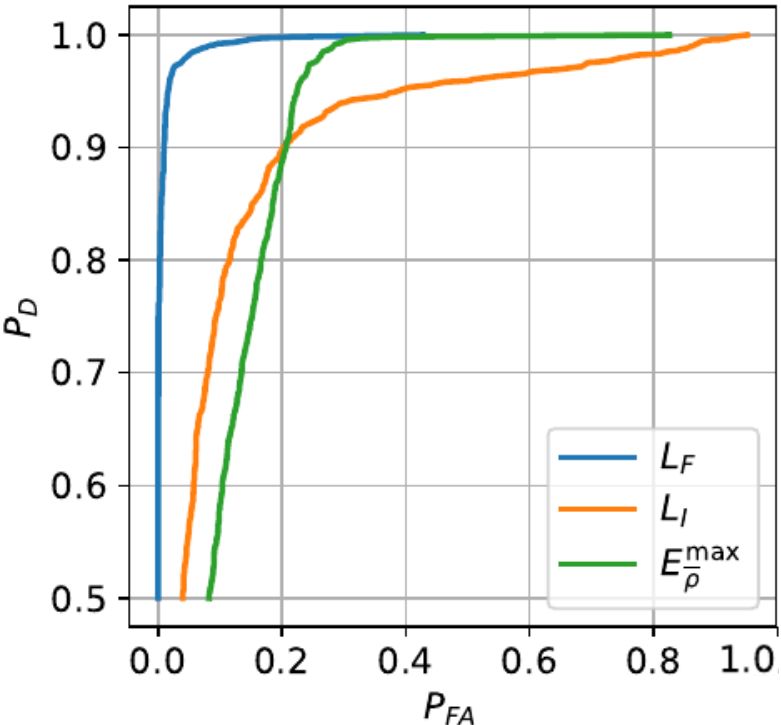
Sensors 2021, 21, 1730                                                                                                         9 of 15

                         Figure 1. Digital earpiece prototype.

                         3. Results
                         3.1. SisFall-Models and Validation
                              The fall scenarios from the SisFall database is primary used to characterize the dis-
                         tributions of each extreme values signals use for each critical states detection algorithms
                         presented in previous section. Figure 2 presents the distributions and the estimated statisti-
                         cal models obtained by the optimization of MCC, see Equation (10), through time windows
                         size parametrization analysis, while the different models parameters and optimal time
                         windows sizes are given in Table 2.

                         (a) Emin (t, τ min )     (b) Emax (t, τ max )        (c) Emax (t, τ max )   (d) Eρ̇max (t, τρ̇max )
                              A        A               A         A                 W        W

                         (e) Eσmin      min
                                2 ( t, τσ2 )     (f) Eσmin      min
                                                        2 ( t, τσ2 )          (g) Eσmin      min
                                                                                     2 ( t, τσ2 )    (h) Eρmax (t, τρmax )
                               A        A              W         W                  ρ̇       ρ̇

                         Figure 2. Distributions of extreme values signals.

                              The detection algorithms performance and the parametric analysis from the training
                         phase are presented in Figures 3–5. Table 3 shows the performance results of critical
                         states, combinatorial states and MDS detection on independent tests using a 10-fold cross
                         validation method.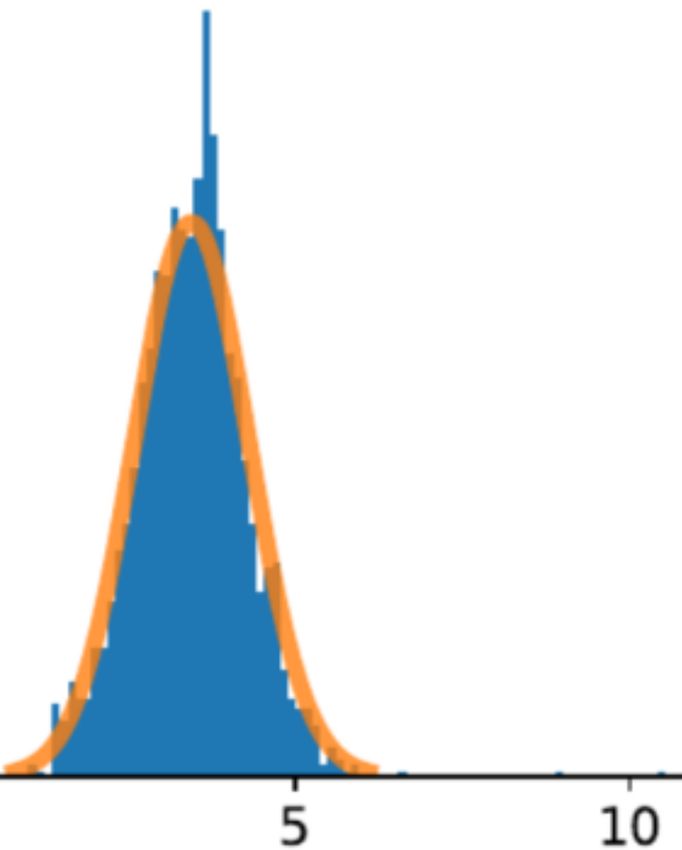
Sensors 2021, 21, 1730                                                                                                      10 of 15

                                         Table 2. State features detection characterization.

  Signal       Distribution         Locality                       Scale             Window Size (ms)        Threshold
   Emin
    A
                  Normal       µ = 0.821 ± 0.010          σ = 0.0711 ± 0.0033              730 ± 50      0.8590 ± 0.0090 g
   Emax
    A
                  Gumbel        u = 2.81 ± 0.18            β = 0.699 ± 0.076               125 ± 15        2.08 ± 0.14 g
    max
   EW             Normal       µ = 3.435 ± 0.045           σ = 0.850 ± 0.021               405 ± 15      2.432 ± 0.058 rad
                                                                                                                         s
   Eρ̇max         Normal      µ = 2.6039 ± 0.0059         σ = 0.7816 ± 0.0051                300         1.682 ± 0.018 rad
                                                                                                                         s
   Eσmin
      2           Gumbel      u = −4.8790 ± 0.0032         β = 0.2751 ± 0.0046                 4500       10−4.427±0.039 g2
      A
                                                                                                                             rad2
   Eσmin
      2           Normal      µ = −3.8673 ± 0.0088        σ = 0.8483 ± 0.0084                  4500      10−2.920±0.074       s2
      W
                                                                                                           −        ±         rad2
   Eσmin
      2           Normal      µ = −3.8721 ± 0.0072        σ = 0.7719 ± 0.0060                  4500     10   3.1509   0.0023
                                                                                                                               s2
      ρ̇

                               (a) ROC                                      (b) MMC
                               Figure 3. Fall features analysis.

                               (a) ROC                                        (b) MMC
                               Figure 4. Immobility features analysis.
Sensors 2021, 21, 1730 11 of 15
(a) ROC (b) MMC
Figure 5. Features fusion analysis.
Table 3. States detection prediction results.
State PD PFA Window (ms) MCC Accuracy Threshold
F 0.966 ± 0.017 0.0222 ± 0.0068 1475 ± 220 0.944 ± 0.019 0.9732 ± 0.0090 0.0254 ± 0.0030
I 0.828 ± 0.033 0.135 ± 0.023 2650 ± 335 0.690 ± 0.026 0.850 ± 0.013 0.038 ± 0.014
D 0.9889 ± 0.0059 0.2822 ± 0.0074 4500 0.6979 ± 0.0091 0.8260 ± 0.0051 0.0038 rad
F-D 0.955 ± 0.016 0.0011 ± 0.0018 4800 ± 1160 0.962 ± 0.012 0.9814 ± 0.0060 N/A
F-I 0.794 ± 0.031 0.0037 ± 0.0042 7500 0.830 ± 0.026 0.915 ± 0.013 N/A
I-D 0.815 ± 0.034 0.0066 ± 0.0059 3850 ± 240 0.843 ± 0.029 0.922 ± 0.015 N/A
MDS 0.9944±0.0037 0.0107 ± 0.0053 N/A 0.9825 ± 0.0080 0.9909 ± 0.0037 N/A
3.2. Workers Physical Tests-Validation
In order to validate that the algorithm developed using the SisFall database can be
used for monitoring worker’s activities with the in-ear device solution, three volunteers
(males between 21 and 25 years old) performed 129 physical tests (92 tests of ADL scenarios
and 37 tests simulating MDS scenarios) based on the proposed workers application-based
physical test protocol from Table 1. The summary of MDS and critical states detection
results are shown in Table 4.
Table 4. Summary of workers physical tests results.
State Nb. of MDS Nb. of ADL TP FP PD PFA MCC Accuracy
F-D 24 92 17 0 0.708 0.0 0.811 0.940
F-I 24 92 18 0 0.75 0.0 0.839 0.948
I-D 37 92 25 2 0.676 0.022 0.727 0.891
MDS 37 92 30 0 0.811 0.022 0.826 0.930
4. Discussion
4.1. SisFall-Models and Validation
Results of fall features signals analysis demonstrates that the transient of extreme
values signal Emax
A
is by far the shortest with an optimal 125 ms (25 × 5 ms/sample) time
window size. Other extreme value fall features signals Eρ̇max , EW max and Emin have much
A
longer optimal time window size, respectively of 300 ms, 405 ms and 730 ms. Fall detection
based on Emax
A
feature score the best detection rate, up to 95%, but also generated the highest
false positive rate. Considering the MCC, Eρ̇max had the best performance principally due
to lowest false positive rate, making it the most relevant for fall state detection. The global
fall scenarios prediction results over the SisFall database show persistent scores with anSensors 2021, 21, 1730 12 of 15
average accuracy up to 97%. This rate is congruent with other study [24], which used a
same level detection method and tested with same database.
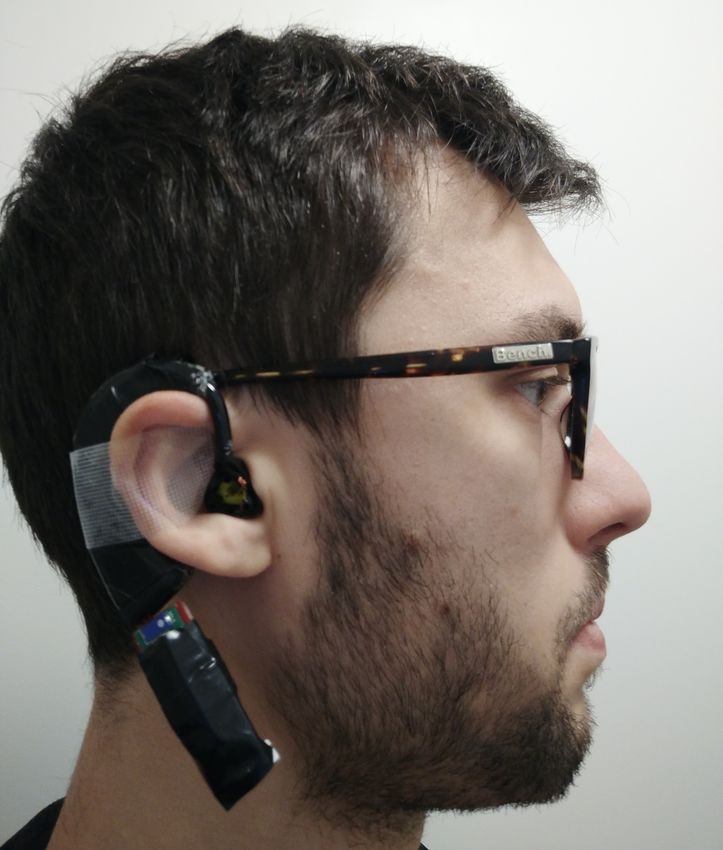
Since the immobility state is based on non-transitory features, the detection certainty
and detection performance increase with time window size, thus the optimal time window
for each immobility state features is 4.5 s, the longest window studied considering the finite
length of database inertial measurement records. Immobility state features show similar
detection performances although Eσmin 2 is slightly ahead with higher precision rate and
ρ̇
MCC. In the case of the minima of the variance of derivative of the tilt angle (Figure 2g),
neither Normal or Gumbel distribution were offering a perfect fit. The statistical test based
on the logarithm RML of functions of normal over Gumbel distributions, as discussed at
Section 2.3, was marginally leaning toward the normal distribution. Besides, the maxima of
the derivative of the tilt angle (Figure 2d) was best fitted by the normal distribution. These
two factors directed us toward utilising the normal distribution.
For down position state detection, Eρmax feature has also non-transient characteristics,
more distinctive with a longer time window, but has a significant error detection rate
explained by the large tilt angle positions of some ADL scenarios. The average value of
Eρmax distribution is 1.451 ± 0.003 radian (≈83◦ ), which is a little less than expected value
for a horizontal position. The tilt angle threshold is set at 0.87 radian, or approximately
50 degrees, which sets the detection rate at 99% for down position state based on fall
scenarios of the database. The down position state is a good indicator of emergency
occurrence despite a 28.2% false alarm rate, issue that is mitigated by critical states detection
fusion. Indeed, the F-D combinatorial state has by far the best potential of MDS detection
with an accuracy rate exceeding 98% and despite detection rates of combinatorial states
are slightly lower than individual critical state detection rates, false positive rates are
significantly reduced to well below 1%. Critical state fusion is then essential to the reduction
of false alarms rates and related undesirable impacts (loss of time, loss of confidence and
costs), which are the main causes of insufficient deployment of MDS detection systems
in geriatric practice and industrial sectors [3]. The effectiveness and reliability of the
MDS detection strategy, based on the proposed global and straightforward definition, is
demonstrated by impressive overall prediction performance, with accuracy and detection
rates over 99% and an 1.1% false alarm rate. These results are confirming our hypothesis
and are very encouraging when compared to others, in practice surpassing most results
from the similar inertial-based and sensor fusion fall detection solutions (accelerometer,
gyroscope or both) [25,26].
4.2. Workers Physical Tests-Validation
The preliminary results from tests based on the proposed workers application-based
physical test protocol show that time window size is a critical factor for the immobility state
detection, mainly in order to reduce false positive. Also, even if inertial data was captured
from a different location than data from SisFall database used for the training phase, i.e.,
the head instead of the waist, the fall detection performed well, correctly detecting 20 fall
scenarios out of 24. This confirms the adaptability of the proposed detection strategy, given
that only six false positive results of the fallen state were detected, all of which occurred
during ADL scenarios involving jumps and high velocity motions. Otherwise, most of
critical states detected over ADL scenarios tests were immobility and down position. The
potential MDS false alarms were mostly rejected by the fusion algorithm and detection
method since only a few critical state detection occurred during the same time window
segmentation. Indeed, only two ADL scenario executions were wrongly classified as MDS,
a meager 2.2% false alarm rate, both during a test where the subjects lie down on the
ground for a few seconds, which led to misinterpreting these situations as I-D states. These
results confirm that the detection fusion function reduces the MDS false alarms conditions
compared to the individual critical states detection. Thus, combinational states and MDS
detection results also indicate a good overall detection performance with a detection rate
of 81.1% and a 93% accuracy. Over the years, many similar realizations using in-ear orSensors 2021, 21, 1730 13 of 15
head-level inertial sensors has been published ([27–29]) but theirs targets is mainly the
elder population which reduce the relevance of comparing the results of the experimental
tests carried out. Globally, these preliminary results are also encouraging considering the
use of training data from waist movement which doubtlessly count for major part of the
loss in performance with the in-ear sensor using the same algorithms.
5. Conclusions
Most research conducted on these types of detection methods have characterized
the man down situations by a specific and isolated event such as a fall or the worker’s
immobility, thus achieving a high detection rate of the specific event, but with somewhat
more limited performances as to detecting actual man down situations.
This study has broadened the characterization of MDS into various combinations of
distinct events, expressed as critical states: a fall (F), lying on the ground (D) and prolonged
immobility (I); whereby any one of these critical states, if taken independently, does not
fully characterize a MDS. Each critical state is the logical output of a simple detection
strategy of its related event, based on an optimally calibrated threshold, which provides
the best possible detection rate of the event. A relatively simple decision-making strategy,
where these critical states are combined through logical fusion, can achieve a very high
detection rate and a very low false alarm rate. The overall result is an integrated solution,
using digital earpiece designed by the CRITIAS Chair, for the hearing protection of workers
and an efficient man down situation detection device.
An enhanced physical tests protocol including additional MDS scenarios is needed
to continue the detection algorithms training and validation process. Ideally, future work
should focus on making an initial database using the earpiece on real workers from real
work environment to analyze the actual worker’s movements and critical situations. The
solution could also be integrated to digital earpieces for hearing aids and thus detect elderly
falls, which are a larger-scale problem given that the elderly population tends to live alone
and is more vulnerable to falls.
For optimization purposes, using larger sets of training data and more advanced
machine learning methods such as neural networks and deep learning might be applied
to the proposed detection strategy. The digital earpiece integrating the inertial platform
could be enhanced by a left-ear right-ear strategy in order to add data redundancy and
correlation between off-centered devices. Monitoring the worker’s vital signs has also been
proposed in the literature for the early assessment of health problems, thus, the CRITIAS
Chair is developing acoustic methods to measure vital signs with the digital earpiece.
The instrumentalized digital earpieces could be used as a “black box” recording relevant
information to understand causes of accidents or other events, similarly to the devices used
on board aircraft.
Author Contributions: Conceptualization, B.D.K. and J.V.; methodology, A.G.-S., B.D.K. and J.V.;
software, A.G.-S.; validation, A.G.-S., B.D.K. and J.V.; formal analysis, A.G.-S., and B.D.K.; investiga-
tion, A.G.-S.; resources, A.G.-S. and J.V.; data curation, A.G.-S.; writing—original draft preparation,
A.G.-S.; writing—review and editing, A.G.-S., B.D.K. and J.V.; visualization, A.G.-S.; supervision,
B.D.K. and J.V.; project administration, A.G.-S. and J.V.; funding acquisition, A.G.-S. and J.V. All
authors have read and agreed to the published version of the manuscript.
Funding: This research was funded by the NSERC-EERS Industrial Research Chair in In-Ear Tech-
nologies (CRITIAS) and by Institut de recherche Robert-Sauvé en santé et en sécurité du travail
(IRSST) grant through the 2017–2018 competition for the graduate studies and postdoctoral training
program in occupational health and safety.
Institutional Review Board Statement: The study was conducted according to the guidelines of the
Declaration of Helsinki, and approved by the Ethics Committee of École de technologie supérieure
(ÉTS) (H20170205, August 9, 2017).
Informed Consent Statement: Informed consent was obtained from all subjects involved in the study.Sensors 2021, 21, 1730 14 of 15
Acknowledgments: The authors would also like to acknowledge the financial and technological
support received from the NSERC-EERS Industrial Research Chair in In-Ear Technologies (CRITIAS).
Conflicts of Interest: The authors declare no conflict of interest.
Abbreviations
The following abbreviations are used in this manuscript:
MDS Man Down Situations
F Fall state
I Immobility state
D Down position state
ADL Activities of Daily Living
IRSST Institut de Recherche Robert-Sauvé en Santé et en Sécurité du travail
CRITIAS EERS-CRSNG Industrial Research Chair in In-Ear Technologies
IMU Inertial Measurement Unit
MEMS Micro-Electromechanical System
TP True Positive
FP False Positive
TN True Negative
FN False Negative
MCC Matthews Correlation Coefficient
ROC Receiver Operating Characteristic
RML Ratio of Maximized Likelihood
References
1. IRSST. Plan Quinquennal de Production Scientifique et Technique 2018–2022; Institut de Recherche Robert-Sauvé en Santé et en
Sécurité du Travail (IRSST): Montreal, QC, Canada, 2017; p. 95. Available online: https://www.irsst.qc.ca/Portals/0/upload/5-
institut/Plan/plan-quinquennal-2018-2022.pdf (accessed on 10 January 2017).
2. Lebeau, M.; Duguay, P.; Boucher, A. Costs of occupational injuries and diseases in Québec. J. Saf. Res. 2014, 50, 89–98. [CrossRef]
[PubMed]
3. Igual, R.; Medrano, C.; Plaza, I. Challenges, issues and trends in fall detection systems. Biomed. Eng. Online 2013, 12, 66.
[CrossRef] [PubMed]
4. Lord, S.R.; Sherrington, C.; Menz, H.B. Falls in Older People: Risk Factors and Strategies for Prevention; Cambridge University Press:
Cambridge, UK, 2001.
5. Brady Workman. Automatic Fall Detection: A Step in the Right Direction. 2018. Available online: https://hearinghealthmatters.
org/dizzinessdepot/2018/automatic-fall-detection-a-step-in-the-right-direction (accessed on 10 June 2018).
6. Bernal, G.; Colombo, S.; Al Ai Baky, M.; Casalegno, F. Safety++: Designing IoT and Wearable Systems for Industrial Safety
Through a User Centered Design Approach. In Proceedings of the 10th International Conference on PErvasive Technologies
Related to Assistive Environments, Rhodes, Greece, 21–23 June 2017; pp. 163–170. [CrossRef]
7. Bekkeng, J.K. Calibration of a Novel MEMS Inertial Reference Unit. IEEE Trans. Instrum. Meas. 2009, 58, 1967–1974. [CrossRef]
8. El-Sheimy, N.; Hou, H.; Niu, X. Analysis and Modeling of Inertial Sensors Using Allan Variance. IEEE Trans. Instrum. Meas. 2008,
57, 140–149. [CrossRef]
9. Dorveaux, E.; Vissière, D.; Martin, A.P.; Petit, N. Iterative calibration method for inertial and magnetic sensors. In Proceedings of
the 48th IEEE Conference on Decision and Control, 2009 Held Jointly with the 2009 28th Chinese Control Conference (CDC/CCC
2009), Shanghai, China, 16–18 December 2009; pp. 8296–8303. [CrossRef]
10. Madgwick, S.O.H.; Harrison, A.J.L.; Vaidyanathan, R. Estimation of IMU and MARG orientation using a gradient de-
scent algorithm. In Proceedings of the 2011 IEEE International Conference on Rehabilitation Robotics, Zurich, Switzerland,
29 June–1 July 2011; pp. 1–7. [CrossRef]
11. Sabatini, A.M. Quaternion-based extended Kalman filter for determining orientation by inertial and magnetic sensing. IEEE Trans.
Biomed. Eng. 2006, 53, 1346–1356. [CrossRef] [PubMed]
12. Yun, X.; Bachmann, E.R. Design, Implementation, and Experimental Results of a Quaternion-Based Kalman Filter for Human
Body Motion Tracking. IEEE Trans. Robot. 2006, 22, 1216–1227. [CrossRef]
13. Sucerquia, A.; López, J.D.; Vargas-Bonilla, J.F. SisFall: A Fall and Movement Dataset. Sensors 2017, 17, 198. [CrossRef] [PubMed]
14. Gumbel, E.J. Les valeurs extrêmes des distributions statistiques. Ann. Inst. Henri Poincaré 1935, 5, 115–158.
15. Mahdi, S.; Cenac, M. Estimating Parameters of Gumbel Distribution using the Methods of Moments, probability weighted
Moments and maximum likelihood. Revista de Matemática Teoría y Aplicaciones 2005, 12, 151. [CrossRef]
16. Qaffou, A.; Zoglat, A. Discriminating between normal and gumbel distributions. Revstat-Stat. J. 2017, 15, 523–536.Sensors 2021, 21, 1730 15 of 15
17. Chicco, D.; Jurman, G. The advantages of the Matthews correlation coefficient (MCC) over F1 score and accuracy in binary
classification evaluation. BMC Genom. 2020, 21, 6. [CrossRef] [PubMed]
18. Nyan, M.N.; Tay, F.E.H.; Murugasu, E. A wearable system for pre-impact fall detection. J. Biomech. 2008, 41, 3475–3481. [CrossRef]
[PubMed]
19. Wu, F.; Zhao, H.; Zhao, Y.; Zhong, H. Development of a Wearable-Sensor-Based Fall Detection System. Int. J. Telemed. Appl. 2015,
2015, 576364. [CrossRef] [PubMed]
20. Kansiz, A.O.; Guvensan, M.A.; Turkmen, H.I. Selection of Time-Domain Features for Fall Detection Based on Supervised Learning.
Lect. Notes Eng. Comput. Sci. 2013, 2208, 796–801.
21. Liu, J.; Lockhart, T.E. Development and evaluation of a prior-to-impact fall event detection algorithm. IEEE Trans. Biomed. Eng.
2014, 61, 2135–2140. [CrossRef] [PubMed]
22. Noury, N.; Fleury, A.; Rumeau, P.; Bourke, A.K.; Laighin, G.O.; Rialle, V.; Lundy, J.E. Fall detection-Principles and Methods.
In Proceedings of the 29th Annual International Conference of the IEEE Engineering in Medicine and Biology Society, Cité
Internationale, Lyon, France 23–26 August 2007; pp. 1663–1666. [CrossRef]
23. Service de Sécurité Incendie de Montréal. Test D’évaluation de la Condition Physique pour l’Emploi de Pompier (In French).
2017. Available online: https://ville.montreal.qc.ca/sim/sites/default/files/test_devaluation_de_la_condition_physique_pour_
lemploi_de_pompier.pdf (accessed on 5 November 2017).
24. Vega, S.; Angela, L. Methodology for Detecting Movements of Interest in Elderly People. Master’s Thesis, Universidad de
Antioquia, Medellín, Colombia, 2016. http://bibliotecadigital.udea.edu.co/handle/10495/7413 (accessed on 5 November 2017).
25. Ren, L.; Peng, Y. Research of Fall Detection and Fall Prevention Technologies: A Systematic Review. IEEE Access 2019,
7, 77702–77722. [CrossRef]
26. Pannurat, N.; Thiemjarus, S.; Nantajeewarawat, E. Automatic fall monitoring: A review. Sensors 2014, 14, 12900–12936. [CrossRef]
[PubMed]
27. Lindemann, U.; Hock, A.; Stuber, M.; Keck, W.; Becker, C. Evaluation of a fall detector based on accelerometers: A pilot study.
Med Biol. Eng. Comput. 2005, 43, 548–551. [CrossRef] [PubMed]
28. Wang, C.; Chiang, C.; Lin, P.; Chou, Y.; Kuo, I.; Huang, C.; Chan, C. Development of a Fall Detecting System for the Elderly
Residents. In Proceedings of the 2008 2nd International Conference on Bioinformatics and Biomedical Engineering, Shanghai,
China, 16–18 May 2008; pp. 1359–1362. [CrossRef]
29. Enomoto, Y.; Endo, H.; Hanawa, D.; Oguchi, K. Novel Fall Detection Method with a Wearable Hybrid-Type Sensor, In Proceedings
of the 6th World Congress of Biomechanics (WCB 2010), Singapore, 1–6 August 2010; pp. 1331–1334. [CrossRef]You can also read