Map Ta Phut Industrial Area
←
→
Page content transcription
If your browser does not render page correctly, please read the page content below
Chamlong Poboon

                                              Map Ta Phut Industrial Area

                                                                       Chamlong Poboon*

Abstract
        .BQǰ 5Bǰ 1IVUǰ XBTǰ UIFǰ ųSTUǰ JOEVTUSJBMǰ FTUBUFǰ PGǰ UIFǰ &BTUFSOǰ 4FBCPBSE
development scheme run by the government’s Industrial Estate of Thailand.
Map Ta Phut industrial project had been successful in creating a large industrial
development which had substantially contributed to the growth of GDP, reduction
of import and creating a huge number of jobs for Thais. Yet, the communities living
around the Map Ta Phut Industrial Area had been suffering from increasingly serious
pollution such as air pollution, water pollution and hazardous waste. Worse, there
had been several incidents that posed serious impact on localities including
employees of the factories. With the continuous impact from industries, local people
and NGOs both inside the area and from outside had voiced their opposition against
the operations of factories periodically, particularly when there were serious
incidents. However, the government had considered the expanding of this industrial
estate as its location was one of the best. The Minister of Industry had to work out
the future of Map Ta Phut Industrial area. On one hand, the area had created
TVCTUBOUJBMǰCFOFųUǰUPǰUIFǰDPVOUSZǰ0OǰUIFǰPUIFSǰIBOE ǰQSFTTVSFTǰGSPNǰUIFǰMPDBMǰQFPQMF ǰ
NGOs and academics were so strong that he could not overlook.
Keywords: Industrial Area, Environmental Impact, Pollution, Policy Decision Making

* The Graduate School of Environmental Development Administration at the National Institute of
  Development Administration
  118 Moo 3, Serithai Road, Klong-Chan, Bangkapi, Bangkok 10240, THAILAND.
  E-mail: Chamlong@nida.ac.th

Vol. 9 No. 1 (January-June 2017)                                        NIDA Case Research Journal
                                                                                             79
Map Ta Phut Industrial Area

                                                                óČĚîìĊęĂčêÿćĀÖøøööćïêćóčé

                                                                                             ÝĞćúĂÜǰēóíĉĝïčâ*

   ïìÙĆé÷ŠĂ
   ǰ           îĉÙöĂčêÿćĀÖøøööćïêćóčéđðŨîîĉÙöĂčêÿćĀÖøøöĒĀŠÜĒøÖ×ĂÜēÙøÜÖćøóĆçîćĂčêÿćĀÖøøö
   ĔîóČîĚ ìĊßę ć÷òŦÜũ ìąđúêąüĆîĂĂÖǰéĞćđîĉîÖćøēé÷ÖćøîĉÙöĂčêÿćĀÖøøöĒĀŠÜðøąđìýĕì÷ǰîĉÙöĂčêÿćĀÖøøö
   öćïêćóčéĕéšßŠü÷óĆçîćĂčêÿćĀÖøøöǰߊü÷ÿøšćÜøć÷ĕéšĒÖŠðøąđìýǰúéÖćøîĞćđךćĒúąÿøšćÜÜćîÝĞćîüî
   öćÖǰ ĒêŠÖĘĕéšÖŠĂĔĀšđÖĉéñúÖøąìïêŠĂßčößîìĊęĂ÷ĎŠøĂïǰ ėǰ đðŨîĂ÷ŠćÜöćÖǰ ēé÷đÞóćąĂ÷ŠćÜ÷ĉęÜöúóĉþìćÜ
   ĂćÖćýǰ ìćÜîĞĚćǰ Ēúą×÷ąĂĆîêøć÷ǰ ÷ĉęÜÖüŠćîĆĚî÷ĆÜöĊĂčïĆêĉđĀêčĂĊÖĀúć÷ÙøĆĚÜìĊęøčîĒøÜǰ ÖøąìïêŠĂìĆĚÜßčößî
   ĒúąóîĆÖÜćîǰ ÝćÖñúÖøąìïéĆÜÖúŠćüìĞćĔĀšđÖĉéÖćøêŠĂêšćîÝćÖßčößîĒúąĂÜÙŤÖøóĆçîćđĂÖßîìĆĚÜĔî
   óČîĚ ìĊĒę úąîĂÖóČîĚ ìĊǰę ēé÷đÞóćąĂ÷ŠćÜ÷ĉÜę đöČĂę đÖĉéđĀêčÖćøèŤìøĊę îč ĒøÜǰĂ÷ŠćÜĕøÖĘêćöǰøĆåïćúÖĘóÝĉ ćøèćìĊÝę ą
   ×÷ć÷îĉÙöĂčêÿćĀÖøøöĂĂÖĕðđîČĂę ÜÝćÖìĊêę ÜĆĚ ìĊöę ÙĊ üćöđĀöćąÿöǰøĆåöîêøĊüćŠ ÖćøÖøąìøüÜĂčêÿćĀÖøøö
   ÝąêšĂÜêĆéÿĉîĔÝĂîćÙê×ĂÜóČĚîìĊęĂčêÿćĀÖøøööćïêćóčéǰ àċęÜĔîéšćîĀîċęÜóČĚîìĊęîĊĚÖĘĕéšÿøšćÜñúðøąē÷ßîŤ
   öĀćýćúĒÖŠðøąđìýǰ ĒêŠĔîĂĊÖéšćîĀîċęÜĒøÜÖééĆîÝćÖßčößîǰ ĂÜÙŤÖøóĆçîćđĂÖßîǰ ĒúąîĆÖüĉßćÖćø
   ÖĘöĊÿĎÜĕöŠÿćöćøëìĊęÝąöĂÜךćöĕéš
   ÙĞćÿĞćÙĆâǰóČĚîìĊęĂčêÿćĀÖøøöǰǰñúÖøąìïÿĉęÜĒüéúšĂöǰǰöúóĉþǰǰÖćøêĆéÿĉîĔÝđßĉÜîē÷ïć÷

    ǰ ÙèąïøĉĀćøÖćøóĆçîćÿĉęÜĒüéúšĂöǰÿëćïĆîïĆèæĉêóĆçîïøĉĀćøýćÿêøŤ
   ǰ đú×ìĊęǰǰĀöĎŠǰǰëîîđÿøĊĕì÷ǰĒ×üÜÙúĂÜÝĆęîǰđ×êïćÜÖąðŗǰÖøčÜđìóöĀćîÙøǰ
   ǰ ĂĊđöúǰ$IBNMPOH!OJEBBDUI

NIDA Case Research Journal                                                   Vol. 9 No. 1 (January-June 2017)
 80
Chamlong Poboon

Introduction
        On May 6, 2013, the headlines of all the major newspapers throughout
the Kingdom of Thailand ran the same general headline:

        “Again! Explosion at the ACB Chemical in Map Ta Phut:
                       12 dead and 14 injured”

         Although the Minister of Industry had already been informed of the explosion
by way of an early morning telephone call from the director of the Map Ta Phut
Industrial Estate, reading the headlines re-ignited the bad mood that the earlier
phone call had brought upon him. Thrusting the newspaper aside, he decided to
DBMMǰ UIFǰ EJSFDUPSǰ PGǰ UIFǰ *OEVTUSJBMǰ &TUBUFǰ UPǰ ųOEǰ PVUǰ XIFUIFSǰ UIFSFǰ XFSFǰ BOZ
additional facts that he could obtain – facts that would be needed to answer
questions that would doubtlessly arise both at forthcoming Cabinet meeting and at
UIFǰUJNFǰUIBUǰKPVSOBMJTUTǰEFTDFOEFEǰPOǰIJTǰPGųDFǰUPǰųOEǰPVUǰXIBUǰIBEǰIBQQFOFE
and what he intended to do about it. Wistfully, he recalled that not only was this
the third incident of the current year, but also by far the most serious one to date.
        The Minister was intimately familiar with the Map Ta Phut Industrial Area.
As the largest and most productive estate in all of Thailand, it had contributed
substantially to the GDP of the country and had been a major source of employment
throughout its operating history. In fact, so successful had the Estate been that the
government had been actively considering a proposal to expand the Area, as its
location – close to the natural gas sites in the Gulf of Thailand and a large deep sea
port --was one of the best in the nation and highly advantageous to the industrial
companies operating therein. The factories in the area comprised natural gas and
PJMǰSFųOFSZ ǰQFUSPDIFNJDBMǰQSPEVDUJPO ǰDIFNJDBMǰGFSUJMJ[FS ǰBOEǰPUIFSǰIFBWZǰJOEVTUSJFTǰ
that used natural gas or petrochemical products as their core raw material.
       The Minister was only too aware that any obstacle to the operation and
the expansion of the Map Ta Phut Industrial Area would not only damage the

Vol. 9 No. 1 (January-June 2017)                                     NIDA Case Research Journal
                                                                                          81
Map Ta Phut Industrial Area

   nation’s economic growth and employment but also the popularity of the
   government. Yet, this explosion – like the past incidents – was certain to trigger
   another series of strong and prolonged protests from the people living in close
   proximity to the Industrial Area, as well as from outraged NGOs from both inside
   and outside Map Ta Phut. It was a foregone conclusion, he mused, that their
   demands will be to stop any expansion of the Map Ta Phut estate and to close the
   factories that they believed to be dangerous to health, welfare, and safety of the
   local community. As the government’s “point man” for matters of industrial policy
   and operations, the Minister knew that the prime minister, as well as the citizens as
   a whole, would expect him to come forward with actions to forestall any additional
   tragedies of this nature.

   The Place: From First Industrial Estate to Province of Industries
            Before the birth of Map Ta Phut Industrial estate, the communities in the area
   IBEǰFBSOFEǰUIFJSǰMJWJOHǰGSPNǰųTIJOHǰBOEǰGBSNJOH ǰHSPXJOHǰDSPQTǰTVDIǰBTǰDBTTBWB ǰTVHBSǰ
   cane, and rice. Their considered lives to be in harmony with nature. As recently as
   1978 there had been only about 8,400 people living in the area. By 2010, however,
   there were approximately 90,000 registered localities in 33 communities plus more
   than 100,000 unregistered ones, most of whose members worked for the industries
   located in or near the Map Ta Phut Estate. Thus, in just one generation, the overall
   population of the area mushroomed, and the main source of livelihood changed
   radically, from pastoral to industrial pursuits.
   ǰ         .BQǰ5Bǰ1IVU ǰUIFǰųSTUǰJOEVTUSJBMǰFTUBUFǰPGǰUIFǰ&BTUFSOǰ4FBCPBSEǰEFWFMPQNFOUǰ
   scheme run by the government’s Industrial Estate of Thailand, had been the driving
   force behind this transformation. It was established in 1989by the Thai government
   after the discovery of a large natural gas reserve in Gulf of Thailand. Located in
   a coastal area of Rayong Province, about 200 km. southeast of Bangkok (see Figure 1),
   its initial area encompassed about 4,000 rai (650 ha.), but had expanded to its
   current size of about 10,000rai (1,600 ha.) – which when added to the surrounding
   four private industrial made for a total industrial area of about 19,000 rai (3,000 ha.).
   Currently, Map Ta Phut and its vicinity was the largest industrial area in Thailand.

NIDA Case Research Journal                                     Vol. 9 No. 1 (January-June 2017)
 82
Chamlong Poboon
It was the heart of the Eastern Seaboard Development scheme and was intended
to be a petrochemical industry hub and a new gateway into Thailand for the world.
After only a little over two decades of development, the number of factories
had substantially increased. Currently, there were about 60 heavy industries in the
Map Ta Phut Industrial Estate, plus more than 80 industries in the surrounding
QSJWBUFǰJOEVTUSJBMǰFTUBUFTǰ$PMMFDUJWFMZ ǰUIFZǰIBEǰFYQBOEFEǰUPǰųMMǰUIFǰXIPMFǰBSFBǰPGǰ
the Eastern Seaboard and beyond (see Figure 1). As such, the Map Ta Phut industrial
project had successfully created a large industrial development which had
substantially contributed to the growth of GDP, the reduction of imports and the
creation of tens of thousands of jobs for Thais.
Figure 1: Location of Map Ta Phut, Rayong Province and Its Main Industrial Estates
ǰ 5IVT ǰ3BZPOHǰ1SPWJODFǰǰPODFǰUIFǰMBOEǰPGǰBHSJDVMUVSF ǰųTIJOHǰBOEǰTUVOOJOHMZǰ
beautiful nature -- had become home to the largest petrochemical and heavy
industrial constellation in Thailand. With petrochemical and related products as
key industries in the area, the number and types of industries in Rayong Province
had expanded rapidly. At present, there were about 1,700 factories in the Province
with a total investment of about 27,170 million US dollars. Of these, there were
400 large factories located in eight industrial estates (see Figure 2). Rayong-based
industries contributed nearly 14% of Thailand’s GDP, thereby according Rayong
province had the highest GDP per capita among all provinces in Thailand.1
Vol. 9 No. 1 (January-June 2017) NIDA Case Research Journal
83Map Ta Phut Industrial Area
Figure 2: Factories in Rayong Province
The Problems: Pollution Galore!
Unfortunately, in line with Map Ta Phut’s continuously increasing
contributions to the Thai economy, the communities living around the Map Ta Phut
Industrial Area had been suffering from increasingly serious pollution problems.
Among the most concerning of the pollutions were those of air and water pollution,
along with hazardous waste. A 2007 study by the Pollution Control Department
contained statistics that revealed that communities in the vicinity of the Area
suffered from respiratory diseases and cancer, at much higher level than the other
areas. Serious impacts from air pollution had been experienced since 1993, and had
not abated.2
Among the incidents chronicled in the aforementioned study was one that
had posed such a serious health threat to students in Map Ta Phut Panpittayakarn
School, a large secondary school located next to the area, that eventually the
NIDA Case Research Journal Vol. 9 No. 1 (January-June 2017)
84Chamlong Poboon
school had to be moved to another area after a series of incidents that caused
a number of students and teachers at the school to become physically ill from the
air pollution. Some other examples of the severity of the pollution and related
problems were:
• The 1997 hospitalization of approximately 40 Map Ta Phut students and
teachers in consequence of their having succumbed to severe chemical
odors from one or more of the adjacent plants. (The school had to be
closed for several days.);
• A 1998 incident in which a number of local people living next to
an industrial waste disposal site became ill from the emitted gas.
• The periodic and serious olfactory problems from petrochemical and
ǰ ǰ SFųOFSZǰQMBOUTǰXJUIǰXIJDIǰMPDBMǰDPNNVOJUJFTǰIBEǰUPǰDPOUFOEǰEVSJOHǰUIFǰ
period, 2000-2003; and,
ǰ Ļǰ 5IFǰ ǰ TFSJPVTǰ TIPSUBHFǰ PGǰ XBUFSǰ TVQQMZǰ UIBUǰ IBEǰ MFEǰ UPǰ DPOŴJDU
between the factories and the local communities.
An interview with one community leader who goes by the name, Thanyapat,
SFBGųSNFEǰ BOEǰ VOEFSTDPSFEǰ UIFǰ MPDBMJUZĴTǰ DPODFSOTǰ BCPVUǰ UIFǰ TFWFSJUZǰ PGǰ UIF
pollution problems. She pointed out:
The most serious impact from Map Ta Phut industries is air
pollution, especially the carcinogenic type of pollution. Sometimes we
can’t feel it, but it is always there. Bad smells is also another threat
to us. We breathe it in everyday. We don’t know when it exceeds
our capacity.
Other local leaders also expressed their concerns about the air pollution
that they often smelled, as well as those that emanated from the occasional
accidents, e.g., explosions. Their other concerns were about water pollution, noise
QPMMVUJPO ǰXBTUF ǰBOEǰUSBGųDǰDPOHFTUJPO
The depiction of Map Ta Phut captured below in Figure 3 succinctly
captured the views of the Estate and its neighbor industrial areas in the minds of local
public.
Vol. 9 No. 1 (January-June 2017) NIDA Case Research Journal
85Map Ta Phut Industrial Area
Figure 3: Perception of Map Ta Phut in the Public’s Mind
Types of Air Pollution in Rayong’s Industrial Area
Given the large number of petrochemical factories concentrated in Rayong’s
industrial area, it was not surprising that the major air pollutants were “volatile
organic compounds” (VOCs), sulfur dioxide (SO2) and Nitrogen Dioxide (NO2).
Although VOCs were the most concerning type of air pollutant (of the more than
40 types of VOCs used or produced in the Area, 20 were known carcinogens), SO2
and NO2, as well as particulate matters were also believed to have serious health
impacts on local people living close to the industrial area. Hence, the air pollution
problem in Rayong had long been of great concern to local people, central government
BHFODJFT ǰSFHJPOBMǰHPWFSONFOUǰPGųDFTǰBOEǰMPDBMǰBVUIPSJUJFTǰ
Pollution from Volatile Organic Compounds (VOCs). Results of the monitoring
of VOCs from 9 stations around the Rayong industrial area from 2007-2010 showed
that there were 3 types of VOCs -- benzene, 1,3 butadiene, and 1,2 dichloromethane,
-- whose 1 year average volumes exceeded the Thai national standards. Another VOC
of great concern was dichloromethane whose volume trend had steadily increased
since 2010. The data also indicated that the stations where the VOCs volumes had
exceeded the standards were mostly located close to the dense industrial areas
of Map Ta Phut Industrial Estate and IRPC Industrial Estate. Figures 4 through 7
show the results of air quality monitoring at the 9 stations.3
NIDA Case Research Journal Vol. 9 No. 1 (January-June 2017)
86Chamlong Poboon
Figure 4: Benzene Volumes in Map Ta Phut Area, 2007-2010
Figure 5: 1,3 Butadiene Volumes in Map Ta Phut Area, 2007-2010
Figure 6: 1,2 Dichloroethene Volumes in Map Ta Phut Area, 2007-2010
Vol. 9 No. 1 (January-June 2017) NIDA Case Research Journal
87Map Ta Phut Industrial Area
Figure 7: 1,3 Dichloromethane Volumes in Map Ta Phut Area, 2007-2010
As can be observed in the above-shown pollution monitoring results during
the period 2007-2010, VOCs concentrations of carcinogenic air pollutions in the
communities surrounding Map Ta Phut Industrial Area were consistently at
a worrisome level. In some areas they were well above the standards. The levels
were within the standards in the other areas, but barely so.
The Pollution from Other Sources –PM10, Ozone, SO2, NO2, and CO.
Volatile organic compounds (VOCs) were by no means the only source of
pollution in the Industrial Estate or in Rayong province as a whole. Air quality monitoring
in the province’s Pollution Control Area from 2004-2010, revealed that the 24-hour
maximum volumes of PM10 (particulate matter that is smaller than 10 microns)
exceeded the standards from 2004 to 2008. On the other hand, maximum volumes
of ozone were within the Thai national standards from 2004 to 2006, but exceeded
the standard from 2007 to 2010. Further, the maximum volumes of sulfur dioxide
(SO2), nitrogen dioxide (NO2), and carbon monoxide (CO) were within the standards
for these 7 years.
Impacts of Air Pollution and Safety Problems
Serious and steadily worsening environmental degradation in the Area was
having impacts on local residents in at least two major ways. First, there were the
immediate and out right pollution impacts on the health of those living or working
NIDA Case Research Journal Vol. 9 No. 1 (January-June 2017)
88Chamlong Poboon
or attending school in the vicinity of the Industrial Estate; and, second were impacts
of a safety nature.
Health Impacts. A continuum of health problems had come to be attributed
to the poor air quality in the immediate vicinity of the Industrial Estate. At one end
of the continuum were acute and chronic respiratory ailments, which had become
an oft-encountered ailment of local people. In fact, the Pollution Control
Department reported that the highest number of people visiting the external
patient sections of hospitals and other healthcare service organizations came to get
checked for respiratory diseases. In addition, it was reported that the ratio of people
who suffered from respiratory diseases in Rayong was higher than that of the country as
a whole. Worse, the trend in Rayong was accelerating, while the trend for the country
as a whole was decreasing.
At the other end of the continuum of health issues and problems was the
rising proportion of deaths that were attributed to cancer. It had come to pass that
the ratio of the deaths from cancer, particularly lung cancer, in the Map Ta Phut
industrial area was higher than the ratio pertaining to both Rayong Province and
the country as a whole. However, notwithstanding the disproportionate incidences
of such sicknesses and deaths in the Map Ta Phut industrial area, there was as yet
OPǰQBSUJDVMBSǰTUVEZǰDPOųSNJOHǰUIFǰSFMBUJPOTIJQǰCFUXFFOǰUIFTFǰTJDLOFTTFTǰBOEǰEFBUITǰ
and pollution in the Area. Thus, only an association, not causality, could be shown.
Safety Impacts. Since the establishment of Map Ta Phut Industrial Estate,
there had been a series of serious incidents that had varying degrees of impact on
workers and/or local people, ranging from injuries to loss of life. Unlike the health
effects of air pollution, where causality was sometimes disputed and denied, the
immediate cause of industrial accidents tended to be more indisputable. For
example, culpability for the May 5, 2013 explosion at the BST Petrochemical
Factory, one of the most severe accidents in the operating history of the Map Ta Phut
Estate, could not be denied. The explosion wave strongly hit factories and buildings
in 500-meter radius of the plant and could be heard as far away as 5 kms. (see Figure
8). Twelve workers lost their lives, and several others suffered injuries of varying
degrees of seriousness.
Vol. 9 No. 1 (January-June 2017) NIDA Case Research Journal
89Map Ta Phut Industrial Area
Figure 8: The May 5, 2013 Explosion in Map Ta Phut Industrial Estate
Responses and Actions of the Factories, Government, and People
What to do about these health and safety issues had long been a matter
of deliberation, debate, and action within each of the three most directly involved
stakeholders of the Map Ta Phut Industrial Estate. These were expected to accelerate
in line with the frequency and seriousness of the precipitating problems.
Factory Responses and Actions
Though their actions were not always visible to affected residents, the
industrial plants themselves were active participants in the quest to improve the
quality of life of residents in the vicinity of the Estates. In particular, factories in the
Map Ta Phut area had attempted to alleviate major air pollution problems from
their operations by establishing policy, making plans and projects, allocating budget,
personnel, and equipment, and adopting modern technologies.4ǰ4PNFǰPGǰUIFǰTQFDJųDǰ
actions taken to control VOCs, SO2 and NOx were as shown in Table 1 below.
NIDA Case Research Journal Vol. 9 No. 1 (January-June 2017)
90Chamlong Poboon
Table 1: Factory Actions Taken to Control VOCs,SO2 and NOx in Map Ta Phut
Actions VOCs SO2 and NOx
1. Establishment of policies 67% 64%
2. Development of plans and projects 83.9% 76%
ǰ'VOEJOHǰPGǰTVGųDJFOUǰCVEHFUǰUPǰJNQMFNFOUǰQPMJDJFT ǰQMBOTǰ 90.3% 96%
and projects
4. Adequacy of personnel 80.6% 92%
5. Continuous monitoring of leak points /emissions 67.7% 96%
6. Adequacy of equipment 67.7% n/a
7. Employment of modern technology 77.4% 80%
8. Continuously monitoring and evaluation of plans and projects n/a 88%
VOCs. As shown in the Table above, the vast majority of factories in the
Estate were tackling the problem of volatile organic compounds, with a plurality or
HSFBUFSǰQVSQPSUJOHǰUPǰIBWFǰFTUBCMJTIFEǰQPMJDJFT ǰEFWFMPQFEǰTQFDJųDǰQMBOTǰBOEǰQSPKFDUT ǰ
assured adequacy of budget and personnel with which to reduce VOCs emissions.
In addition, slightly more than two-thirds of the industrial plants monitored VOCs
emissions continuously and had enough equipment for VOCs monitoring; and, more
than three-quarters purported to employ technology for monitoring and controlling
VOCs leak points.
The principal technologies employed to prevent or minimize VOCs leaking
were: dual mechanical seal pumps or seal-less pumps, a closed loop system in
sampling connections, installing blinds, caps or plugs at open-ended pipes, using
EPVCMFǰSJNǰTFBMTǰGPSǰŴPBUJOHǰSPPGǰUBOL ǰJOTUBMMJOHǰJODJOFSBUJPOǰTZTUFN ǰVTJOHǰBDUJWBUFEǰ
carbon for VOCs absorbing, installing scrubber, etc. (see Appendix 3 for the examples
of these technologies).
SO2 and NOx. Similarly, a near plurality of the factories reported having
established policies for reduction of SO2 and NOx emissions, with a plurality or greater
QVSQPSUJOHǰ UPǰ IBWFǰ QMBOTǰ BOEǰ QSPKFDUT ǰ BMPOHǰ XJUIǰ CVEHFUBSZǰ TVGųDJFODZǰ BOE
personnel adequacy for this express purpose. Nearly all reported continuous
Vol. 9 No. 1 (January-June 2017) NIDA Case Research Journal
91Map Ta Phut Industrial Area
monitoring of SO2 and NOx emissions, and a plurality purported to employ modern
technology for this purpose. Additionally, the vast majority represented that they
continuously monitored and evaluated the progress of the plans and projects.
The technologies used were, for example: low NOx burner, wet electrostatic
precipitator, steam injection, steam de-NOx ǰDJSDVMBUJOHǰŴVJEJ[FEǰCFEǰCPJMFS ǰCBHǰųMUFSǰ
single cyclone, sea water desulphurization, and, using alternative fuels (see Appendix 4
for the examples of these technologies).
Governmental Responses and Actions
The central government – through its Department of Industrial Works, the
Industrial Estate of Thailand and the Pollution Control Department – had also been
trying to mitigate the impact from air, and other, pollutions in the Map Ta Phut
industrial area. One important measure was the implementation of the 2007-2011
Pollution Reduction in Rayong Province Action Plan which was focused on the Map Ta
Phut area. This action plan guided the activities of all concerned sectors – the factories,
government agencies, local government and local people– with respect to tackling
the pollution impacts from the industries. However, as could be seen from several
subsequent pollution incidents and occasional protests by local residents and the
NGOs, this action plan did not fully solve the problems. The weak point of the action
plan was attributed to the inadequacy of concrete support to all actors, particularly
JOǰUFSNTǰPGǰųOBODJBMǰSFTPVSDFTǰ)FODF ǰJOǰMBSHFǰNFBTVSFǰCFDBVTFǰPGǰUIFǰWFSZǰTUSPOHǰ
and continuing (2007) movement of local people and NGOs requesting the Map Ta
Phut industrial area to be a pollution control zone, the government (by order of the
Administrative Court) did precisely that in 2009 -- i.e., declared Map Ta Phut and
its surrounding industrial area to be a pollution control zone.
Many observers had expected the action to lead to more effective measures
to control and manage the pollution problem, as it required the relevant government
agencies to pay more attention and provide more resources. However, the only concrete
result of the declaration was the formulation of the Pollution Management Action
Plan for the Pollution Control Zone which solicited the cooperation of all sectors,
including local authorities and local people.
NIDA Case Research Journal Vol. 9 No. 1 (January-June 2017)
92Chamlong Poboon
The latest initiative from the government was to develop Map Ta Phut
Industrial Area into an “Eco-Industrial Park” or Eco-Industrial Town. The Industrial
Estate Authority of Thailand had adopted the idea from European countries and
Japan, where this approach had been working quite successfully in several industrial
areas. The IEAT hired some consultants to study the feasibility and formulate a plan
for Map Ta Phut. However, concrete implementation has yet to be seen.
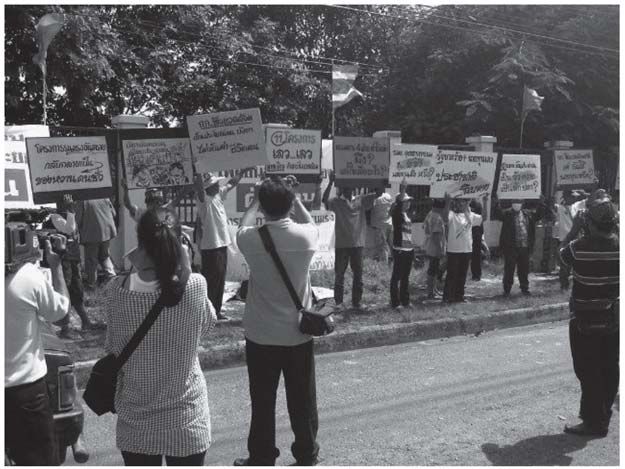
The People’s Responses and Actions
Due to the ongoing pollution impacts of the Map Ta Phut Industrial area, the
local people had gradually become increasingly alarmed about the long-term health
effects on themselves and their families. As this awareness and concern grew, residents
had organized several protest demonstrations against the operation of the factories
over the years – usually in the aftermath of yet another serious pollution incident.
Among their perennial requests was that either the factories improve their operations
in order to minimize the emissions – or, be closed. Sometimes the protests engaged
in bold actions, such as blocking the entrance of the industrial estates and not
allowing the workers to enter or leave (see Figure 9). The protesters had even
trekked to Bangkok to demonstrate at the Ministry of Industry (see Figure 10).
Indeed, it was this kind of bold action by the local people, aided by the
NGOs, that had precipitated the designation of Map Ta Phut as a pollution control
[POFǰ.PSFǰTQFDJųDBMMZ ǰXIFOǰUIFǰMPDBMǰSFTJEFOUTǰBOEǰUIFJSǰ/(0ǰTVQQPSUFSTǰSFDFJWFEǰ
no response to their April 2007 letter to the National Board of Environment
demanding that the Board declare Map Ta Phut a pollution control zone, they had
QSPDFFEFEǰUPǰųMFǰTVJUǰJOǰUIFǰ"ENJOJTUSBUJWFǰ$PVSUǰ 0DUPCFSǰ ǰBSHVJOHǰUIBUǰUIFǰ
board had shirked its duty. On March 3, 2009, the Court concurred and ordered the
board to declare Map Ta Phut a pollution control zone.
ǰ .PSFPWFS ǰJOǰUIBUǰTBNFǰZFBS ǰUIFǰQFPQMFǰųMFEǰBǰTFDPOEǰTVJUǰXJUIǰUIFǰ$PVSUǰ
TFFLJOHǰ UIFǰ JOEFųOJUFǰ TVTQFOTJPOǰ PGǰ ǰ MBSHFǰ OFXǰ QSPKFDUTǰ JOǰ UIFǰ BSFBǰ POǰ UIF
grounds that they had not undergone the Health Impact Assessment as stipulated in
the 2007 Constitution. The court responded with a ruling that ordered the suspension
of 65 projects -- which resulted in a huge loss of investment in the area.
Vol. 9 No. 1 (January-June 2017) NIDA Case Research Journal
93Map Ta Phut Industrial Area
Figure 9: A Protest against Factories in Map Ta Phut
Figure 10: A Protest by a NGO at the Ministry of Industry against the operation
of Map Ta Phut Industrial Area
NIDA Case Research Journal Vol. 9 No. 1 (January-June 2017)
94Chamlong Poboon
Local community dissatisfaction with the performance of both the
government and the factories was profound. Indeed, interviews with community
MFBEFSTǰSFWFBMFEǰUIBUǰUIFǰNBKPSJUZǰPGǰUIFNǰXFSFǰĶEJTTBUJTųFEķǰXJUIǰUIFǰQFSGPSNBODFTǰ
of the government agencies and the factories in solving the impacts of the industries
on local communities. Pranee, a local activist, expressed her dissatisfaction towards
the factories in these words:
The factories are not sincere in solving the problems.
They don’t come to talk to the people before launching projects.
They don’t inform people what exactly the projects are. When the
problems occur, they always blame the other factories. If the incidents
are clearly from their factories, they just say that they will try their
best to prevent the next ones.
Suthep, a community leader, concurred, pointing that “the root cause of
problems in Map Ta Phut Area is the factories do not conform to the laws due to
UIFJSǰTFMųTIOFTTǰBOEǰMBDLǰPGǰBDDPVOUBCJMJUZķǰand that ĶDPSSVQUFEǰHPWFSONFOUǰPGųDFSTǰ
XFSFǰBOǰBEEJUJPOBMǰGBDUPSķ
Srisuwan, one of the leading NGOs who had been very active in ongoing efforts
to have Map Ta Phut’s pollution and safety problems adequately addressed,
had a very strong opinion about the performances of the government and the
factories
The government has absolutely failed to solve the problems.
The relevant agencies fail to enforce the laws. They don’t have good
cooperation, so the control of pollution is ineffective. The factories
don’t observe the measures stipulated in their EIA (Environmental
*NQBDUǰ"TTFTTNFOU ǰBOEǰ)*"ǰ )FBMUIǰ*NQBDUǰ"TTFTTNFOU ķ
5IFǰ'VUVSFǰPGǰ.BQǰ5Bǰ1IVUǰ$PVOUSZǰ#FOFųUTǰWTǰ-PDBMǰ4BDSJųDFT
Ķ.ZǰPOMZǰSFHSFUǰJTǰUIBUǰ*ǰIBWFǰCVUǰPOFǰMJGFǰUPǰMPTFǰGPSǰNZǰDPVOUSZķǰ
. . . Final words of the American patriot Nathan Hale, who was hanged by the British
for support of the American struggle for independence in the late-1770s.
Vol. 9 No. 1 (January-June 2017) NIDA Case Research Journal
95Map Ta Phut Industrial Area
The local residents in the vicinity of Map Ta Phut could be forgiven if they
FWFSǰ DBNFǰ UPǰ CFMJFWFǰ UIBUǰ UIFZǰ XFSFǰ CFJOHǰ BTLFEǰ UPǰ TBDSJųDFǰ UIFJSǰ IFBMUI ǰ JGǰ OPU
their very lives, for the greater good of the nation as a whole. After all, despite the
repeated attempts by all sectors – government, industry, and locals -- to solve the
pollution and safety problems of Map Ta Phut, the crisis continued largely unabated.
The number of people suffering from the still ubiquitous pollution continued to increase.
The future of the Area was still unresolved, despite widespread discussion in several
arenas by different interested groups with their own distinct views.
Local people and their NGOs allies were adamant about wanting Map Ta Phut
to stop growing, and to undertake concrete improvement of the operation of the
factories to minimize pollution. Moreover, they were insistent that the demonstrably
dangerous factories be closed or moved out of the area. They demanded greater
monitoring of the factories and stricter enforcement of laws concerning environmental
JTTVFTǰ4SJTVXBO ǰXIPǰIBEǰKPJOFEǰUIFǰMPDBMTǰJOǰųMJOHǰBǰTVJUǰBHBJOTUǰUIFǰǰOFXǰMBSHFǰ
projects, emphasized that:
For the better future of Map Ta Phut, the factories that cannot
control the leakage or emissions of pollution must be closed. All
factories must join the eco-industry process. Industry must adopt the
real CSR (Corporate Social Responsibility) and implant this concept
throughout their organizations, to all administrators and employees.
.BQǰ5Bǰ1IVUǰNVTUǰTUPQǰFYQBOTJPOǰEFųOJUFMZǰ
Academicians also wanted the government to reconsider the development
of the area, as it had already imposed too much of a burden on the environment and
the local people. One of the academics who has been working with the issue for many
years addressed what she considered the root cause of the problem:
There are too many factories in Map Ta Phut area. Although
each factory emits pollution within the standards, the overall emissions
are too much for the carrying capacity of Nature in the area. Hence,
living things in the area cannot live their lives happily.”
NIDA Case Research Journal Vol. 9 No. 1 (January-June 2017)
96Chamlong Poboon
Alas, it was an inescapable fact that the matter of Map Ta Phut was now,
once again, in his hands, thought the Minister of Industry. The challenge of working
out the future of Map Ta Phut Industrial area was now his as the incumbent Minister.
On the one hand, not to be dismissed lightly was the fact that the area had created
TVCTUBOUJBMǰFDPOPNJDǰCFOFųUǰUPǰUIFǰDPVOUSZǰıǰBǰDPOUSJCVUJPOǰUIBUǰXBTǰFYQFDUFEǰUPǰ
increase in the future. But, on the other hand, the health of the local populace was
BǰMFHJUJNBUFǰDPODFSOǰPGǰHPWFSONFOUǰ*OǰGBJSOFTT ǰIFǰXPOEFSFE ǰIPXǰNVDIǰTBDSJųDFǰDPVMEǰ
the rest of society expect of the local people whose very lives were being placed at
SJTLǰGSPNǰUIFǰNPOVNFOUBMǰQPMMVUJPOǰXJUIǰXIJDIǰUIFZǰXFSFǰBGŴJDUFE ǰ.PSFPWFS ǰXJUIǰ
pressures from the local people, NGOs and academics becoming steadily stronger
with each successive incident such as the recent mishap, he could not overlook the
possibility that the main opposition political party might capitalize on the growing
dissatisfaction with the government’s response and succeed in winning the election,
which was scheduled to take place within the next year.
References
3BZPOHǰ1SPWJODJBMǰ*OEVTUSZǰ0GųDFǰ ǰInformation of Industry in Rayong Province.
Retrieved August 10, 2016 from http://www.industry.go.th/ops/pio/ rayong/
page/home.aspx
Pollution Control Department. (2007). Pollution Mitigation in Map Ta Phut Area.
Retrieved April 8, 2012 from www.pcd.go.th/info_serv/pol_maptapootst.
html_14k
Industrial Estate Authority of Thailand. (2011). Final Report of Strategic Environmental
Framework towards Eco-Industrial Town: A Case Study of Map Ta Phut Area.
Poboon, et al. (2012). Air Pollution Management in Rayong’s Industrial Area, WIT
Transaction on Ecology and the Environment. 157, 189-199.
Vol. 9 No. 1 (January-June 2017) NIDA Case Research Journal
97Map Ta Phut Industrial Area
Appendix 1: Information on Industries in Rayong Province
Investment capital /PǰPGǰ
/P Types of industry Number
(baht) employees
1 Chemical 253,433,385,885.23 131 15,545
2 Transport 182,617,410,764.13 154 28,116
3 Costume 11,616,000.00 2 291
4 Metal 72,300,181,000.00 29 5,168
5 Chemical and Products 59,125,900,000.00 15 2,078
6 Metal Products 33,582,214,104.40 193 13,538
7 Plastic 24,184,865,652.28 104 11,063
8 Non-metal Industrial 18,247,806,520.00 83 3,421
9 Machinery 15,003,494,458.43 94 7,609
10 Textiles 14,987,539,802.99 18 4,919
11 Electricity 14,793,778,567.65 50 9,861
12 Rubber 10,559,332,273.75 67 9,313
13 Paper and Paper Products 7,261,290,000.00 18 1,339
14 Cuisine 3,729,699,883.00 115 8,004
15 Wood and Wood Products 3,463,485,000.00 117 4,263
16 Agriculture 1,939,472,900.00 242 1,656
17 Furniture 1,710,095,000.00 40 6,214
18 Leather 838,950,000.00 5 823
19 Publications 576,540,000.00 14 884
20 Beverage 62,050,000.00 4 196
21 Other Industrials 96,832,224,673.48 236 9,805
Total 815,261,332,485.34 1,731 144,106
Note: 30 baht = 1 US$
Source:ǰ3BZPOHǰ1SPWJODJBMǰ*OEVTUSZǰ0GųDF ǰ
NIDA Case Research Journal Vol. 9 No. 1 (January-June 2017)
98Appendix 2: Volumes of PM10, SO2, NOx CO, and O3 from 2004-2010 in Rayong’s Pollution Control Area
Fume < 10 Micron (PM10) Sulphur Dioxide Nitrogen Dioxide Carbon Monoxide Ozone
"WFSBHFǰǰISTǰ "WFSBHFǰǰISTǰ "WFSBHFǰǰISǰ "WFSBHFǰǰISǰ "WFSBHFǰǰISǰ
Year
.JDSPHSBN - .JDSPHSBN - .JDSPHSBN - .JDSPHSBN - .JDSPHSBN -
.BY .JO UJNF 4UE .BY .JO UJNF 4UE .BY .JO UJNF 4UE .BY .JO UJNF 4UE .BY .JO UJNF 4UE
2004 162.0 10.31 11/333 65.0 0.0 0/7,721 76.0 0.0 0/8,137 2.9 0.0 0/8,204 96.0 0.0 0/8,167
Vol. 9 No. 1 (January-June 2017)
2005 163.2 17.2 9/352 175.0 0.0 0/8,283 92.0 0.0 0/8,359 2.4 0.0 0/8,123 88.0 0.0 0/8,335
2006 137.0 13.4 3/355 73.0 0.0 0/8,197 64.0 0.0 0/8,249 2.3 0.0 0/8,345 98.0 0.0 0/8,335
2007 162.9 16.6 9/288 66.0 0.0 0/7,101 67.0 0.0 0/7,932 2.3 0.0 0/8,078 119.0 0.0 21/8,105
2008 121.3 14.4 1/330 70.0 0.0 0/8,023 74.0 0.0 0/8,101 3.3 0.0 0/8,039 114.0 0.0 12/8,107
2009 81.2 5.8 0/342 42.0 0.0 0/7,909 84.0 0.0 0/7,948 2.2 0.0 0/8,007 117.0 0.0 3/7,936
2010 63.3 7.3 0/316 25.0 0.0 0/7,515 62.0 0.0 0/7,400 2.1 0.0 0/7,576 141.0 0.0 9/7,571
Standard = 120 300 170 30 100
Source: Pollution Control Department, 2007, 2008, 2009, 2010: website http://www.pcd.go.th/
Chamlong Poboon
99
NIDA Case Research JournalMap Ta Phut Industrial Area
Endnotes
1
3BZPOHǰ1SPWJODJBMǰ*OEVTUSZǰ0GųDFǰǰ*OGPSNBUJPOǰPGǰ*OEVTUSZǰJOǰ3BZPOHǰ1SPWJODF
2
Pollution Control Department, 2009: website.
3
Industrial Estate Authority of Thailand. 2011. Final Report of Strategic Environmental
Framework towards Eco-Industrial Town: A Case Study of Map Ta Phut Area.
4
Poboon, et al. 2012. “Air Pollution Management in Rayong’s Industrial Area,
Thailand.” WIT Transaction on Ecology and the Environment. Vol. 157, 189-199.
NIDA Case Research Journal Vol. 9 No. 1 (January-June 2017)
100You can also read