March Quarter 2022 - sres
←
→
Page content transcription
If your browser does not render page correctly, please read the page content below
sres

       March Quarter 2022
                            1
Table of Contents
Report objective                                     4

Report disclaimer                                    4

Executive Summary                                    5

1.     Australian carbon credit units                7

2.     Large-scale generation certificates           15

3.     Small-scale technology certificates           19

4.     International carbon units and certificates   23

Glossary                                             24

List of acronyms and abbreviations                   26

                                                          2
3

Report objective
Carbon markets play a key role in Australia’s efforts to reduce emissions. The Clean Energy Regulator
has prepared this report to support the effective operation of Australia’s carbon markets.

This report consolidates information across the three national carbon markets that the Clean Energy
Regulator administers for the March quarter 2022 (January 2022 to March 2022), providing information
on supply and demand trends, and opportunities to inform market decisions.

Report disclaimer
All figures are sourced from the Clean Energy Regulator unless otherwise referenced. All statements in
this report reflect current policy settings, other than in specific instances where the Australian
Government has announced or is consulting on proposed policy changes.

This Quarterly Carbon Market report represents the views of the Clean Energy Regulator at the date of
publication. The Clean Energy Regulator is providing this information to the market to increase market
transparency, help identify genuine low-cost carbon abatement opportunities, and assist entities that
produce or need to source units and certificates under the schemes the Clean Energy Regulator
administers. The Clean Energy Regulator has used its best endeavours to ensure the quality of the
information in this document but cannot guarantee its accuracy or completeness. The Quarterly Carbon
Market report is not legal, business or financial advice. You should obtain independent professional
advice on your circumstances before making any investment decisions. The information is provided as
general information only. Neither the Clean Energy Regulator, nor the Commonwealth of Australia will
accept liability for any direct, incidental or consequential loss or damage resulting from the Quarterly
Carbon Market report, or the information provided through the Quarterly Carbon Market report, or the
availability or non-availability of the Quarterly Carbon Market report.

Version history
 Version         Date                                         Changes
 2.00       15 June 2022     Correction of typographical error on page 8 under the heading ACCU
                             transactions and reported spot prices
 1.00       09 June 2022     -

                                                                                                        4
Executive Summary
At the end of Q1 2022, metrics for the full calendar year were largely in line with expectations set out in
the Q4 2021 report. Year on year comparison of first quarter data is not necessarily sufficient to call out
trends, however the following Q1 metrics will be worth watching during the year:

        •     ACCU voluntary cancellations 282,778 (up from 174,489 in Q1 2021)
        •     LGC voluntary cancellations 1,216,230 (up from 358,473 in Q1 2021)
        •     CER cancellations (international offset units) 2,639,875 (up from 1,599,141 in Q1 2021)
        •     ERF project registrations 122 (up from 44 in Q1 2021)
        •     renewable projects reaching final investment decision totalling 1.3 GW in Q1 (compared to 2.9
              GW for all of 2021).
Information on Safeguard facilities was published in March with 419,315 ACCUs cancelled for the 2020-
21 financial year, up from 246,539 for 2019-20.

The 14th ERF auction held early in Q2 on 5 and 6 April yielded a higher volume than the previous auction,
with 7.6 million ACCUs for optional delivery contracted at an average price of $17.35.

On 31 March, the request for proposal for the Australian Carbon Exchange and new register was issued
to the 13 shortlisted parties. 1

Q1 saw significant media interest on exit arrangements for Australian Government ACCU fixed delivery
contract milestones and as well as claims made about the ERF. Market analysis on this can be found in
Chapter 1.

The Clean Energy Regulator holds the view that the ERF is a world class offsets scheme that Australians
can continue to have a high level of confidence in. The Clean Energy Regulator’s responses to public
statements on integrity are available here and Emissions Reduction Assurance Committee (ERAC)
responses are available here.

Voluntary carbon market off to a very strong start in 2022
Participation in the Climate Active carbon neutral program underpinned a significant proportion of the
increase in voluntary cancellations of ACCUs, LGCs and CERs in Q1.

LGCs had the largest year on year Q1 increase in both absolute numbers and percentage change. It is
expected that GreenPower will have a big year with most cancellations occurring in Q3.

The Clean Energy Regulator expects total voluntary cancellations of units and certificates in 2022 will be
a big step up from 2021 and likely exceed expectations from the Q4 2021 report. Full analysis of the
voluntary carbon market will be published in the Q4 report as major cancellations typically occur in the
second half of the year.

Record ACCU trading volumes in Q1
The total volume of ACCUs traded in the secondary market throughout Q1 2022 was 3.2 million, up from
the previous quarterly record of 3 million in Q4 2021. Figure 1.1 shows how trading volume has been
materially increasing over the past 2 years.

The volume of ACCUs traded in the reported spot market (a subset of the total trading numbers above)
also hit a record at 940,000 in Q1, up from the previous highest volume of 400,000 in Q4 2021. 2

1   This is the procurement stage and tenders are expected by 27 June 2022. Information is available here.
2
    Some intermediaries report trades with volume and price.
                                                                                                             5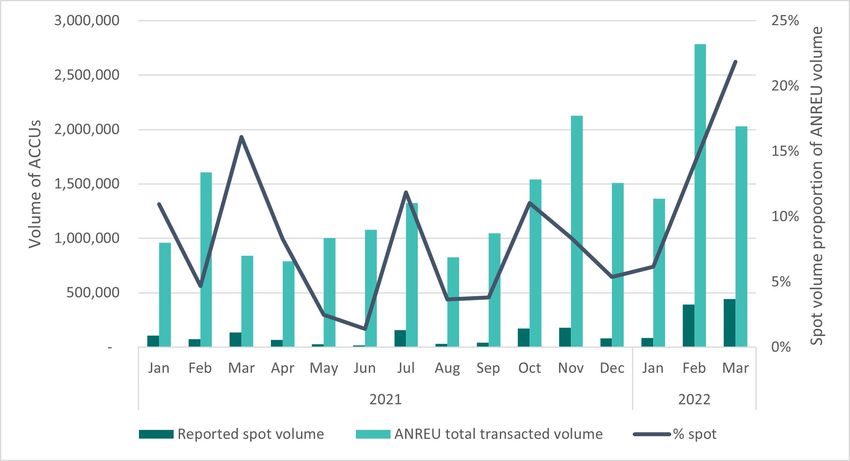
Since the announcement of exit arrangements for Commonwealth contract milestones on 4 March and
up until 28 March, there have been 13 reported spot market trades for a total of 290,000 ACCUs at a
volume weighted price of $32.50. In early May there were two options trades for 100,000 ACCUs each at
a strike price of $35. Additionally, in late May there has been a material step up in spot price and
volumes with larger differentiation of price for units that have related co-benefits. Greater clarity may be
seen on the price direction of reported trades in the next few months.

Market trading and the new Commonwealth fixed delivery contract milestone exit arrangements is
discussed in depth in chapter 1.

Large-scale renewables investment continues the strength seen in H2 2021
In Q1 2022, 1.3 GW of additional large-scale renewables capacity reached final investment decision (FID).
Full calendar year capacity in 2021 reaching FID was 2.9 GW with the majority of 2.1 GW in the second
half of 2021. Both the Q3 and Q4 2021 reports stated an expectation that investment strength would
continue into the first half of 2022, and the Q1 capacity is a good start to 2022.

FID decisions are driven by commercial processes and can vary significantly from quarter to quarter. It is
too early to say whether 2022 will be the third year in a row that total FID capacity increases. There are
many signals for investment including announcements of coal plant closures being brought forward, LGC
spot prices—finishing Q1 at $48—and wholesale electricity prices increasing.

Further analysis on how large-scale renewables has and is responding to investment signals is available
in chapter 2.

Reduction in new rooftop solar capacity as expected
The Q4 2021 report signalled that 2022 would likely end the 5-year trend of increasing annual rooftop
solar capacity investment, and predicted the STC Clearing House would see material use for the first time
since 2017. This was realised over Q1, with 2.9 million regulator created STCs purchased through the
clearing house in the lead up to the 2022 Q1 surrender on 28 April.

The installed capacity in Q1 this year was 561 MW, well below the 782 MW in Q1 2021. The Clean Energy
Regulator believes, on current trends, the installed capacity for 2022 will be approximately 2.3 GW, well
below the record 3.2 GW in 2021. This estimate is explained further in chapter 3 along with our analysis
of likely reasons for the slowing in rooftop solar installations.

Table ES.1 Certificate prices 3, Q1 2022
    Certificate type              Spot price AUD    Change
                                                      from
                                 (31 March 2022)
                                                    previous
                                                    quarter
    ACCU                    $30.50                 -$20.50
    LGC                     $48.00                 +$4.00
    STC                     $39.90                 +$0.95

3
    Data sourced from Jarden and TFS Green

                                                                                                        6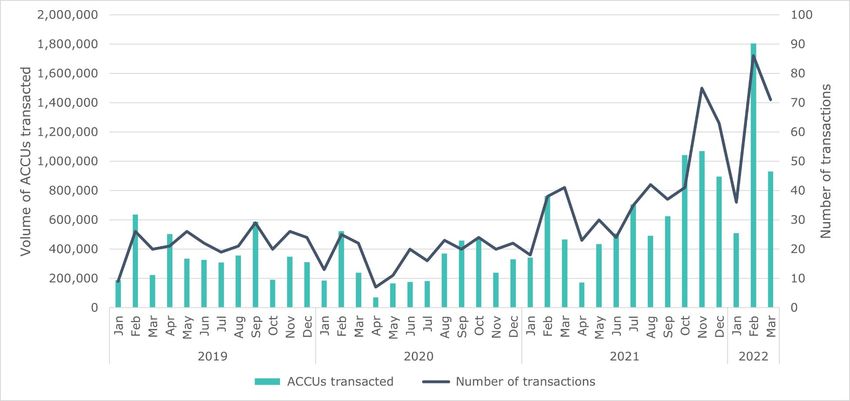
1. Australian carbon credit units

         Key messages
          •   283,000 ACCUs were voluntarily cancelled in Q1 2022, an increase of 62% on
              Q1 2021.
          •   At the 14th ERF Auction 7.6 million tonnes of carbon abatement was contracted
              for optional delivery at an average price of $17.35.
          •   There were 122 project registrations in the quarter, potentially delivering up to 34.9
              million tonnes of abatement over their project lifetime.
          •   ACCU transaction volumes in ANREU of 3.2 million set a new quarter record.

During Q1, there was significant public commentary on announced exit arrangements from
Commonwealth fixed delivery contract milestones. Analysis by some suggested that the market will be
flooded with ACCUs and the spot price could fall to around $24, inhibiting investment in new ERF
projects. This chapter presents analysis on the milestone exit arrangements and data on how the market
responded in Q1 2022 and more recently.

ACCU transactions and reported spot prices
Firstly, it is important to distinguish between spot ACCU transactions, including price and volume,
reported by a small number of intermediaries, and other over the counter (OTC) transactions where
there is no such reporting. Typically, price/volume reported spot trades are between 5 – 10% of all
transactions that occur in the ANREU Registry (see Figure 1.1). The increase in reported spot trade
volumes in February and March was marked by a small number of relatively large transactions.

Figure 1.1: ACCU spot market volumes against total ANREU transaction volume, January 2021 to
March 2022

                                                                                                       7
Intermediaries reporting such trades are providing important information to the market.The reported
ACCU spot price has moved across a very large range over the past year. Consequently, reported spot
prices may not be representative of all prices paid in the broader ACCU market. 4 Preliminary analysis by
the Clean Energy Regulator from the ANREU Registry for transactions between July 2021 and March
2022 shows total secondary market volume is, on average, 7 times larger than reported spot ACCU
volumes. 5

Figure 1.2 shows the reported spot ACCU price ran up very quickly over the second half of 2021 from
$19.75, reaching a peak of $57 on 24 January 2022. Several market analysts commented this was a result
of a lack of available supply in that part of the market. Following the announcement in relation to exit
arrangements for Commonwealth fixed delivery contract milestones, the reported spot price fell from
$47 to a weighted average price of $32.10. This was on the back of 18 reported transactions for a total of
345,000 ACCUs between 4 March and 27 April. From 12 March, reported spot trading in ACCUs slowed
with only 8 reported trades (accounting for 95,000 ACCUs) taking place between 12 March 2022 and 27
April 2022. However, on 5 May, 2 call options for 100,000 ACCUs each were reported at a strike price of
$35 with an upfront fee/premium (non-refundable) of $1.15 per ACCU for one transaction and $1.30 for
the other. Prices and volumes in the reported ACCU spot market increased in late May with generic
ACCUs trading at about $36 on 24 May and HIR ACCUs attracting a premium of up to $2 per unit.

The above analysis and figure 1.2 shows the reported ACCU spot price is still at a material premium to
prices prior to the start of the very steep price increase in the second half of 2021.

Figure 1.2: ACCU spot price, January 2020 to March 2022

Data sourced from Jarden and TFS Green

While the monthly transaction profile in Q1 2022 is consistent with that of previous years, with a peak in
February and a drop off in March (see Figure 1.3), the marked reduction in reported spot transactions in
the month from 12 March suggests the market may have been considering a range of factors impacting
supply, demand and price. These may have included matters such as likely take up of exit arrangements
for Commonwealth contract delivery milestones, reporting on claims made about some ERF methods
and potential Safeguard Mechanism changes. However, reported spot trading transactions and volume
picked up again from early May with prices still averaging approximately $30 per ACCU and two large
options trades reported at $35 plus the call option premium.

4   The broader ACCU market includes substantial volumes of non-reported secondary market transactions including through offtake agreements.
5
    As reported from Jarden and TFS Green
                                                                                                                                        8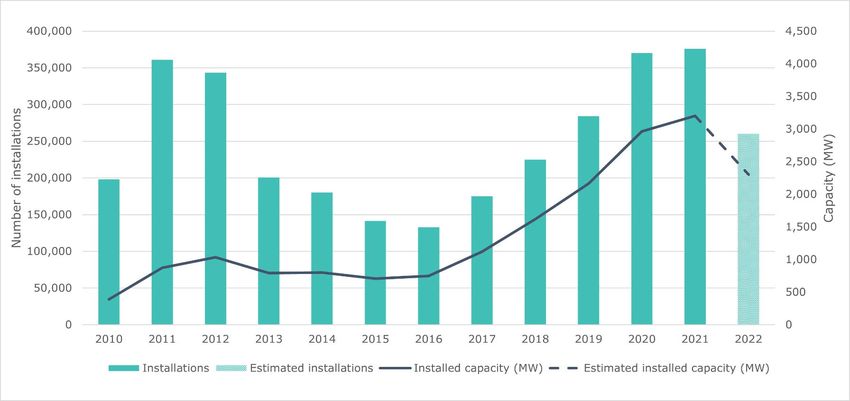
Figure 1.3: ACCU market transactions 6, January 2019 to March 2022

Commonwealth contract milestone exit arrangements
On 4 March 2022, the then Minister for Industry, Energy and Emissions Reduction announced changes to
ERF fixed delivery contract administration. Current holders of fixed delivery contracts will now be able to
pay an exit fee to be released from periodic fixed delivery obligations to the Commonwealth. Holders of
fixed delivery contracts can opt-in to this arrangement. The exit fee will be calculated by multiplying the
contract price by the quantity of ACCUs to be released. This is similar to existing contractual clauses for
Buyer’s Market Damages (BMD). The new initiative will allow fixed delivery contract holders to be
released from delivery obligations in a transparent and orderly process.

The divergence between the average fixed delivery contract price of $11.70 and reported spot ACCU
prices of about $50 had led to an unsustainable situation. Some fixed delivery contract holders were
seriously considering using the existing contract processes to sell ACCUs to others rather than delivering
against Commonwealth contract milestones. If this had happened, first movers may have had an initial
advantage and it would have been difficult for the market to determine how this may play out.

The new exit arrangements are transparent, administratively simpler and more orderly than Buyer’s
Market Damages (BMD) as they operate through 6 monthly application tranches. If approved, the
applicant must pay the exit fee to the Clean Energy Regulator, and forgo receiving the milestone
payment from the Clean Energy Regulator.

Parties with Commonwealth fixed delivery contracts continue to have the certainty of being able to
deliver to the Commonwealth at the contract price. Contract holders would need to successfully apply
and pay exit fees for milestones. Consequently, it is only commercially attractive for project proponents
to pay the contract price exit fee if they can achieve an alternative firm sales option for milestone
volumes. This would likely need to be at a commercial premium to double the contract price in their
contract with the Commonwealth to make it worthwhile.

The long-term average price of all Commonwealth fixed delivery contracts is $11.70 and the reported
spot price appears to have currently settled for the time being above $30 which is a premium above
double the average contract price. 7 However, it would appear to be commercially risky for project

6 ACCU market transactions refer to the transfer of ACCUs between separate entities or groups and does not include issuances and cancellations
of ACCUs. Transactions involving the transfer of ACCUs between project proponents, between project proponents and project developers, and
between accounts belonging to the same company and/or subsidiaries are excluded. Excludes ERF transactions.
7
  Note, there is a significant spread of fixed delivery contract prices.
                                                                                                                                          9
proponents to forgo the certainty of the Commonwealth contract price—and pay the exit fee—in the
hope of selling all the volume in the reported spot market at the recent prices. As outlined earlier,
relatively little volume is traded in that part of the market.
Typical commercial behaviour to manage financial risk would be to seek to enter into back-to-back
contracts. These contracts would allow them to sell the ACCUs to others that match milestone exit
applications made to the Clean Energy Regulator, where the negotiated price is at an acceptable
commercial premium (to more than double the Commonwealth contract price) to the seller. Some may
consider selling a portion into the reported spot market, but likely only if that spot price is at a sufficient
premium to any certain contract price that can be achieved through advance contracts with others.
The Clean Energy Regulator does not therefore expect the market to become flooded with ACCUs. If
project proponents are unable to achieve suitable alternative sales prices, it is likely they will deliver on
existing Commonwealth contract milestones. There is evidence of strongly increasing business demand
to use ACCUs to reduce net emissions, and it is expected this will be the key determinant of the uptake
of contract milestone exit applications.
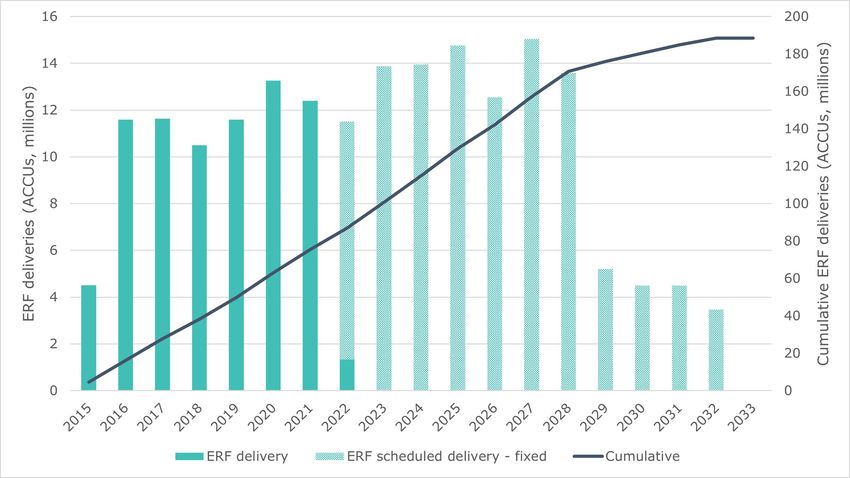
Figure 1.4 shows the maximum potential volume—up to approximately 11 million ACCUs—on which the
exit fee may be paid for the balance of the 2022 calendar year. The unknown question is, how much of
that volume will have the exit fee paid? It is reasonable to presume exit applications are more probable
for lower priced Commonwealth contract milestones than for higher priced ones. However, given typical
prudent commercial risk management and our analysis on spot trading, it seems unlikely that a
significant volume will be directed into the reported spot market.
The Clean Energy Regulator will provide information to the market before each exit window on potential
volume; as well as actual uptake once the window has closed and the outcomes are known. For the
delivery window ending 30 June 2022, outstanding potential delivery volume is 6.9 million ACCUs. The
announcement of the exit arrangements on 4 March 2022 included a statement that all delivery
milestones falling due from the date of the announcement to 30 June 2022 would be extended to 31
August 2022. This longer period allows industry to adjust and make necessary business arrangements.
Figure 1.4: Commonwealth delivery for current portfolio of projects, 2015 to 2033
It is the view of the Clean Energy Regulator that orderly Commonwealth milestone exit arrangements
will further the government stepping back from being the biggest demand side player to support and
assure the market. As the Clean Energy Regulator has offered optional delivery contracts since April
102020, business relationships are likely to have formed to facilitate alternative sales which could be
leveraged to underpin milestone exit applications.
Demand for ACCUs is growing quickly and may accelerate
Q1 2022 showed further clear evidence of an increase in voluntary cancellation of ACCUs with 283,000
cancelled, up 62% on Q1 2021. It looks likely that total cancellations for 2022 may exceed the 1.1 million
expectation the Clean Energy Regulator set in the Q4 report for 2021.
The majority of ACCU cancellations came from individual entities – comprising corporations and
organisations, such as universities that are included in the ‘Other’ category (see Figure 1.5). These
entities cancelled over 70% of the 283,000 ACCUs. A total of 51 entities cancelled ACCUs during Q1 2022,
with one-third cancelling ACCUs for the first time.
Figure 1.5: Voluntary private and state and territory government cancellation of ACCUs by reason for
cancellation, Q1 2019 to Q1 2022
These developments reflect a world-wide trend of corporations driving voluntary net emissions
reduction. An analysis by the Science Based Targets initiative found over 1,045 companies, representing
more than $23 trillion in market capitalisation, have responded to a call to decarbonise. 8
The Clean Energy Regulator has been informed by reliable sources there are many large entities looking
for the opportunity to contract large volumes of ACCUs. This is likely to have been influenced by reports
of very little available supply in the reported spot market and much of the ACCU supply already being
contracted to the Clean Energy Regulator (see Figure 1.4). The question is whether they will be prepared
to pay the price premium project proponents will want to make it worthwhile for them to apply in the
exit arrangements.
The potential scale of the demand side opportunity for ACCUs is further highlighted by Certified Emission
Reduction unit cancellations (CERs - international offset units) of 2.6 million units in Q1 2022, up from
1.6 million units in Q1 2021, an increase of 62% year on year. 9 Changes to Climate Active, and a review
8 Huusko H. (2021), Status Report: Business ambition for 1.5°C – Responding to the Climate Crisis, Science Based Targets Initiative in partnership
with the United Nations Global Compact.
9
For comparison, 12 million of these units were voluntarily cancelled in 2021.
11by the Climate Change Authority into the use of international units for domestic offsetting purposes,
may impact demand for ACCUs. The Clean Energy Regulator expects the Corporate Emissions Reduction
Transparency (CERT) report to also drive additional demand for ACCUs beyond the pilot year.
There has been media speculation that the contract milestone exit process, and the resultant reduction
in the reported spot ACCU price, will result in less investment in ERF projects. However, the data to date
does not support those claims.
The Clean Energy Regulator continues to register record numbers of projects, with 122 registered
projects in Q1 (see Figure 1.6). Soil carbon and vegetation projects continue to dominate new
registrations.
Figure 1.6: New registered projects per method type, Q1 2019 to Q1 2022
Auction 14 in early April resulted in 7.6 million units contracted — the highest volume since the 6th ERF
Auction held in December 2017 (see Figure 1.7). The volume contracted in this auction was 11% higher
than in Auction 13 and averaged a slightly higher price. New optional delivery contracts were awarded to
25 projects with a total value of $132 million and an average price of $17.35 (see Figure 1.7). This likely
represents the average price at which it is commercial to proceed with new low cost ERF projects. The
Clean Energy Regulator did not offer fixed delivery contracts at this auction. There has been declining
participation of new registrations coming to auctions, this may reflect a growing number of projects
intending to sell directly to private buyers.
12Figure 1.7: ERF Auction results, auctions 1 – 14
The reported ACCU spot price had been generally averaging in the low $30 range since the
announcement on contract milestone exit arrangements until it settled at just over $35 after 23 May
2022. This is a material premium to the most recent auction price and well above the $19.75 price in
mid-2021 when the price started its rapid run up.
On balance, the Clean Energy Regulator considers the evidence (including project registration numbers,
auction result, growing business demand and reported spot prices at a premium to the recent auction
price) points to strong incentives to proceed with new ERF projects.
Total ACCUs held in ANREU accounts increased by 1.4 million in Q1 – an increase of 12% on Q4 2021.
This increase has been driven mainly by an increase in holdings by project proponents, up 0.9 million
ACCUs (see Table 1.1 and Figure 1.8).
In contrast, total holdings in accounts of financial intermediaries only increased marginally, up 0.2 million
ACCUs this quarter.
ACCU issuances in Q1 2022 was 3.3 million (see table 1.1). The Clean Energy Regulator believes total
ACCU issuances for the 2022 calendar year will be over 18 million. After issuances, it is common to see
some transfers in ANREU from project proponents to intermediaries - potentially for sale including into
the reported spot price market segment. There has been a reduction in these transfer volumes since the
announcement of the exit arrangements which could be related to the one-month period where there
was a reduction in reported spot market trades.
Project proponents with milestone deliveries falling between 4 March and 30 June 2022 have until the
end of August 2022 to submit contract milestone exit applications for the first tranche. The volume on
which they choose to apply to pay to exit milestones (to contract to others and/or sell into the reported
spot market), versus delivering to the Clean Energy Regulator, will likely depend on the price they can
obtain contracting to others and any trend in the reported spot price.
13Figure 1.8: ACCU holdings by market participation, Q1 2018 to Q1 2022*
* The breakdown of accounts in ANREU is based on ACCU transaction characteristics of individual accounts. It is not a representation of
corporate entity characteristics. An entity controlling more than one account can be represented in the data in multiple categories.
Table 1.1: Balance of supply and demand Q1 2022 close
Balance/supply of ACCUs from Q4 2021 11,456,521
ACCUs issued Q1 2022 3,338,653
ERF contract deliveries -1,349,922
Safeguard cancellations 10 -250,809
Voluntary cancellations - 282,778
ACCU relinquishment 11 -661
Net balance at the end of Q1 2022 12,920,004
Within a specified period, supply of ACCUs refers to ACCUs issued. Demand of ACCUs incorporates Commonwealth ERF contract deliveries,
safeguard mechanism cancellations, relinquishments and state and territory government and private sector voluntary cancellation.
10 Safeguard mechanism cancellations do not include deemed cancellations. A ‘deemed’ cancellation occurs when ACCUs issued under an ERF
project at a safeguard facility, in a particular year, are delivered to the Commonwealth under an ERF contract.
11
For more information see here.
142. Large-scale generation certificates
Key messages
• 1.3 GW reaches FID in Q1 2022
o Total FID capacity for the last three quarters is 3.4 GW
• Voluntary cancellations are a record for Q1 of 1.2 million LGCs
• LGC supply and demand balance continues to look tight
Renewable investment trending up
Q1 2022 was the third consecutive quarter with more than 1 GW of proposed wind and solar power
stations reaching a FID. Given the strong start with 1.3 GW achieving a FID, and the probable projects
being tracked by the Clean Energy Regulator, capacity reaching FID in the 2022 calendar year may exceed
3 GW. If that eventuates, it will be the third consecutive year where FID capacity has increased year-on-
year.
The Clean Energy Regulator has always suggested caution in comparing quarterly data as these
commercial decisions can be ‘lumpy’. However, the Clean Energy Regulator notes substantial
momentum in announcements and believes a year-on-year increase in large scale investment is possible
given strong investment signals.
15Figure 2.1 below shows the capacity reaching FID broadly follows a similar trend to that for combined
electricity and LGC price signal. These 2 prices are once again suggesting a strong investment signal for
low-cost renewable energy, for example wind and large -scale solar. The trends in Figure 2.1 suggests the
Clean Energy Regulator’s estimate of 3 GW capacity reaching FID in this calendar year may be
conservative.
Figure 2.1: Final investment decision and electricity prices over time 12, 2009 to 2022
This graph suggests large-scale renewables industry investment has previously, and is currently,
responding to changing price signals:
• Wholesale electricity prices have been increasing, particularly in NSW and QLD, owing to a
number of factors including high electricity demand, generator outages and network
constraints. 13 Also, more recently owing to increasing coal and gas prices as a result of the war
on Ukraine.
• Forward wholesale electricity prices have been trending up, possibly responding to several
announcements of coal power plant closures being brought forward.
• LGC spot prices continue to be much higher than forward markets had predicted (refer to Figure
2.2) primarily because of large year on year growth in voluntary cancellations and ongoing
redemption of shortfall charge.
The spot LGC price finished Q1 at $48.00 per certificate or megawatt hour (MWh). In the context of the
cost of new build for wind and solar, this is still a material incentive in addition to wholesale electricity
prices. The RET still has more than 8.5 years until the scheme finishes at the end of 2030. However, the
proposed Guarantee of Origin scheme for hydrogen and renewable energy may, if legislated, provide a
Guarantee of Origin certificate for renewable energy beyond LGCs.
12 Price data sourced from OpenNEM, TFS Green
13
Wholesale Markets Quarterly Q4 2021, Australian Energy Regulator
16Figure 2.2: LGC spot and forward prices, January 2020 to March 2022
Data sourced from TFS Green
Downside risks to investment in large-scale renewables continues to be current grid constraints in the
short term and the ability to deliver grid upgrades as per the Australian Energy Market Operator’s
Integrated System Plan in the medium term. On the positive side, the Qld-NSW interconnector upgrade
project is nearing completion and a Vic-NSW interconnector upgrade is scheduled to be completed by
the end of the year. Construction also is soon to commence on Project EnergyConnect, a 900 km
electricity interconnector between SA and NSW which is expected to connect a number of proposed
renewable energy zones in both states.
Voluntary LGC demand continues to grow
The Clean Energy Regulator estimates generation eligible for LGCs in 2022 will be approximately 44,000
GWh – substantially higher than the annual target of 33,000 GWh. Despite this, the LGC price remains at
levels similar to those seen prior to the RET target being met.
In simple terms, LGC prices are being sustained by increasing voluntary demand. Voluntary cancellation
of LGCs to prove use of renewable electricity is ramping up materially. This is increasingly adding to the
legislated target. For example, 5.8 million LGCs were voluntarily cancelled in 2021, effectively adding
5,800 GWh to the 33,000 GWh statutory target.
There is no limit on voluntary cancellations and programs such as GreenPower, Climate Active and the
ACT government’s own legislation recognise the cancellation of LGCs to prove use of renewable
electricity. The Corporate Emissions Reduction Transparency report will also recognise voluntary
cancellations and should be a material source of LGC demand over the coming years.
Q1 typically sees the smallest volume of voluntary LGC cancellations (refer to Figure 2.3). The 1.2 million
LGCs cancelled in Q1 2022 is almost 4 times the previous Q1 record from 2021.
While this level of growth may not be sustained throughout this calendar year, demand from
GreenPower and individual renewable energy commitments is expected to see significant growth this
year. This will likely see voluntary cancellations in 2022 materially surpass the 5.8 million cancelled in
2021. The Clean Energy Regulator estimates a minimum of 8 million LGCs will be voluntarily cancelled in
2022, however it could be much higher. The level of voluntary demand growth will be an important
watch point for the rest of this year.
17Figure 2.3: Voluntary private and state and territory government demand for LGCs by reason for
cancellation, Q1 2019 to Q1 2022
The other factor at play in the LGC price is ongoing shortfall charge taken and expected shortfall charge
redemption (see table 2.1). There are still shortfall charges in consolidated revenue, equivalent to a total
of 16 million LGCs, that can be redeemed over coming years. This includes 5.4 million LGCs which are
required to be surrendered in 2022, or the right to redeem associated shortfall charge will be forfeited.
Given the commercial incentive to redeem the $65 shortfall charge paid (which is well above the current
spot price), LGCs are expected to be surrendered to redeem the shortfall charge.
Table 2.1 shows the LGC balance if no shortfall is taken for the 2022 assessment year based on an
estimated new supply of 44 million LGCs.
Table 2.1: Estimated LGC supply and demand balance in the 2022 assessment year
Supply Demand
LGCs available from previous assessment years +7.8 million -
2022 LGC supply (available for 2022 surrender) +44 million -
Legislated demand for 2022 - -32.6 million
Estimated shortfall charge refunds for 2022 - -5.4 million
Voluntary cancellations - -8 million
(minimum)
Estimated total balance for 2022 assessment year 5.8 million (maximum)
On the supply side, it was a strong Q1 with 10.2 million LGCs generated, an increase of 10.6% on Q1
2021. The growth in LGC supply is supported by the continued addition of new renewable power stations
into the grid. In Q1 2022, 34 power stations with a combined capacity of 293 MW were approved. Total
capacity approved for LGC generation in 2022 is expected to be approximately 2.5 GW, on par with 2021.
Considering all these factors, the supply/demand balance for LGCs may remain tight over the next
several years, potentially with some shortfall charge being used as a liquidity mechanism. Private
demand will continue to ramp up and support prices to remain higher than previous expectations by the
market. This provides an ongoing build signal for industry to bring on supply.
183. Small-scale technology certificates
Key messages
• Small-scale solar PV capacity installed is 28% lower than in Q1 2021, tracking to
2.3 GW for 2022 on current trends.
• 16.6 million STCs were surrendered on 28 April 2022, and material use of the STC
Clearing House was observed with 2.9 million regulator created certificates
purchased in the lead up to the Q1 surrender.
Following 5 consecutive years of growth, the rooftop solar PV market experienced a downturn in Q1
2022. Between 2016 and 2021, annual added capacity of rooftop solar averaged 35% year on year
growth, from 0.75 GW to 3.2 GW (see Figure 3.1). It has always been anticipated this growth would
eventually slow or decline. As rooftop solar PV is a consumer product, accurately predicting the turning
point was inherently challenging.
The Clean Energy Regulator estimates added installed capacity in 2022 will be approximately 2.3 GW if
the current monthly installation rate continues. This expected capacity is still higher than the pre-
pandemic period (see Figure 3.1).
Figure 3.1: Small-scale solar PV installations and installed capacity, 2010 to 2022
Demand side factors affect SRES installations
The boom in home improvements in the first 2 years of the pandemic may have brought forward
household investment in rooftop solar, leading to ongoing strong rooftop solar growth and delaying and
accentuating the turning point that is currently being observed. Other factors that may have contributed
to the Q1 decline include households choosing to spend discretionary spending on recreation and leisure
including holidays now that COVID-19 travel restrictions have been relaxed, cost of living pressures and a
prevailing view of future increases in interest rates. Also, feed in tariffs had been decreasing over the
past year.
19In the 12 months to February 2022, Australian Bureau of Statistics (ABS) data indicates the value of home
improvements decreased by 8.9% 14, while household expenditure on recreation and culture, and hotels,
cafes and restaurants increased by 17.8% and 15.6% respectively. 15 Figure 3.2 below illustrates that
rooftop solar PV installations appear to follow similar seasonal and overall trends to the value of home
improvements. The ABS data provides some evidence that the downturn in home improvements—
including rooftop solar PV—may represent a shift in consumer preferences as COVID-19 restrictions
eased.
Figure 3.2: Value of home improvements against small-scale solar PV installations 16, January 2016 to
February 2022
It is likely some households that may otherwise have waited to install systems, brought forward their
investment in rooftop solar as discretionary spending in other areas was reduced during 2020 and 2021.
This may be the major factor at play. This is supported by the deviation from the long run growth trends
experienced in 2020 and 2021. This was followed by a steep decline in the number of installations in
early 2022, as consumers switched spending to recreation activities from late 2021.
In addition to the shift in expenditure, broader economic indicators show Australian households are
facing a real increase in the cost of living which may also be contributing to the slow start for the small-
scale rooftop solar PV market in 2022. 17 Periods of extreme wet weather and installers isolating with
COVID-19 may have also had an impact.
Market intelligence suggests concerns about increasing input prices, component and labour shortages,
general supply chain issues and declining deeming periods, have not been key drivers of the declining
small-scale rooftop solar PV installations in Q1 2022. 18 The Clean Energy Regulator will continue
14 As measured by the total value of building jobs for private sector residential alterations and additions (not creating dwellings). Australian
Bureau of Statistics (2022) Building Approvals, Australia https://www.abs.gov.au/statistics/industry/building-and-construction/building-
approvals-australia/latest-release, accessed 19 April 2022.
15
Australian Bureau of Statistics (2022) Monthly Household Spending Indicator https://www.abs.gov.au/statistics/economy/finance/monthly-
household-spending-indicator/latest-release, accessed 19 April 2022.
16 Total value of private sector residential building jobs data sourced from Australian Bureau of Statistics
17 The Consumer Price Index (CPI) rose 3.5% in 2021 and further increases expected in 2022. As a measure of household inflation, the increase in
CPI implies an increase in the cost of living. Comparatively wages grew by 2.3% in 2021.
Reserve Bank of Australia (2022) Key Economic Indicators Snapshot, https://www.rba.gov.au/snapshots/economy-indicators-snapshot/,
accessed 20 April.
In May 2022 the Reserve Bank of Australia increased the cash rate target by 25 basis points to 35 basis points.
18 From 1 January 2022, small-scale systems were eligible for 10% fewer certificates than in 2021 due to the deeming period declining from 10 to
9 years.
20monitoring for potential market implications resulting from potential supply chain disruptions and
variable input costs.
The rooftop solar PV industry is competitive, innovative and resilient. Figure 3.3 shows the payback
period for an average 8 kW system is between 3 and 4 years depending on factors such as location and
electricity use – representing a very good return on investment for households and businesses. The
Clean Energy Regulator anticipates these factors will at some stage drive a return to growth, although
the precise timeframe is difficult to predict. If the prevailing narrative becomes that increasing wholesale
prices are flowing through to increased electricity bills, then that may become a consumer consideration
that moves the sector back to growth.
Figure 3.3: Payback period for an 8 kW solar PV system 19
Small-scale rooftop solar PV installations and installed capacity
Installed rooftop solar PV capacity for Q1 2022 is 561 MW, 28% below the 782 MW installed during the
same period in 2021. An estimated 68,250 rooftop solar PV systems with an average system size of 8.2
kW were installed in the quarter, a 31% reduction on nearly 99,000 systems installed in Q1 2021. In
comparison to pre-pandemic figures, installed rooftop solar PV capacity in Q1 2022 is 23% greater than
the 456 MW installed in Q1 2019, primarily driven by the increase in average system size during that
period. STC creations in Q1 2022 totalled 8.2 million, a 32% decrease from Q1 2021 driven by a reduction
in the number of system installations and the decline in the deeming period.
Based on current installation trends, the Clean Energy Regulator estimates approximately 2.3 GW of
additional rooftop solar PV capacity will be installed in 2022, above the 2.2 GW in 2019 but below the
installed capacity in 2020 and 2021. Installed capacity could be higher if the rate of installs increases
later in the year. Installation numbers are expected to grow across 2022 in line with longer term
quarterly growth rates, albeit off a lower base. As shown in Figure 3.4, smaller system sizes and fewer
installations are typical for Q1 with the largest system sizes and the greatest number of installations
typically occurring in Q4.
19
Data sourced from Solar Choice
21Figure 3.4: Small-scale solar PV number of installations and average system size, Q1 2016 to Q1 2022
Market impact of reduction in installations
As noted in the December 2021 Quarterly Carbon Market report, STC creations since the beginning of
2022 have declined markedly. This has resulted in insufficient STC creations in the quarter to meet Q1
2022 surrender requirements equal to 35% of the annual liability.
The STC Clearing House operates as the scheme liquidity mechanism to deal with unanticipated
downturns, such as this, by providing an alternative source of STCs for purchase by liable entities. Liable
entities surrendered 16.6 million STCs for the Q1 2022 surrender period, leading to a compliance rate of
99.8%. Q1 accounts for 35% of the total small-scale technology percentage (STP) for 2022. As predicted
in the Q4 2021 QCMR, the Clearing House was used in Q1 2022 in the lead up to the Q1 surrender on
28 April. Following the surrender, the Clearing House is in a deficit of 2.7 million STCs and 2.9 million
regulator created STCs have been sold. The Clearing House has not been in deficit to this magnitude
since 2017.
Over the quarter, the STC spot price increased from $38.95 to $39.90, approaching the Clearing House
price of $40 as the market anticipated material purchases through the Clearing House in the lead up to
the Q1 2022 surrender. The forward STC market shows future prices are slightly lower than the current
spot price, which reflects expectations about STC supply constraints potentially easing in line with the
lower quarterly liability obligations for the remainder of the year (25% or 11.9 million certificates in Q2
and Q3, and 15% or 7.2 million certificates for Q4).
While 2022 is off to a slower start, rooftop solar PV remains a good investment, with a 4-year average
payback period and new integrity reforms as reasons for optimism. The industry is very efficient and
competitive, and there is potential for consumer sentiment towards rooftop solar to pick up —
particularly if electricity bills increase. The Clean Energy Regulator will report on any change in trends in
future QCMRs.
224. International carbon units and certificates
International carbon unit spot prices fell across the board in the later part of Q1 2022, negating initial
gains made throughout January and February. New Zealand units (NZUs) were the only unit to close out
the quarter with gains on Q4 2021 prices (see Table 4.1 below).
European Union Allowances (EUA) fell sharply in late February as the distribution of the 2022 free
allocation coincided with the Russian invasion of Ukraine sparking fears of an energy crisis. This triggered
a sell-off by financial participants who do not have a compliance requirement, seeing prices fall 39%
from €95.07 in 12 days, before recovering €18.18 by the end of Q1 2022.
There has been a surge in voluntary cancellation of Certified Emission Reduction (CER) units with 2.6
million units cancelled in Q1 2022, a 65% increase on Q1 2021. This shows an increase in net emissions
reduction activity by entities with a preference for low-cost international units. As mentioned in Chapter
1, the Clean Energy Regulator believes there are a range of factors that may shift some CER demand to
ACCUs.
Table 4.1: International unit prices
Product Spot price Spot price Quarterly change Spot price
(31 Dec 2021) (31 Mar 2022) (31 Mar 2022)
Australian dollar
terms
European Union €80.65 €76.48 -€4.17 (-5.2%) $115.35
Allowances (EUA)
New Zealand Units NZ$68.50 20 NZ$76.00 NZ$7.50 (10.9%) $70.20
(NZU)
Korean Allowance ₩34,000 ₩22,700 -₩11,300 (-33.2%) $24.79
Units (KAU)
20
Price as at 23 December 2021 as this was the last published price date available in 2021.
23Glossary
Term Meaning
One Australian carbon credit unit represents one tonne of verified carbon
Australian carbon credit
dioxide equivalent abatement. ACCUs are created from eligible offsets
unit (ACCU)
projects and issued by the Clean Energy Regulator in accordance with
section 147 of the Carbon Credits (Carbon Farming Initiative) Act
2011 (CFI Act).
Transactions of ACCUs occur through the Australian National Registry of
Emissions Units (ANREU).
Australian National The registry in which all transactions of Australian carbon credit units
Registry of Emissions takes place. A seller must have an ANREU account to participate in the
Units (ANREU) Emissions Reduction Fund.
Baseline The baseline is the reference point against which an entity’s emissions or
electricity generation can be measured. A power station which generates
renewable energy in excess of their baseline can earn large-scale
generation certificates under the Renewable Energy (Electricity)
Regulations 2001. An entity with obligations under the safeguard
mechanism must keep its net emissions at or below its baseline.
Cal prices This is the forward trade price for large-scale generation certificates
traded for the calendar year it is referring to. For example, Cal24 is the
calendar year 2024.
Carbon abatement Carbon abatement refers to a reduction in atmospheric carbon dioxide
through emissions avoidance or carbon sequestration.
Certificate spot price Certificate spot price refers to the secondary market price for small-scale
technology certificates, large-scale generation certificates and ACCUs.
Climate Active Climate Active is a unique partnership between the Australian
Government and Australian businesses that enables voluntary climate
action. Climate Active certifies businesses that have credibly reached a
state of carbon neutrality by measuring, reducing and offsetting their
carbon emissions against the requirements of the Climate Active Carbon
Neutral Standard. Certification is available for organisations (in relation to
business operations), products and services, buildings, events and
precincts.
Emissions avoidance Emissions avoidance refers to projects that generate abatement by
reducing or avoiding greenhouse gas emissions which would otherwise
have occurred. For example, savanna fire management may reduce
carbon dioxide emissions by reducing the frequency and extent of late
dry season fires. Capturing and flaring landfill gases converts methane to
carbon dioxide, which has lower global warming potential than methane.
Emissions Reduction The Emissions Reduction Fund is a scheme where the Government
Fund (ERF) purchases the lowest cost abatement (in the form of Australian carbon
credit units) from a wide range of sources, providing an incentive to
businesses, households and landowners to proactively reduce their
emissions.
24Greenhouse gas Greenhouse gas emissions are gases which trap heat in the atmosphere,
emissions such as carbon dioxide (CO2), methane (CH4) and nitrous oxide (N2O).
Greenhouse gas emissions are measured as tonnes of carbon dioxide
equivalence (CO2-e). This means that the amount of a greenhouse gas
that a business emits is measured as an equivalent amount of carbon
dioxide, which has a global warming potential of one.
GreenPower GreenPower is the only voluntary government accredited program for
renewable energy in Australia. A joint initiative of the governments of the
Australian Capital Territory, New South Wales, South Australia, Victoria
and Tasmania, GreenPower guarantees that any GreenPower-accredited
energy sold by Australian energy retailers is renewably sourced.
National Greenhouse The National Greenhouse and Energy Reporting scheme is a single,
and Energy Reporting national framework for corporations to report on greenhouse gas
Scheme (NGER) emissions, energy use and energy production.
Optional delivery An optional delivery contract is an agreement that gives proponents the
contract right, but not the obligation, to sell up to a nominated quantity of ACCUs
to the Commonwealth at a fixed price. Under optional delivery contracts,
the Clean Energy Regulator is essentially underpinning the project with
project proponents retaining the flexibility to sell ACCUs on the
secondary market.
Project proponent A project proponent is an individual, a collective of individuals or an
organisation with the legal responsibility for running a project under the
ERF. This means they will hold the legal right to the project and will be
issued any ACCUs created from project activities.
Safeguard Surrender Safeguard surrender is the statutory obligation to surrender carbon units
above an entity’s baseline.
Secondary market The secondary market consists of financial institutions, traders, agents
and installers, parties that are involved in the buying and selling of
renewable energy certificates or ACCUs between private entities. For
example, the price of an ACCU on the secondary market is the price at
which private entities agree to trade ACCUs.
While the Clean Energy Regulator does not intervene in the secondary
market, the Clean Energy Regulator’s Renewable Energy Certificate
Registry facilitates transactions between parties.
Sequestration Sequestration refers to the capture and storage of carbon dioxide. It
typically refers to the absorption of carbon by ecosystems, including
oceans, soils and vegetation.
Small-scale technology A renewable energy certificate created by the owner of a small-scale
certificate system, or their installer, for the electricity generated or displaced by that
system. While the number of certificates that can be created per system
is based on several factors, including its geographical location, installation
date, and other factors, one certificate is typically equal to one megawatt
hour of eligible renewable electricity.
25List of acronyms and abbreviations
Abbreviation Term
ACCU Australian carbon credit unit
ANREU Australian National Registry of Emissions Units
CER Certified Emission Reduction Unit
CERT Corporate Emissions Reduction Transparency
ERF Emissions Reduction Fund
EUA European Union allowance unit
FID Final Investment Decision
GW Gigawatt
LGC Large-scale generation certificate
LRET Large-scale Renewable Energy Target
MW Megawatt
NGER National Greenhouse and Energy Reporting Act 2007
RPP Renewable Power Percentage
RET Renewable Energy Target
SRES Small-scale Renewable Energy Scheme
STC Small-scale technology certificate
STP Small-scale technology percentage
26You can also read


