Measurement, Reporting, and Verification of Methane Emissions from Natural Gas and LNG Trade
←
→
Page content transcription
If your browser does not render page correctly, please read the page content below
January 2022

December 2021

           Measurement, Reporting, and Verification
            of Methane Emissions from Natural Gas
                                   and LNG Trade:
               creating transparent and credible frameworks

                                                                GAS     ENERGY TRANSITION

                                                               CHINA    ENERGY TRANSITION

   OIES PAPER: ET06              Jonathan Stern, Distinguished Research Fellow, OIES

   OIES PAPER: ET06
                                             Anders Hove, Research Associate, OIES
The contents of this paper are the author’s sole responsibility. They do not
         necessarily represent the views of the Oxford Institute for Energy Studies or any of
                                                     its members.

                                                  Copyright © 2022
                                     Oxford Institute for Energy Studies
                                        (Registered Charity, No. 286084)

  This publication may be reproduced in part for educational or non-profit purposes without special
permission from the copyright holder, provided acknowledgment of the source is made. No use of this
  publication may be made for resale or for any other commercial purpose whatsoever without prior
                  permission in writing from the Oxford Institute for Energy Studies.

                                             ISBN 978-1-78467-191-4

         The contents of this paper are the author’s sole responsibility. They do not necessarily represent the views
                               of the Oxford Institute for Energy Studies or any of its Members.
                                                                                                                        i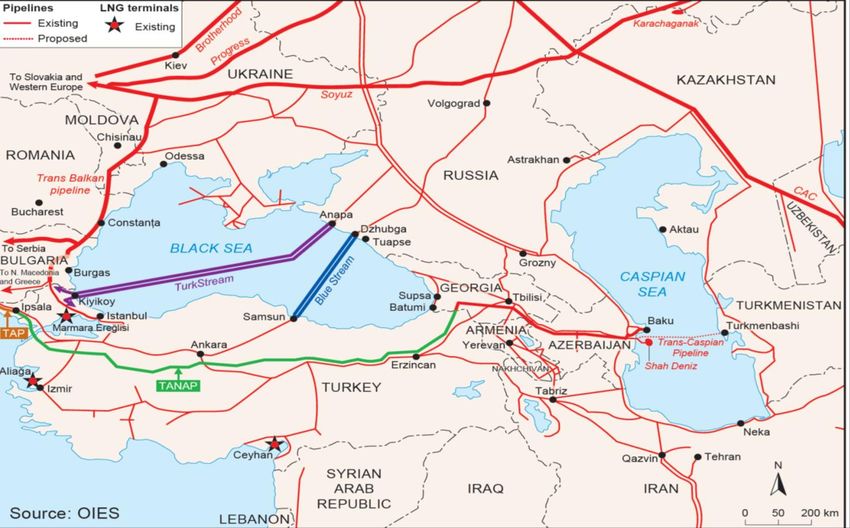
Preface
This paper builds on a body of work that Jonathan Stern has been developing on the topic of gas in a
decarbonising energy economy over the past five years. The theme of methane emissions, which is the
topic of this paper, has become a critical one as it has been used as a stick with which to challenge the
perceived environmental benefits of gas versus other hydrocarbons, especially coal. However, as
Professor Stern has pointed out on a number of occasions, providing an answer to the question of
whether methane emissions in the gas value chain are serious enough to undermine the potential role
of gas in the energy transition, especially as a bridge fuel to back up renewables in power generation,
relies on having accurate and credible data. As such, the measurement, reporting and verification of
methane emissions using a transparent and globally accepted methodology has become a crucial issue,
as highlighted by research from the IEA, the publication of an EU Methane Strategy and Regulation,
and the announcement of the Global Methane Pledge at COP26. Given the level of public scrutiny and
policy focus on this issue, it has become absolutely vital that the gas industry takes proactive steps to
create and implement a global plan both to reduce, but first to accurately document, methane emissions,
and in this paper Stern outlines the first steps being taken in this direction and assesses the progress
to date. He focuses on the major gas exporters to Europe and carbon neutral LNG as examples of the
challenges that are being faced, and examines the methodologies being developed by industry groups
and companies as they seek to establish a template for future reporting. Most importantly, though, he
underlines again the need for rapid action if the gas industry is to have a significant long-term future in
a decarbonising world and lays out recommendations for future action. He also establishes a platform
for future research by the Institute as part of its Energy Transition Research Initiative as we continue to
monitor and analyse this important topic.

James Henderson
Director, Energy Transition Research Initiative, OIES

          The contents of this paper are the author’s sole responsibility. They do not necessarily represent the views
                                of the Oxford Institute for Energy Studies or any of its Members.
                                                                                                                         ii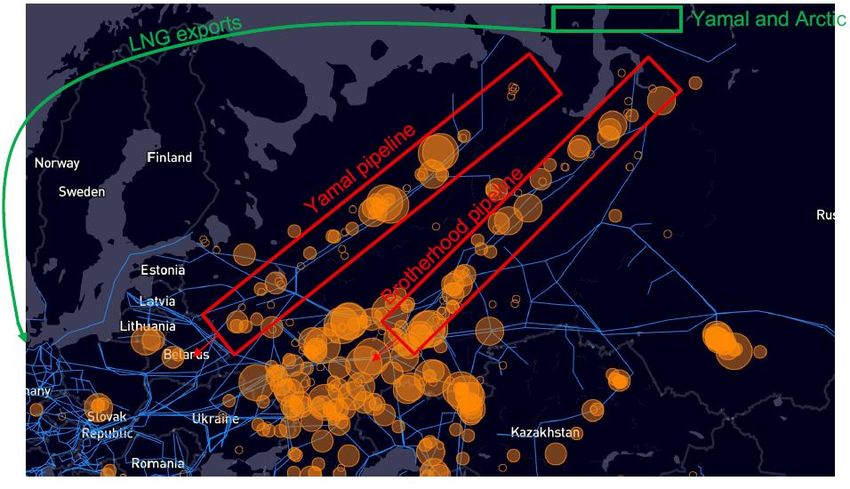
Acknowledgements
The following colleagues at the OIES have been kind enough to read through the text and make helpful
suggestions: Agnieszka Ason, James Henderson, Martin Lambert, David Ledesma, Michal Meidan and
Mostefa Ouki. Special thanks are due to Marshall Hall who spent a great deal of his time discussing the
subject with me, compiling statistics and alerting me to mistakes and gaps in the text.
Outside the OIES I am grateful to: Jean Bastin, Mark Davis, Fiji George, Christian Lelong and Selina
Roman-White for providing helpful comments and sources for many aspects of this extremely complex
subject. Thanks to Kayrros for providing Figures 7 and 8 and Table 6; and to John Hamilton at CBI
Publishing and African Energy for providing me with the Nigeria map.
Thanks to Catherine Gaunt for her stellar editing and Kate Teasdale who did everything else with her
customary good humour and efficiency.
I am solely responsible for all and any errors and omissions which remain, and all opinions and
interpretations.

         The contents of this paper are the author’s sole responsibility. They do not necessarily represent the views
                               of the Oxford Institute for Energy Studies or any of its Members.
                                                                                                                        iii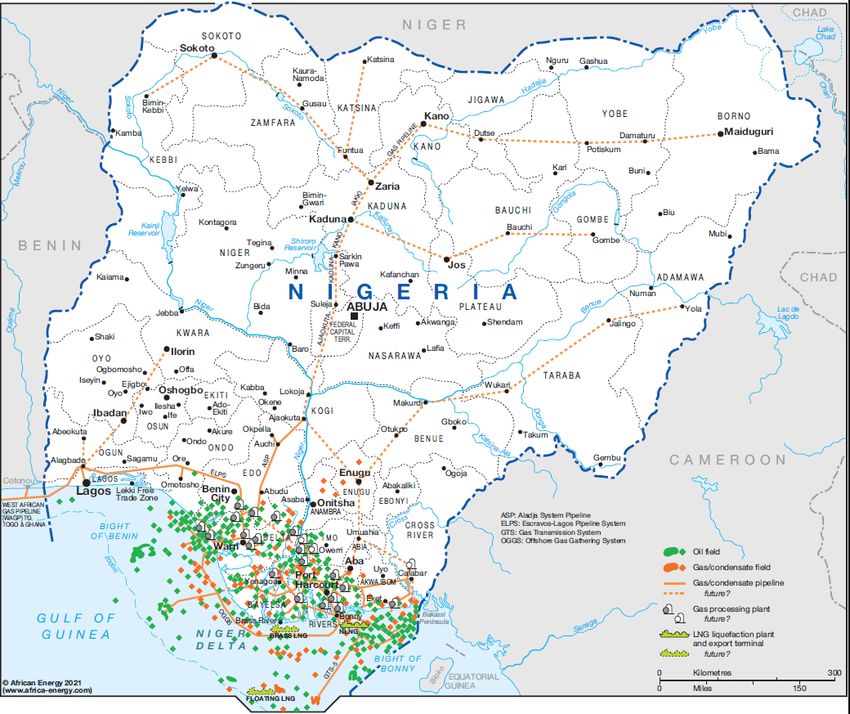
.
Contents
Preface .................................................................................................................................................... ii
Acknowledgements ................................................................................................................................ iii
Contents ................................................................................................................................................. iv
Figures .................................................................................................................................................... v
Tables...................................................................................................................................................... v
Maps........................................................................................................................................................ v
Summary and Conclusions ..................................................................................................................... 1
Recommendations .................................................................................................................................. 3
1. Introduction and rationale: ........................................................................................................... 4
Methane emissions – relevance and urgency..................................................................................... 5
The Global Methane Pledge ............................................................................................................... 6
Global warming potential (GWP) of methane relative to CO2 ............................................................. 6
Bottom-up and top-down measurements ............................................................................................ 7
Importance of the fossil fuel sector ..................................................................................................... 8
2. EU legal/regulatory frameworks – the start of a (long) journey ................................................ 9
The EU Methane Strategy and Proposed Regulation ....................................................................... 10
The carbon border adjustment mechanism (CBAM) ........................................................................ 12
Compatibility with international trade law .......................................................................................... 13
3. Public domain methane data for the six major external suppliers of gas to Europe ........... 13
UNFCCC and IEA data ..................................................................................................................... 14
Natural gas flaring efficiency ............................................................................................................. 15
4. Gas and LNG export supply chains of the six major gas and LNG major suppliers to Europe
16
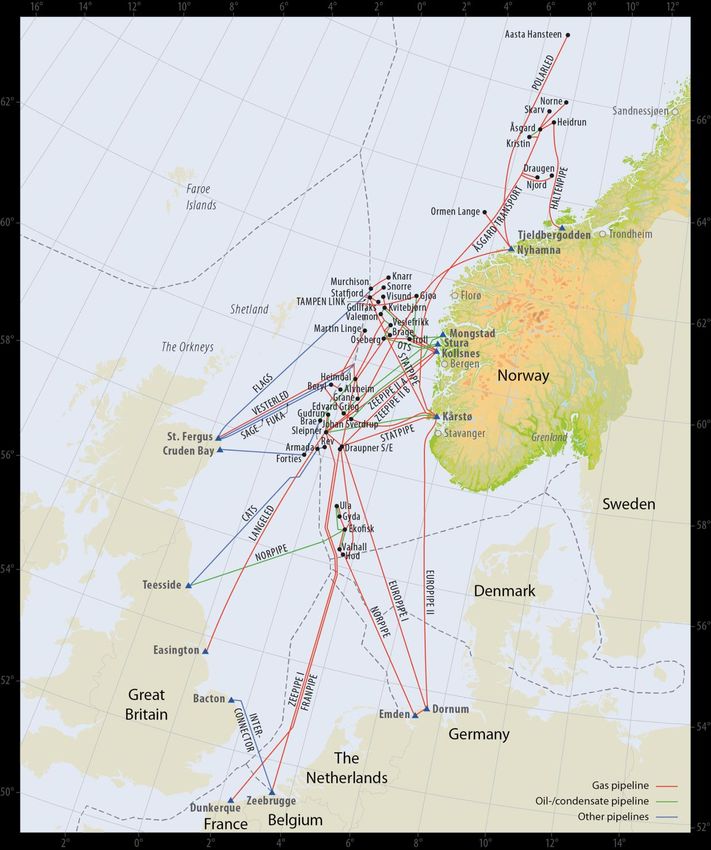
Norway .............................................................................................................................................. 17
Russian Federation ........................................................................................................................... 20
United States ..................................................................................................................................... 23
Algeria, Qatar and Nigeria................................................................................................................. 25
5. Carbon neutral and MRV methodologies for GHG emissions from global LNG trade ......... 30
Carbon-neutral LNG .......................................................................................................................... 30
The Statement of Greenhouse Gas Emissions (SGE) Methodology ................................................ 32
The GIIGNL MRV and GHG-Neutral LNG Framework ..................................................................... 33
Emissions from Cheniere’s LNG exports .......................................................................................... 34
6. The IMEO and OGMP Version 2.0: consolidated reporting, confidentiality, and verification
36
The International Methane Emissions Observatory (IMEO) ............................................................. 36
The problem of confidentiality ........................................................................................................... 37
Verification, certification and assurance ........................................................................................... 38
Bibliography .......................................................................................................................................... 40
7. Appendices ................................................................................................................................... 47
Appendix 1: The Global Warming Potential (GWP) of methane relative to CO 2 over different time
horizons ............................................................................................................................................. 47
Appendix 2. Methane emissions – natural and anthropogenic sources and measurement methods
.......................................................................................................................................................... 48
Appendix 3: ANNEX VIII of the proposed EU Methane Regulation - Information to be Provided by
Importers ........................................................................................................................................... 50
Appendix 4: Methane emissions data from UNFCCC submissions for the United States, the
Russian Federation, and Norway for the period 2010–2019 ............................................................ 51
Appendix 5: Gazprom and Novatek GHG Emissions ....................................................................... 53
Appendix 6: The BEIS/DEFRA methodology for estimating methane emissions ............................. 55
The contents of this paper are the author’s sole responsibility. They do not necessarily represent the views
of the Oxford Institute for Energy Studies or any of its Members.
iv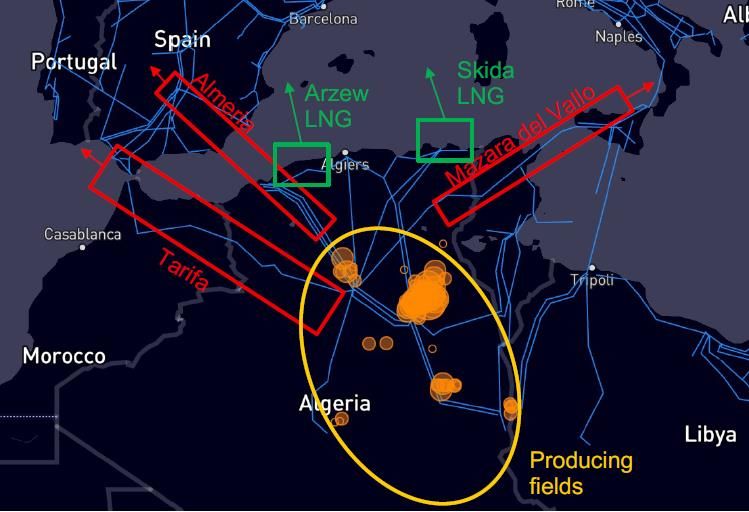
Figures
Figure 1: Global monthly mean atmospheric methane levels 1980–2021 .............................................. 5
Figure 2: Annual trend in atmospheric methane concentrations 1980–2020 ........................................ 5
Figure 3: Methane emissions from coal, oil, and natural gas in the IEA Net Zero Scenario .................. 8
Figure 4: Methane abatement cost curve for policies in committed* countries 2020 ............................. 9
Figure 5: Methane emissions associated with imported oil and gas to selected countries, 2020 ........ 16
Figure 6: Natural gas exports to Europe and upstream oil and gas methane intensity of the six major
European gas suppliers ........................................................................................................................ 17
Figure 7: Satellite observations of methane emissions from Russian gas pipelines and LNG terminals
2019–2020 ............................................................................................................................................ 23
Figure 8: Satellite observations of methane emissions from Algerian gas fields .................................. 28

Tables
Table 1: European pipeline gas and LNG imports (2020) bcm ............................................................. 14
Table 2: Pipeline gas and LNG exporting companies which were the largest suppliers to Europe in
2020 ...................................................................................................................................................... 14
Table 3: Methane emissions of six major natural gas and LNG exporters to Europe, 2020 (thousand
tons) ...................................................................................................................................................... 15
Table 4: Flared volumes from major gas exporters to Europe 2016–2020* (bcm) ............................... 16
Table 5: Emissions from Norwegian upstream oil and gas extraction (mtCO 2e) .................................. 18
Table 6: Methane emissions and intensity from satellite observations of three major US oil and gas
producing basins (average 2019–2020) ............................................................................................... 24
Table 7: Gas production and losses from Algeria, Qatar, and Nigeria, 2015–2020 (bcm) ................... 26
Table 8: Methane emissions and flaring from Qatari LNG operations .................................................. 29
Table 9. Carbon-neutral LNG cargos, 2019–October 2021 .................................................................. 31
Table 10: Global Methane Emissions by Source (TgCH4/year) ........................................................... 48
Table 11: Proportion of Methane Emissions Attributed to Natural and Anthropogenic, and Different
Anthropogenic Sources ......................................................................................................................... 49
Table 12: UNFCCC Methane Emissions Submissions from the US, Russia and Norway, 2010-19
(thousand tons of methane) .................................................................................................................. 52
Table 13: PJSC Gazprom Emissions by type of activity (mt CO2e) ...................................................... 53

Maps
Map 1: Norwegian gas pipeline routes to continental Europe and the UK ........................................... 18
Map 2: Russian gas pipelines to north-west Europe ............................................................................ 21
Map 3: Russian gas pipelines to southern Europe and Turkey ............................................................ 22
Map 4: Algerian gas fields, pipelines, and LNG plants ......................................................................... 27
Map 5: Nigerian oil and gas fields, pipeline and LNG plants ................................................................ 30

               The contents of this paper are the author’s sole responsibility. They do not necessarily represent the views
                                     of the Oxford Institute for Energy Studies or any of its Members.
                                                                                                                                                             v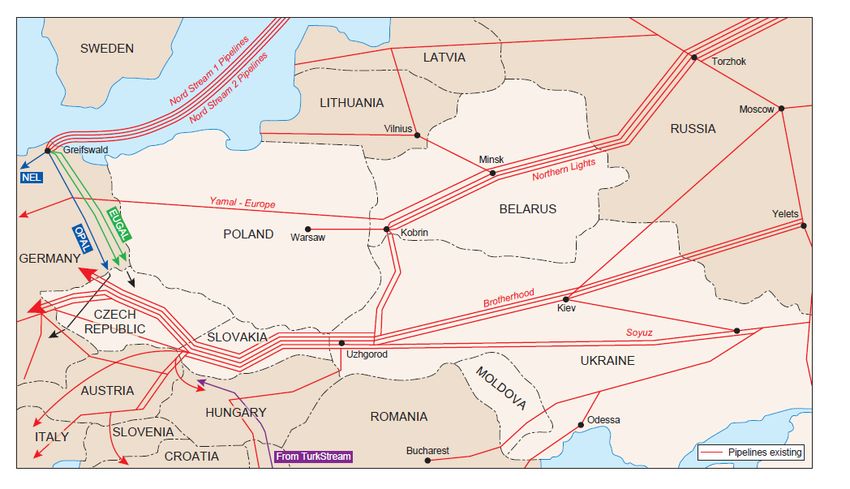
Summary and Conclusions
The Global Methane Pledge to reduce emissions by at least 30 per cent by 2030, signed by more than
100 countries at the COP26 Conference in November 2021, moved methane on to the global political
agenda and gave it a much sharper public focus. Atmospheric concentrations of methane are rising
much faster than those of carbon dioxide, and it is a much more powerful greenhouse gas.
Urgency
Urgency to reduce methane emissions from fossil fuels by at least 75 per cent by 2030 (relative to 2020)
has been recognized and recommended by both UNEP’s Climate and Clean Air Coalition and the
International Energy Agency as an essential contribution towards achieving net zero global energy
emissions by 2050, and as the fastest and lowest-cost means of reducing the rate of climate warming.
The EU Methane Strategy proposed the establishment of a methane intensity standard for domestically
produced and imported fossil fuels, with an initial focus on emissions from natural gas and LNG imports.
However, in the proposed EU Regulation, the intensity standard was replaced by an obligation on
importers to provide information for the establishment of a methane transparency database. Not until
the end of 2025 will the EU have gathered sufficient data on emissions to develop a methane standard
which endangers the 2030 targets for reducing emissions; and dictates that methane emission
frameworks need to be negotiated on a much shorter time scale.
Measurement Reporting and Verification (MRV) of data
MRV of emissions from imported gas and LNG are best divided into three supply chain segments:
     • From production (upstream) to the border of the exporting country.
     • From the border of the exporting country to the border of the importing country.
     • Emissions from within the importing country.
It should be expected that emissions from each of these segments will change over time with changes
in: the sources of production, supply routes (especially for LNG), and end-uses of gas in the energy
balance of importing countries.
Three major requirements for creating credible MRV of emissions are:
     • to move measurement and reporting of methane emissions from standard factors – either
         engineering-based or from US EPA data – to empirical (Tier 3) measurements, and to reconcile
         bottom-up (ground level) and top-down (satellite/aircraft/drone) observations.
     • to ensure that data measurement and reporting has been verified and certified by accredited
         bodies.
     • to require asset-level emissions data to be transparent and publicly available. Failure to do so
         on grounds of ‘commercial confidentiality’ risks being interpreted as evidence that the data is
         not credible.
The International Methane Emissions Observatory (IMEO), has been given the tasks of collecting,
collating, and publishing data submitted by companies from both the EU transparency database and
the Oil and Gas Methane Partnership Version 2.0 (OGMP2) framework, recognized by the EU as the
‘gold standard’ for MRV of methane emissions. The European Commission and the IMEO are proposing
to develop and publish a Methane Supply Index from the data which is collected, but for this to allow
meaningful comparisons all the major companies involved in exporting gas and LNG to Europe would
need to report emissions on a similar basis to OGMP2 which currently has very few members outside
Europe.
Data sources and export supply chains
The UNFCCC and the IEA are major sources of public domain data on methane emissions for the six
most important exporters of pipeline gas and LNG to Europe. Submissions to the UNFCCC database
are not compiled using common methodologies, and data for non-Annex 1 countries are not up to date.
The IEA Methane Tracker has current data which is regularly updated using a consistent (but not
entirely transparent) methodology. Data from the Tracker and from companies and governments show
that Norway has very low emissions, Nigeria and Algeria have the highest emissions; with the US,
Russia, and Qatar being somewhere in between. Detailed examination of individual natural gas and

  The contents of this paper are the authors’ sole responsibility. They do not necessarily represent the views   1
                        of the Oxford Institute for Energy Studies or any of its Members.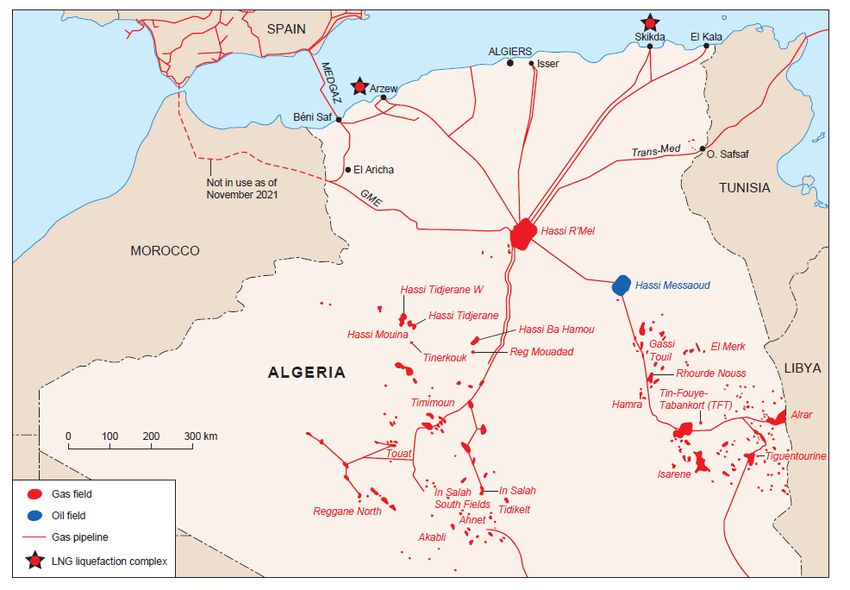
LNG export supply chains for these six most important suppliers to Europe shows how Norway has
progressed MRV and reduced emissions to a much greater extent than other exporters. Complexity of
US LNG export supply chains contrasts with the relative simplicity of Qatari chains. For Russian exports,
the focus is on Gazprom’s long transmission pipelines, while Algerian and Nigerian companies are only
just beginning to address these issues.
Emissions from specific pipeline gas and LNG supply chains
MRV agreements and emission values with each exporting company, based on the specific
characteristics of its export supply chain, need to be established. There will need to be multiple values
based on different LNG and pipeline export supply chains. Buyers will need to establish these values
with exporting companies and, in the case of state-owned companies, possibly also with governments.
In four out of the six major suppliers to Europe, co-mingling of gas before it reaches the border of the
exporting country makes it impossible to trace exported molecules back to the point of production. Qatar
and Russia are the only countries where this may be possible for at least some routes. For Norway,
Algeria, Nigeria and the US, assumptions will need to be made on averages of emissions arriving at
their borders prior to onward pipeline transportation or loading on to an LNG tanker. MRV of emissions
from onward pipeline and LNG transportation will provide a total value for emissions at the border of
the importing country. Emissions from within the importing country are best determined by gas and LNG
buyers and their regulator(s).
Taxes, prices and the GWP coefficient
How these emission values are used to determine taxes and prices for imported gas and LNG will
depend on greenhouse gas legislation and regulation in the importing country. Elements of the EU’s
proposed Carbon Border Adjustment Mechanism may provide a useful template. If methane charges
are to be based on CO2 prices the global warming potential (GWP) coefficient, for conversion of
methane into CO2 equivalent, will be a key consideration for governments with 2050 GHG reduction
commitments. Shortening the time horizon for the GWP of methane from 100 to 20-30 years would
result in a 2-3-fold increase in CO2 equivalent.
Asia and imports of `carbon neutral’ LNG
The urgency for buyers of natural gas and LNG to provide credible MRV of emissions from imports to
Europe – the largest gas importing region with the most climate-sensitive policies - is likely to spread to
other major gas and particularly Asian LNG importing countries as it becomes increasingly necessary
for companies and governments to account precisely for their emissions. In this context, ‘carbon-neutral’
LNG cargos are a highly problematic construct, lacking in transparency and therefore in environmental
credibility. The term `carbon neutral’ needs to be replaced by `greenhouse gas verified’ LNG. The SGE
and GIIGNL methodologies, and the study of Cheniere’s 2018 cargos combined with the company’s
commitment to provide individual cargo emission tags from 2022, are important milestones in the
creation of frameworks for establishing global LNG supply chain emission values. Any claim to carbon
or (more precisely) GHG neutrality requires transparent MRV of individual cargo emissions matched
with an equally transparent and equivalent offset.
Relevance for the future of natural gas, LNG and all fossil fuel trade
Although this study has focused on natural gas and LNG, the same argument can be made for
emissions from imported oil and coal, with methane emissions from oil imports as important as (and in
many countries more important than) those from pipeline gas and LNG. With increasing international
and civil society pressures on governments and companies to accelerate fossil fuel phase-out,
transparent MRV of methane emissions has become a non-negotiable requirement for traded fossil
fuels. A lack of this information undermines claims that natural gas and LNG can play a significant
ongoing role in the low-carbon energy transition. There are significant obstacles to agreement of
enforceable legal and regulatory MRV frameworks, even on a bilateral (let alone a global) basis. This
paper has described the start of a journey to create credible and transparent documentation of methane
emissions from natural gas trade, and emissions of all GHGs from LNG trade. But the longer that the
international gas community takes to put transparent MRV frameworks in place, the greater the
likelihood this will be construed as either reluctance or inability to reduce emissions, and that countries
will adopt alternative energy options.

          The contents of this paper are the author’s sole responsibility. They do not necessarily represent the views
                                of the Oxford Institute for Energy Studies or any of its Members.
                                                                                                                         2
Recommendations
Methane emissions:
1. Standardized methodologies and procedures for empirical measurement, reporting, and
verification (MRV) of methane emissions from internationally traded gas and LNG should be
agreed as soon as possible, ideally by the end of 2022, between European buyers and their
natural gas and LNG suppliers and endorsed by governments and the European Commission.
Longer time scales will mean that the 2030 methane reduction targets cannot be achieved.
Buyers of global LNG will need to adopt similar frameworks and time scales.
2. Negotiations on MRV of emissions between European buyers and governments, and their
counterparts in exporting countries, should focus on persuasion combined with technical and
financial assistance. Attempts to impose (what may be seen as) arbitrary standards are likely
to result in prolonged international legal/regulatory disputes.
3. Corporate responsibilities for MRV of methane emissions should be established for three
different segments of export supply chains: the wellhead to the border of the exporting country,
the border of the exporting country to the border of the importing country, within the importing
country.
4. Methane emissions values – in absolute terms and intensity per unit of supply – should be
stated for the different segments and assets of export supply chains, setting out how these
values were calculated. These values should be transparent and publicly available; disclosures
of partial or generalized data on grounds of confidentiality risk being dismissed as ‘greenwash’.
5. Importing governments need to take a position on the most appropriate time horizon, and hence
global warming potential (GWP) coefficient, for conversion of methane into CO 2 equivalent,
especially if charges for methane emissions are related to those of CO 2. The adoption of COP21
and net zero GHG reduction targets for 2050 calls into question the continued use of a GWP
with a 100-year time horizon.
Emissions from LNG trade:
1. The term ‘Carbon Neutral LNG’ is a misnomer and should be replaced by: ‘Greenhouse Gas
Verified LNG Cargo’ which should provide a transparent GHG content for the cargo (subject to
approved MRV procedures) delivered to the regasification terminal of the importing country.
2. Any offset of emissions based on the GHG content of an individual cargo of LNG should be a
separate and transparent transaction, verified by accredited bodies.
The contents of this paper are the author’s sole responsibility. They do not necessarily represent the views
of the Oxford Institute for Energy Studies or any of its Members.
31. Introduction and rationale:
This paper is based on a proposition that companies selling any fossil fuel – either domestically or
internationally – need to provide an accurate and verifiable estimate of the greenhouse gas (GHG)
emissions footprint of the fuel. Governments and regulators, but also end-consumers, will increasingly
demand transparent and credible estimates of GHG emissions of the fuels and energy from both
domestic and imported sources. The lower the emissions of an energy source, the more desirable and
valuable it will become in a decarbonizing world. This may be particularly relevant for internationally
traded fossil fuels delivered to countries with stringent GHG reduction targets such as European Union
(EU) member states. This paper focuses on a limited subset of these issues: the measurement and
regulation of methane emissions from internationally traded gas with a dual focus on European imports
and global LNG trade.1
In the early years of the energy transition, natural gas and LNG were hailed by some as a potential
‘bridge fuel’ which could play a substantial role due to lower combustion emissions relative to other
fossil fuels and particularly coal. More recently, an increasing focus on methane emissions from gas
and LNG has cast doubt on the advantages of gas as a transition fuel, both in general and in relation
to other energy options, and has led to assertions that fossil natural gas must be phased out because
it cannot decarbonize.2 While a net zero world eventually requires the vast majority of unabated natural
gas to be phased out, the speed of the phase-out could depend significantly on whether emission
reductions can be accurately measured and credibly verified.
Credibility will require a detailed account of how emissions are measured (namely, which methodologies
are used), how they are reported, and whether they have been verified by an independent accredited
technical body or regulatory authority. This will require tracing the methane molecules from the point of
sale to the point of production, including emissions from the three segments of the supply chain: from
production (upstream) to the border of the exporting country; from the border of the exporting country
to the border of the importing country; emissions from within the importing country after the pipeline gas
or LNG has been delivered to the border.3
This study is a continuation of a previous paper published at the end of 2020. 4 Its purpose is to look at
how measurement, reporting, and verification (MRV) of methane emissions frameworks need to evolve
in relation to international gas and LNG trade. Transparency, and hence credibility, of these frameworks
will be crucial to the future of international gas and LNG trade.
The paper is organized in six sections: this first outlines the extent, relevance, and urgency of the
methane emissions problem. The second deals with emerging and proposed European Union
regulatory frameworks. Sections 3 and 4 cover public domain data and assessments of emissions from
the export supply chains of the six major suppliers of pipeline gas and LNG to Europe. The following
section widens the discussion beyond Europe and beyond methane, to look at the development of
carbon-neutral LNG cargos, and an overview of frameworks for MRV of greenhouse gas emissions
from global LNG supply chains. Section 6 reverts to the focus on methane, describing the functions of
the International Methane Emissions Observatory (IMEO), the Oil and Gas Methane Partnership’s
Version 2.0 framework and issues of confidentiality, certification and assurance.
1
This is not to suggest that carbon dioxide emissions from natural gas and LNG trade are unimportant; nitrous oxide is also an
important greenhouse gas but is a relatively small contributor to emissions from natural gas export supply chains. For some
countries, methane emissions from oil and coal trade could be as, or more, important than those from natural gas trade.
2
For an academic exposition of this view see Von Hirschausen et al. (2021).
3
This paper refers to ‘segments’ (rather than stages, boundaries, or scopes) of the export supply (not value) chain. This is to
clarify the location of the physical assets from which MRV of emissions needs to be carried out, and therefore the corporate
bodies and regulatory authorities which have responsibilities for those functions.
4
Stern (2020).
The contents of this paper are the author’s sole responsibility. They do not necessarily represent the views
of the Oxford Institute for Energy Studies or any of its Members.
4Methane emissions – relevance and urgency
Greater attention is being paid to methane (CH4) emissions from all sources (natural and
anthropogenic) because over the past decade atmospheric concentrations have been increasing much
faster than previously, and in 2020 at the fastest rate since records began in the 1980s (Figures 1 and
2). The IPCC’s 6th Assessment Report, published in 2021, stated that: 5
‘From a physical science perspective, limiting human-induced global warming to a specific level
requires limiting cumulative COP2 emissions, reaching at least net zero CO 2 emissions, along
with strong reductions in other greenhouse gas emissions. Strong, rapid and sustained CH4
reductions would also limit the warming effect resulting from declining aerosol pollution and
would improve air quality.’
Figure 1: Global monthly mean atmospheric methane levels 1980–2021
Source: NOAA (2021).
Figure 2: Annual trend in atmospheric methane concentrations 1980–2020
Source: NOAA (2021).
5
IPCC (2021): Summary for Policy Makers, p. SPM-36.
The contents of this paper are the author’s sole responsibility. They do not necessarily represent the views
of the Oxford Institute for Energy Studies or any of its Members.
5Attention has become focused on methane because of the urgency to implement measures by 2030
which could reduce the warming impact of GHG over the next several decades. Methane is the second-
largest contributor to warming after carbon dioxide and by far the biggest contributor of the non-CO2
gases.6 Recent research has concluded that:
‘ … while the potential to reduce methane emissions with existing mitigation methods varies
considerably by sector, if deployed in parallel can cut expected 2030 methane emissions in
half, with a quarter at no net cost. We find that full deployment of these available mitigation
measures by 2030 can slow the global-mean warming over the next few decades by more than
25 per cent, while preventing around a quarter of a degree (centigrade) of additional global-
mean warming in 2050 and half a degree (centigrade) in 2100. On the other hand, slow or
delayed methane action leads to a 5 per cent or nearly 20 per cent increase in global-mean
rate from 2030 to 2050 relative to fast action, respectively.’ 7
The Global Methane Pledge
The relevance and urgency of methane action is reflected in growing attention from governments. In
September 2021, the US, EU, and seven additional countries committed to a Global Methane Pledge. 8
Two months later at COP26, the Pledge was launched announcing: 9
‘… a collective effort to reduce global methane emissions by at least 30 percent from 2020
levels by 2030 which could eliminate over 0.2 degrees C warming by 2050. Participants also
commit to moving towards using the highest tier IPCC good practice inventory methodologies,
as well as working to continuously improve the accuracy, transparency, consistency,
comparability, and completeness of national greenhouse gas inventory reporting … and to
provide greater transparency in key sectors.’
By the end of 2021 the Pledge had 111 country signatories.10 Also at COP26 the US and China signed
a Declaration on Enhancing Climate Action with specific emphasis on cooperating:
‘ … to develop additional measures to enhance methane emission control, at both the national
and sub-national levels. In addition to its recently communicated NDC, China intends to develop
a comprehensive and ambitious National Action Plan on methane, aiming to achieve a
significant effect on methane emissions control and reductions in the 2020s.’ 11
Despite this Declaration, China did not sign the Global Pledge, possibly due to the high methane
emissions from its coal sector which could be a focus of future US–China cooperation.12 Nevertheless
the IEA considers China a ‘committed country’ with respect to methane reduction, due to the Chinese
Oil and Gas Methane Alliance.13
Global warming potential (GWP) of methane relative to CO2
A major analytical and policy issue impacting how methane emissions are reported concerns how to
translate methane emissions into carbon dioxide equivalent. Methane is a much more potent
greenhouse gas than carbon dioxide, although it has a much shorter atmospheric life. Emissions are
very often reported in terms of carbon dioxide equivalent (CO 2e), which requires an assessment of the
global warming potential (GWP) of methane. The most usual metrics are that the radiative forcing
6
Ibid, Figure SPM.2, p.SPM-8.
7
Ocko et al. (2021).
8
White House (2021).
9
Full details of the Pledge can be found at https://www.globalmethanepledge.org/.
10
Including the EU and the Federated States of Micronesia. Notable important gas importing and exporting countries absent
from the list of signatories were: China, India, Russia, Qatar, Australia, Algeria, Egypt, Azerbaijan, and Turkmenistan. The
Pledge also has 24 Supporters including: CCAC, EBRD, GMI, IEA, UNEP and 19 Foundations and Philanthropies.
11
US State Department (2021).
12
China is by far the largest global emitter of coal mine methane. IEA (2021), Figure 4.1, p.48.
13
Ibid, p.22 and 40.
The contents of this paper are the author’s sole responsibility. They do not necessarily represent the views
of the Oxford Institute for Energy Studies or any of its Members.
6impact of methane is 28–36 times that of CO2 measured over a 100–year time horizon, and 84–87 times
over a 20-year horizon.14
IPCC Assessment Reports progressively raised the GWP for methane to 28 over a 100-year, and 84
over a 20-year, horizon in Assessment Report (AR) 5 published in 2014; but adding climate feedback
mechanisms and oxidation, these figures increase to 36 and 87. 15 AR6, published in 2021, raised the
GWP of methane to 29.8 over a 100-year horizon but seems to have reduced the 20-year horizon factor
to 82.5.16 With the adoption of COP 21 (Paris), and particularly of net zero, targets for 2050 there is a
convincing case for taking a 20–30-year, rather than a 100-year horizon. The original agreement by the
Conference of Parties (COP) did not rule out the use of shorter horizons, but 100 years is the standard
which is near-universally used by governments and companies, many of which are also still using a
GWP of 25 from AR4.17 More details on GWP metrics can be found in Appendix 1.
As targets for GHG emission reductions and carbon budgets become increasingly stringent for
governments and companies, the selection of the GWP time horizon becomes more crucial. 18 Using a
time horizon of 2050 would produce a 2 to 3-fold increase in CO2 equivalent emissions for methane
compared with a 100-year horizon, and would substantially impact emission calculations and therefore
the achievement of targets. GWP is the tip of a very large ‘data iceberg’ of methane analysis, the next
layer of which is the different methods of measurement.
Bottom-up and top-down measurements
Appendix 2 shows estimates of global natural and anthropogenic emissions. These are measured by
two methods – bottom-up (ground-level) and top-down (aerial), each of which has its own drawbacks
and limitations, and neither of which can be regarded as ‘correct’. 19 However, if they are reconciled for
location and time using facility-specific operational data, the ultimate result will be as accurate as
possible with current technology. Differences between bottom-up and top-down estimates and the
ranges of uncertainty for both, shown in Appendix 2, give an indication of the difficulty of representing
data as ‘accurate’.
Top-down observations have been revolutionized over the past several years with satellite technology,
particularly in relation to identifying super-emitters. 20 However, it is important to understand that
satellites are currently unable to identify methane emissions from sites which are offshore, snow-
covered, in marshy terrain, or tropical conditions. In relation to suppliers of natural gas to Europe this
means that satellites cannot view any emissions from Norway (where all oil and gas production is
offshore), Qatar (offshore), Nigeria (tropical), or the majority of Russian oil and gas production (snow-
covered).21 New satellites are being launched over the next few years with greater granularity of both
14
Balcombe et al. (2018), Table 3. provides 15 different climate metrics related to global methane impacts and their different
values over three different time frames including: global temperature potential (used by a number of different sources), sea
level rise potential, precipitation change potential, cost potential, and damage potential.
15
Ibid, Table 2 which shows how the figures have increased over the different IPCC ARs. However, the AR5 recommendation
has not formally been adopted, and in 2021 many governments and companies were still using a GWP of 25 (agreed at AR4)
to report their emissions. Others are using different metrics, for example the IEA Methane Tracker (2021) uses figures of 85
over 20 years and 30 over 100 years.
16
IPCC (2021), Chapter 7, Table 7.15, p.7–125. GWP-20 has a confidence factor of +/–11, the GWP-100 confidence factor is
+/–25.8.
17
As noted above, although AR5 established a GWP of 28 (further increased to 29.8 in AR6), this has not been formally agreed
by governments.
18
The CCAC cites a GWP impact of 84 over a 20-year period with no longer time horizon provided.
https://www.ccacoalition.org/en/slcps/methane.
19
Stern (2020), pp.5–6 has more detail on the pros and cons of bottom-up and top-down methods.
20
In most countries, a relatively small number of sources account for a disproportionate share – usually 60–70% – of total
methane emissions. These ‘super-emitters’ (usually classed as more than 0.5 tonnes/hour) are most easily identified by
satellites. Kayrros – a company which produces satellite observations and data used by both the EU and the IEA – suggests
that methane emissions from super-emitters equivalent to one gigatonne of CO2 can be eliminated within two to three years.
For more information on super emitters see Kayrros (2020) and Stern (2020), pp. 13–15.
21
Ibid, pp.13–15 has more detail on satellite observations.
The contents of this paper are the author’s sole responsibility. They do not necessarily represent the views
of the Oxford Institute for Energy Studies or any of its Members.
7location and volume of emissions, which will help to standardize observations and assist in identifying
and quantifying relatively small emission sources.
Importance of the fossil fuel sector
Although the Global Methane Pledge applies to reduction in all sources of methane, the emphasis of
immediate action and the reference to ‘high emission sources’ has concentrated attention on the fossil
fuel sector.
The UN Climate and Clean Air Coalition judged that:
‘ … the fossil fuel sector has the greatest potential for targeted mitigation by 2030. Readily
available targeted measures could reduce emissions from the oil and gas sector by 29–57 mt/yr
and from the coal sector by 12–25 mt/year. Up to 90 per cent of the oil and gas measures and
up to 98 per cent of the coal measures can be implemented at negative or low cost.’ 22
In the fossil fuel sector, there are three main sources of emissions: venting and flaring which are
deliberate acts, and fugitive emissions which are not deliberate and are often referred to as ‘leakage’.
The oil and gas sector accounts for 29–56 per cent of the 101 mt of methane emissions which the
CCAC estimates could have
‘enormous societal benefits [including] climate related benefits of reducing warming by ~0.15
°C by 2040 with a value of 0.2 °C over the longer term (~2017–2100)’.23
Emissions of methane from oil and gas production, processing, transmission, and storage operations
have been identified as a large source of anthropogenic GHG emissions, elimination of which can be
achieved most easily, quickly, and least expensively. The International Energy Agency (IEA) has
asserted that eliminating ‘all technically avoidable methane emissions’ from fossil fuel sectors – or by
around 75 per cent between 2020 and 2030 – is a key building block in achieving net zero emissions
by 2050 (Figure 3).24 This includes significant reduction of unburnt methane from incomplete flaring
from (mostly) oil production, as well as emissions from abandoned oil and gas wells and coal mines.
Figure 3: Methane emissions from coal, oil, and natural gas in the IEA Net Zero Scenario
120 3 600
Mt methane
Mt CO₂-eq
80 2 400
40 1 200
2000 2005 2010 2015 2020 2025 2030
Natural gas Oil Coal
Source: IEA Net Zero (2021), Figure 3.5, p. 104.
22
UN/CCAC (2021), p.13.
23
Ibid, p.121, not including the benefits of reduced heat exposure, air pollution, premature deaths, hospital admissions, and
crop losses. This is a significantly wider range, resulting in lower values, than the IEA proposal in Figure 3 to abate 75% of 120
mt. The very wide range is explained by the ranges in the global data (see Appendix 2) and emphasizes the general
measurement uncertainties.
24
IEA Net Zero (2021), p.104. One third of which is due to reduced fossil fuel consumption, but the majority is due to concerted
efforts to deploy all available reduction methods and technologies.
The contents of this paper are the author’s sole responsibility. They do not necessarily represent the views
of the Oxford Institute for Energy Studies or any of its Members.
8The urgency is therefore that, within eight years, it is both possible and necessary to reduce methane
emissions from fossil fuels by the very substantial amount which will be necessary for achieving overall
GHG reductions, to be on track in 2030 towards meeting 2050 net zero targets.
IEA analysis concludes that it is possible to avoid more than 70 per cent of emissions with existing
technology and 45 per cent at no net cost. 25 Figure 4 suggests that all of the measures would be cost-
efficient if the resulting savings were exported at the international gas prices of 2021, but at 2020 price
levels measures costing in excess of $3.50/mmbtu would probably not have been economic because
(allowing for the costs of transportation) only in Asian and Asia Pacific importing countries did wholesale
gas prices in that year exceed $4/mmbtu. 26 Moreover, if the saved gas had not been exported, then
domestic gas prices in some countries would not have been sufficient for measures to be cost-effective.
In both Algeria and Qatar, domestic wholesale gas prices in 2020 were significantly below $0.5/mmbtu
and have not increased since. In Nigeria, wholesale prices were just below $4/mmbtu, but in Russia
they were significantly below $2/mmbtu and in neither country are those levels likely to have increased
significantly in 2021.27 Average US prices of around $2.50/mmbtu in 2020 doubled to $5/mmbtu over
the first nine months of 2021.28
Figure 4: Methane abatement cost curve for policies in committed* countries 2020
*countries which have made policy commitments and actions on methane emissions: Argentina, Canada, China, Cote D’Ivoire,
European Union, Korea, Japan, Mexico, Norway, Nigeria, United Kingdom, and United States.
Source: IEA (2021). Figure 2.2, p.28.
2. EU legal/regulatory frameworks – the start of a (long) journey
The major focus of this study is methane emissions from pipeline and liquefied natural gas (LNG) trade,
rather than emissions from domestic production. Increasing dependence on pipeline gas and LNG
imports means that methane emissions embodied in those imports are several times those from
declining European domestic production.29 The reason is that, while greenhouse gas emissions are not
25
IEA (2021), p.7.
26
IGU (2021), Figure 28, p.35.
27
Ibid, Figure 29, p.36.
28
US Information Administration (2021), p.7.
29
For different ways of calculating the ratio of domestic to imported emissions see Stern (2020), pp.19-21. The EU Regulation
states that: `The Union is dependent on imports for 70% of its hard coal consumption, 97% of its oil consumption and 90% of its
fossil gas consumption. There is no precise knowledge on the magnitude, origin or nature of methane emissions linked to fossil
energy consumed in the Union but occurring in third countries’. European Commission (2021a), Recital 51, p.21.
The contents of this paper are the author’s sole responsibility. They do not necessarily represent the views
of the Oxford Institute for Energy Studies or any of its Members.
9high on the agenda of some exporting governments 30 and their companies, any emission standards
imposed by importing country governments – particularly those in Europe – may increase the cost of
access to EU (but also potentially global LNG) markets. This specific pipeline gas and LNG focus needs
to be distinguished from methane emissions from exports of oil and coal. Where gas is co-produced
with oil (associated gas), it is often impossible to decide how emissions should be allocated between
gas and oil production.
Traded natural gas emissions also need to be distinguished from national emissions because the
configuration of export supply chains in some (particularly large) countries is different to, and can be
distinguished from, the rest of the (oil and) gas sector (see Section 4). There is a case for believing that
a focus on MRV from exported supplies would create a positive feedback loop for addressing what may
be a much larger volume of methane emissions from domestic gas (and oil) supply chains.
The EU Methane Strategy and Proposed Regulation
The EU Methane Strategy31 published in October 2020 contained two major policy initiatives: 32
• A global initiative to create an International Methane Emissions Observatory (IMEO), as a
collaboration between the United Nations Environmental Programme (UNEP) and the
European Commission33 which would develop a Methane Supply Index (MSI) against which
emissions from individual companies would be judged.
• Concentration on MRV of methane emissions from imported fossil fuel (gas, oil, and coal)
supply chains but focusing initially on pipeline gas and LNG imports. This initiative proposed a
diplomatic outreach campaign to persuade exporting countries to improve their MRV systems,
the imposition of a default value for emissions should exporters fail to respond, and that:
‘In the absence of significant commitments from international partners, the Commission
will consider proposing legislation on targets, standards or other incentives for fossil
energy consumed and imported in the EU.’34
The Strategy was transposed into a proposed Regulation on Methane Emissions Reduction in the
Energy Sector, published in December 2021, with specific objectives: improving the accuracy of
measuring emissions associated with energy produced and consumed within the EU, further effective
reduction of methane emissions across the EU supply chain, and improving the availability of
information to provide incentives for the reduction of emissions related to fossil energy imports. 35 For
the oil and gas sectors, companies will have obligations in relation to monitoring and reporting,
submitting leak detection and repair (LDAR) programmes, limiting (and to the maximum extent
eliminating) routine venting and flaring of gas, and setting up an inventory of abandoned assets (namely
oil and gas wells and coal mines that may still be leaking methane).36
Chapter 5 of the Regulation deals with emissions from outside the EU and includes only three Articles
(27-29) on: importer requirements, a methane transparency database, and a methane emitters global
monitoring tool.37 Absent from the Regulation is the proposal from the Strategy on legislation for a
methane standard or target.38 This could be considered a disappointing outcome which will resonate in
other regions where natural gas importers were expecting the EU to include stronger measures
envisaged in the Strategy.
30
As noted above, three important suppliers of gas to Europe – Russia, Qatar, and Algeria – were not among the first 111
signatories of the Global Pledge.
31
European Commission (2020).
32
The Strategy dealt with agriculture and waste as well as energy, but we focus here on the international fossil fuel proposals.
More details of these proposals can be found in Stern (2020), pp.25–29.
33
See Section 6 for more discussion of IMEO.
34
European Commission (2020), p.17.
35
European Commission (2021a), p.2.
36
These are contained in Chapter 3 (Articles 12-18) of the Regulation, Chapter 4 is devoted to emissions from the coal sector.
37
The latter is thought to refer to identification of super-emitters (see note 20).
38
Mohlin et al. (2021) suggested how such a standard could be devised.
The contents of this paper are the author’s sole responsibility. They do not necessarily represent the views
of the Oxford Institute for Energy Studies or any of its Members.
10However, the Regulation gives notice that:
`By 31 December 2025, or earlier if the Commission considered that sufficient evidence is
available, the Commission shall examine the application of this Article (27), considering in
particular..(d) security of supply and level playing field implications in case of possible additional
obligations, including mandatory measures such as methane emission standards or
targets...Where appropriate and based on the necessary evidence to secure full compliance
with the international obligations of the Union, the Commission shall propose amendments to
this Regulation to strengthen the requirements applicable to importers with the view to ensure
a comparable level of effectiveness with respect to measurement, reporting, and verification
and mitigation of energy sector methane emissions.” 39
This makes clear that the EU has not given up on the aspiration from the Strategy to create a methane
standard or target for imported (fossil fuels including) natural gas and LNG, but will need time to gather
information. 40 Without such information, attempts to introduce standards or targets may result in
litigation due to the need to differentiate between different sources (and routes) of imported supply,
(discussed below and in Section 4).
The Regulation therefore creates a two-step process the first step being a requirement for (domestic
producers and) importers to provide information on:41
• the route followed by the energy to reach the EU;
• details of the measurement and reporting of emissions by the exporter in relation to UNFCCC
reporting and OGMP2 standards (see Section 6);
• detail of regulation or voluntary measures to control emissions including LDAR, venting and
flaring.
The second step would then be to pass the data collected by the importers to the new transparency
database (and presumably also the IMEO) to create a Methane Supply Index (MSI). The Regulation
makes a commitment to work with the IMEO to:
`…set up a Methane Supply Index [to] provide methane emission data from different sources
of fossil energy around the globe…thereby empowering buyers of fossil energy to make
informed purchasing decisions on the basis of methane emissions of fossil energy sources’. 42
The Regulation details the penalties for infringements which mostly apply to companies producing fossil
fuels within the EU. Article 30{3(l)} includes penalties for `failure of importers to provide the information
required in accordance with Article 27 and Annex VIII’ (see Appendix 3). But it is not clear how importers
are intended to obtain the information unless exporters are willing to cooperate, and what happens if
importers are either unable (because they do not have the required systems in place) or unwilling to do
so. Since it will be importers which will be paying charges for emissions associated with imports, when
these are established, and will be liable for penalties for infringements, it will be important to establish
procedures in the event of non-compliance by exporters.
Inability to provide the data can probably be remedied through technical and financial assistance from
(a combination of) the EU, the importers themselves and their governments. Unwillingness to provide
information, or disputes over the technical detail of MRV and the authority of the EU to impose such
requirements on non-EU countries, may take longer to resolve. 43 It is not also clear to this author
whether the information requirements (in Annex 8 (ii) and (iii) see Appendix 3) cover the entire import
39
Ibid, Article 27(3). Sub-paragraphs (a) through (c) refer to data collected by the monitoring tool, analysis by the IMEO and
information on MRV measures of operators outside the Union from whom energy is imported.
40
The Regulation (p.8) notes that in the consultations, `Stakeholders expressed widespread support for developing a robust
MRV standard for methane emissions in the energy sector’.
41
The information requirements are set out in Annex VIII of the Regulation which is reproduced at Appendix 3.
42
European Commission (2021a), Recital 56, p.22. The IMEO commitment to setting up an index (see Section 6) is slightly less
definite.
43
For details of the verification requirements of the Regulation see Section 6.
The contents of this paper are the author’s sole responsibility. They do not necessarily represent the views
of the Oxford Institute for Energy Studies or any of its Members.
11You can also read