Metlifecare FY13 Results Presentation - 22 August 2013 The Poynton. Takapuna, Auckland

Page created by Patrick Jackson
 
CONTINUE READING
Metlifecare FY13 Results Presentation - 22 August 2013 The Poynton. Takapuna, Auckland
Metlifecare FY13
                                  Results
                                  Presentation

                                  22 August 2013
The Poynton. Takapuna, Auckland
Metlifecare FY13 Results Presentation - 22 August 2013 The Poynton. Takapuna, Auckland
Contents
#1   FY13 Results Highlights      03

#2   FY13 Financial Performance   05

#3   FY13 Operating Metrics       12

#4   Development & Growth         16

#5   Business & Market            20

     Appendix: Portfolio
     Summary & Glossary           27

2
Metlifecare FY13 Results Presentation - 22 August 2013 The Poynton. Takapuna, Auckland
1          FY13 Results Highlights
                                         On 23 July 2012, completed the merger of Metlifecare, Vision Senior living (VSL) and
                                          Private Life Care Holdings Limited (PLC)
          Merger                         Gain on acquisition of $63.6m in line with provisional estimate at 30 June 2012 of $64.7m.
        completed                         The gain on acquisition arises as a result of the purchase price being lower than the
                                          assessment of fair value of the assets.
                                         Successfully completed the integration by 30 June 2013

                                         Net Profit after tax is $120.3m
        Financial                        FY 13 Final dividend declared of 2.0 cents per share payable 17 October 2013
                                         Underlying profit of $32.1m1

                                         Completed the development of 62 units during the year
                                         Settled 113 units with development margin of 16.6%
    Development                          60 units currently under construction
      Activity                           Development pipeline of 767 units and 173 care beds
                                         Targeted sustainable development rate of 200+ units per annum by 2015

                                         Sold Ilam development land in Christchurch for $9.4m
         Asset                           Sold Oakwoods village in Nelson for $29.0m
    Rationalisation                      All proceeds to debt repayment

3         1 Refer page 7 for additional detail on the underlying profit
Metlifecare FY13 Results Presentation - 22 August 2013 The Poynton. Takapuna, Auckland
1         FY13 Results Highlights
    Operating cash                      Net Operating cash of $74.2m1, an increase of 22% on the 26 June 2012 guidance of
        flows                            $60.7m2

                                        CBRE completed valuations of investment properties
     Revaluations                       Property revaluations resulted in a fair value movement increase of $59.1m across the
                                         portfolio.

                                        Occupancy of resales stock 96%
                                        51 completed sales stock items available as at 30 June 2013, with 17 under contract
        Operating                       Total settlements of 537 units in FY13 v 330 units in FY12
         metrics                             Resales settlements 424 units
                                             Sales settlements 113 units

                                        Private placement of $70m and subsequent Share Purchase Plan (SPP) of $10m
      Capital &                         Substantially eliminated non-development debt
     Governance                         Progressing an ASX listing
       Activity                         3 new independent directors appointed to the board
                                        Dividend Reinvestment Plan introduced

          1 Net operating cash as disclosed above excludes interest, merger and acquisition costs. Refer page 8 for additional

4         detail.
          2 Refer page 30 of 26 June 2012 prospectus.
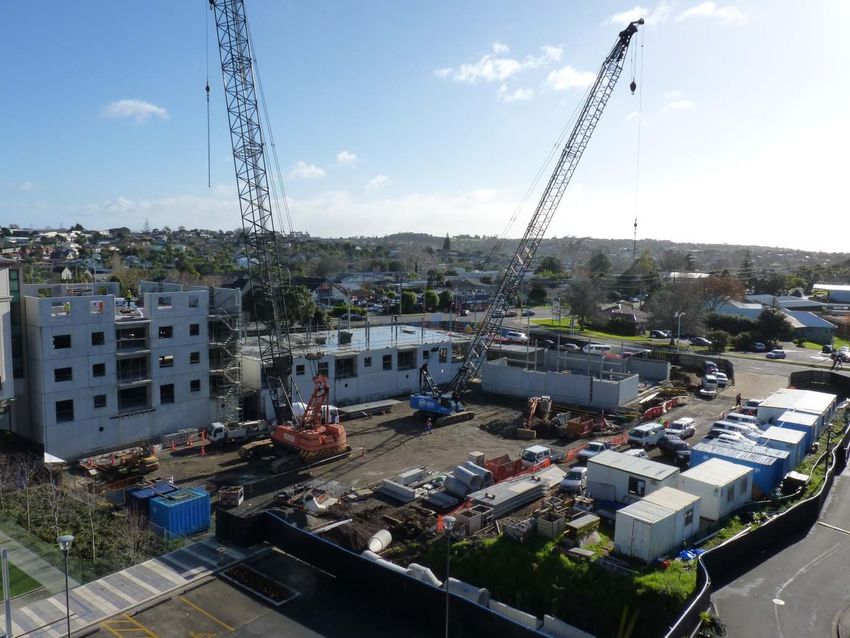
Metlifecare FY13 Results Presentation - 22 August 2013 The Poynton. Takapuna, Auckland
2.
                                         FY13
                                         Financial
                                         Performance

    7 Saint Vincent. Remuera, Auckland
5
Metlifecare FY13 Results Presentation - 22 August 2013 The Poynton. Takapuna, Auckland
2         FY13 - Financial Performance

   FY13 revenue and
    expenses up as                                                                                                              FY13        FY12
                                             Profit & Loss
    expected following the                                                                                                     ($000)      ($000)
    merger
                                               Total Revenue                                                                   92,154      64,183

   Fair Value movement for                    Fair Value movement of Investment Property                                      59,079      (99,808)
    the year of $59.1m
                                               Gain on Acquisition                                                             63,620         -

   Net Profit turnaround                      Total Expenses                                                                  (87,281)    (59,642)
    relative to the FY12 loss
                                               Finance Costs                                                                   (8,589)     (8,416)
   Underlying profit up                       Net Profit before tax                                                           118,983    (103,683)
    from $18.3m to $32.1m
    – refer page 7                             Tax benefit / (expense)                                                          1,288      (37,968)

                                               Net Profit after tax1                                                           120,271    (141,651)
   FY13 final dividend of 2
    cents per share payable
    on 17 October 2013

            1 Please note that on 23 July 2012 Metlifecare Limited acquired Private Life Care (PLC) and Vision Senior Living
    6       (VSL). Accordingly the comparatives for the year ended 30 June 2012 excludes results for PLC and VSL.
Metlifecare FY13 Results Presentation - 22 August 2013 The Poynton. Takapuna, Auckland
2           FY13 - Financial Performance

                                                                                                                                                FY13        FY12
                                                  Underlying Profit1
                                                                                                                                               ($000)      ($000)
   Underlying profit up
    from $18.2m to $32.1m                          Net profit after tax                                                                        120,271    (141,651)

                                                   Fair Value movement of Investment Property                                                  (59,079)    99,808
   Sold new sales stock
    through FY13 delivering                        Gain on acquisition                                                                         (63,620)       -
    realised development
    margins of 16.6%                               Realised gain on resales                                                                    27,630      19,451

                                                   Realised development margin                                                                  8,139      2,642
   Resales gains increased
    with the larger portfolio                      Tax benefit / (expense)                                                                     (1,288)     37,968

                                                   Underlying profit                                                                           32,053     18,218

     1 Underlying profit differs from IFRS net profit after tax. The directors have provided the underlying profit measure to assist readers
     in determining the realised and non-realised components of the fair value movement of investment property and tax expense in the
     Group’s income statement. Underlying profit is an industry-wide measure. The underlying profit is subject to volatility around the
7    realised development margins and realised gains on resales.
Metlifecare FY13 Results Presentation - 22 August 2013 The Poynton. Takapuna, Auckland
2           FY13 - Financial Performance
        Operating Cash flow                                     FY13 ($000)                          FY12 ($000)

Resident Receipts                                                   77,688                                56,376
ORA Sales & Resales                                                 199,064                              113,921
Payments to Suppliers                                              (77,940)                              (54,917)
ORA Repurchases                                                   (122,564)                              (74,098)            Operating cash flow
                                                                                                                              96% ahead of FY12
GST                                                                 (2,138)                              (1,782)
Interest Received                                                     116                                   104
                                                                                                                             Operating cash flow
Interest Paid                                                       (9,210)                              (7,629)
                                                                                                                              excluding interest and
Acquisition & integration costs                                     (4,140)                                (975)              merger costs was
Net Operating Cash (per statutory cash                                                                                        $74.2m1, 22% ahead
flow)                                                               60,876                               31,000               of the 26 June 2012
                                                                                                                              prospectus guidance
Operating Cash flow with Sales &
Resales Split
Sales Revenue                                                       48,870                                20,372             Net Operating
                                                                                                                              performance a
Net Resales Revenue                                                 27,630                                19,451
                                                                                                                              significant
Net ORA Revenue                                                     76,500                                39,823              improvement since the
                                                                                                                              half year – ($4.980m)
Net Operating Performance                                           (2,274)                                (219)
Net Operating Cash (excluding interest
and merger Cost)                                                    74,226                               39,604
Interest Paid                                                       (9,210)                              (7,629)
Acquisition & integration costs                                     (4,140)                                (975)
Net Operating Cash                                                  60,876                               31,000
  8         1 Operating cash flow as disclosed above excludes interest ($9,210), merger and acquisition costs ($4,140).
2
                    FY13 – Financial Performance
                                                                                                                                             FY13        FY12
                                                                                     Balance Sheet                                          ($000)      ($000)
                                                                    Cash & Other Assets                                                     14,674      24,689

                                                                    Property Plant & Equipment                                              28,561      33,056

                                                                    Investment Properties (refer page 10)                                  1,861,044   1,168,780
       Total Assets have grown
        55% as a result of the PLC                                  Total Assets                                                       1,904,279       1,226,525
        and VSL merger and
        revaluations                                                Payables & Other Liabilities                                            17,194      16,195

       Net Equity has increased                                    Bank Loans      (refer page 11)                                         55,476      68,781
        by 63% as a result of the
        gain on acquisition, fair                                   Deferred Membership Fees                                                73,320      42,586
        value movement and the
                                                                    Refundable Occupation Right Agreements                                 981,319      618,814
        $70m equity placement in
        June 2013                                                   Deferred Tax                                                            59,174      41,264
       NTA per share up 14%                                        Total Liabilities                                                  1,186,483       787,640
       Embedded Value per unit
                                                                    Total Equity                                                           717,796     438,885
        up slightly following the
        merger

                                                                    NTA1 ($ per share)                                                       3.46        3.04

                                                                    Embedded Value2 ($’000)                                                431,354      265,091

                                                                    Embedded Value per Unit ($’000)                                          116          114
         1 Shares on issue for the purpose of NTA per share excludes shares held as treasury stock for the executive share scheme as
         detailed in note 15 of the half year financial statements
         2 Embedded value above is calculated by taking the sum of the list prices of units across our portfolio, deducting the resident
         refundable loan liability as per the balance sheet and company-owned stock items. Management Fee receivable is as per note
9        17 of the Financial Statements. Adjustments have been made for the Palmerston North joint venture.
2
                 FY13 – Financial Performance
                                                                               FY13                      FY12
             Investment Properties                                            ($000)                    ($000)
              Investment Properties Under Development                         52,045                    23,297

              Completed Investment Properties at Fair Value                   758,415                   490,785

              Total Valuation                                                810,460                   514,082

              Plus: Refundable Occupation Right Agreement Amounts            1,192,469                  733,893

              Plus: Residents’ Share of Capital Gains                         29,822                    29,044

              Plus: Deferred Membership Fees                                  73,320                    42,586

              Less: Membership Fee Receivables                               (236,797)                 (140,515)

              Less: Occupation Right Agreement Receivables                    (8,230)                  (10,310)

              Total Investment Properties                                   1,861,044                 1,168,780

        The value of total investment properties has grown by 59% on FY12 and is in line with the 26 June 2012 prospectus
         guidance
        Investment properties under development has grown with the purchase of the Vision land bank, Unsworth Heights, Glenfield
         and development activity at The Poynton (stage 3)
        CBRE completed its second year of valuations. Discount rates and property price growth assumptions have remained largely
         unchanged:
         —    Discount rates range between 12.3% – 16.5%
         —    Property price growth assumptions range between 1.8% – 3.5%

    10
2
                       FY13 – Financial Performance

                                  Debt Summary at at 30 June 2013
         60.0                                                                                                                               Core facility limit $50m
                                                                                                                                             expiring 30 September
                                                                                                    10.3                     1.3%            2015
         50.0

    $m 40.0                                                                                                                                 Development facility
                                                                                                    17.4                     2.1%            limit $100m expiring 30
                                                                                                                                             September 2016
         30.0

         20.0
                                                                           28.3                     28.3                     3.4%
         10.0                                     17.4
                          10.3
          0.0
                      Core Debt          Land & Development Development Debt                     Total Debt                  LVR
                                            Backed Debt

    Following the equity placement with proceeds repaying debt the balance was $56.0m
    The Loan to Value Ratio is 6.8%1
    The SPP proceeds received in July 2013 repaid the remaining Core Debt
    Capital raising activities have achieved the objective of substantially removing all non-development based debt

             1 The LVR is calculated on the basis of the valuation by CBRE of all investment properties, care facilities and bare land
    11          as at 30 June 2013, and excludes the value of work in progress and 50% of the joint venture Palmerston North village.
3.
                                     Operating
                                     Metrics

     Pinesong. Titirangi, Auckland
12
3             Operating Metrics –                                                                       Sales & Resales Volumes

                                                                                                     Sales & Resales
                                                             600

    Settlement volumes up
     63% on FY12                                             500
                                                                                                                                          113
     predominantly as a result
     of the merger
                                                             400
    Gross resales cash flows
     $150.2m ($93.5m for                                                                        46
     FY12)                                                   300
                                                                                                                                    36           Sales
                                                                                                                   29
                                                                                                                                                 Resales
    Gross sales cash flows
                                                                             40
     $48.9m ($20.4m for FY12)                                200
                                                                                                                                          424

                                                                                               301                                 294
    ILU resales were 327 (183                                                                                    267
     FY12) and SA resales were                               100             200
     97 (111 FY12)

                                                                 -
                                                                            FY09              FY10               FY11              FY12   FY13

       The operating metrics section includes non-GAAP financial measures for sales, resales and occupancy which assists the
       reader with understanding the volumes of units settled during the period and the impact that sales and resales during the
       period have had on occupancy as at the end of the period.
13
3              Operating Metrics –                                                                       Sales & Resales Cash

     Settlements                                                                             FY13                               FY12       FY11

                                                                                             $’000                              $’000      $’000

     Sales Cash                                                                             48,870                             20,372     15,707

     Resales Cash                                                                          150,194                             93,549     98,026

     Total Settlements Cash                                                               199,064                             113,921     113,733

     Resales Cash net of repurchases                                                        27,630                             19,451     19,476

     DMF Realised                                                                           23,833                             12,944     11,089

           Net resales cash (capital gain) per resale consistent with FY12

           DMF cash has grown significantly with the larger portfolio

           DMF cash per settlement has also grown strongly with the larger portfolio from $44k to $56k per settlement

         The operating metrics section includes non-GAAP financial measures for sales, resales and occupancy which assists the reader
         with understanding the volumes of units settled during the period and the impact that sales and resales during the period have
14       had on occupancy as at the end of the period.
3              Operating Metrics –                                                                       Resales Occupancy

Resales % Occupancy                                                                 FY131                             FY12                     FY11

Independent Living Units                                                            97%                               94%                      94%

Serviced Apartments                                                                 88%                               87%                      79%

Total Resales Occupancy                                                             96%                               93%                      91%

    Occupancy has continued to improve over the last 3
     years                                                                                               Resales Stock Occupancy
    The occupancy numbers above exclude units which are                                98%
     currently under contract. If these contracts were                                  96%
     included total occupancy would be 97%
                                                                                        94%
    There were 51 completed sales stock items available as                             92%
     at 30 June 2013, including 17 under contract
                                                                                        90%
                                                                                        88%
                                                                                        86%
                                                                                        84%
                                                                                                    FY09            FY10         FY11   FY12          FY13
The operating metrics section includes non-GAAP financial measures for sales, resales and occupancy which assists the reader
with understanding the volumes of units settled during the period and the impact that sales and resales during the period have
had on occupancy as at the end of the period.

                   1 FY13 includes The Poynton. FY12 and FY11 exclude The Poynton
15
4.
                                                  Development
                                                  & Growth

     Stage 3 July 2013 – The Poynton ‐ Auckland

16
4              Development & Growth
                                                     Development Pipeline as at 30 June 2013
                 TOTAL PIPELINE                                                 767                            173         60

Unsworth Heights ‐ Greenfield                            310               61

        Glenfield ‐ Greenfield           96         36

                 Oakridge Villas         100
                                                                                                                                   ILUs
       Papamoa Beach Village             114             5
                                                                                                                                   Hospital
                   The Poynton         62      55                                                                                  Under Construction
                     Crestwood 23 40

                   Coastal Villas 23

                   The Avenues         39 36

                                   0           100             200   300         400   500   600   700   800         900    1000

      Brownfield and greenfield development pipeline of 1,000 units and care beds
                 60 currently under construction
      Target sustainable development rate of 200+ unit per annum by FY15

  17
4      Development & Growth
   Metlifecare will continue to focus on the premium Auckland, Hamilton and Bay of Plenty regions.

                        Metlifecare Comparison                      Metlifecare Comparison
                        Exposure by Value                           Exposure by Units

                                   1%                                         1%
                                            18%                                        18%

BOP                                                                                                     BOP

Lower Nth Island                                                                                        Lower Nth Island
                                                  10%
Waikato                                                                                                 Waikato
                                                                                                  16%
Auckland                                                                                                Auckland
                                                  5%              60%
Northland                                                                                               Northland
                      66%
                                                                                             5%

  18
4          Development & Growth
Continuum of Care - Metlifecare is seeking to increase the proportion of care within the organisation by
offering care in new developments as well as increasing care where possible on brownfield sites

 Metlifecare will seek to establish new villages with a
  minimum of 20% of the new built stock being care-related
  beds or apartments

 Greenfield sites Unsworth Heights and Glenfield will be
  developed as follows:

      Glenfield: 36 care beds and 96 Apartments

      Unsworth Heights: 61 care beds and apartments and
       310 independent living units

19
5.
                             Business &
                             Market

     The Avenues, Tauranga
20
5
                     Market & Business
                                                            Our Business
            Provision of quality retirement living and aged care services
            Development of retirement and aged care facilities designed to meet the
             unique needs of each community in which we are located
            Five revenue streams
                  Village Operations
                  Village Services
                  Care Services
                  Sales and Resales
                  Development Margins

                                                               Our Goals
              To maintain a leadership position in the industry and…..
               —     To achieve a sustainable build rate of 200 units per year by 2015 through both greenfield and
                     brownfield development
               —     To increase the company’s exposure to rest home and hospital care services
               —     To optimise cash flows through strategic portfolio management
               —     To further enhance the performance of the existing villages

21
5         Portfolio Overview

             Metlifecare Portfolio Statistics                       CRESTWOOD             POWLEY
                                                               135 units          80 units

23           Villages (12 in Auckland)                              HIGHLANDS         7 SAINT VINCENT                              BAYSWATER
                                                               199 units          93 units                                  232 units

3,836        Units (60% in Auckland by volume)                      PAKURANGA          THE POYNTON                           GREENWOOD PARK
                                                               87 units           140 units                                 240 units

359          Care Beds                                               PINESONG           WAITAKERE                                  THE AVENUES
                                                               359 units          324 units                                 90 units
                                                                   DANNEMORA          HILLSBOROUGH                                 SOMERVALE
940          Units and Care beds available for development
                                                               201 units          218 units                                 94 units
                                                                  LONGFORD PARK       HIBISCUS COAST                                PAPAMOA
60           Units under construction                          193 units          269 units                                 41 units

4,700 plus   Residents
                                                                                                                  BAY OF ISLANDS
                                                                                                            48 units
92% plus     Resident satisfaction within Villages

                                                                                                                                PALMERSTON NTH
                                                                  FOREST LAKE                                                 (50% owned)
                                                                                                                               99 units
                                                              198 units

                                                                                                                                    WAIRARAPA
                                                                                                                               81 units

                                                                                                            KAPITI
                                                                                                     225 units
                                                                                                        COASTAL VILLAS
                                                                                                     190 units

22
5           Market Opportunity
                                                             Compelling Demographic story
                   Over 20,000 pa growth in + 65 age group in New Zealand
                   Over 12,000 pa growth in + 75 age group in New Zealand
                   Life span will increase – males from 78 to 85 years and females from 82 to 89 years

                                                          Population Aged 64 Years and Older
                   1,600

                   1,400

                   1,200
 Population ‘000

                   1,000

                    800

                    600

                    400

                    200

                       0
                        2011      2016        2021       2026        2031       2036        2041          2046   2051   2056   2061
    Source: Statistics New Zealand

23
5           Market Conditions
                                                     Residential property market volumes
             The ability to enter a retirement village almost always requires the sale of the family home

             Low sales volumes negatively impact the saleability of intending residents homes

             Volumes are have improved relative to lows during first half of calendar year 2011
                                           New Zealand – No of sales (Rolling 3 month average)

25,000

20,000

15,000

10,000

 5,000

    ‐

         Source: REINZ

  24
5        Market Conditions
                                         Residential property market pricing

     Pricing in the residential property market has held up over the past 12 months showing signs of steady
      increases

                   New Zealand Real Estate Market (Medium Sale Price Rolling 3 Month Average)

$450,000.00

$400,000.00

$350,000.00

$300,000.00

$250,000.00

$200,000.00

$150,000.00

$100,000.00

 $50,000.00

      $0.00

 Source: REINZ
 25
Appendix

     Dannemora Gardens, Auckland
26
Portfolio Summary
                                                     Metlifecare Portfolio as at 30 June 2013
                                                                                               Future    Under
                                                                      Care   Care                                 Future           Overall
     Villages                        ILU's   ILA's     SA's   Total                  Total   ILU's and Constructi          Total
                                                                      Beds   Suits                                 Hosp             Total
                                                                                                ILA's     on
     Avenues                           ‐       90        ‐      90     ‐       ‐      0         39        ‐        36        75     165
     Bayswater                       159       56       17     232     ‐      6       6          ‐        ‐         ‐        0      238
     Coastal                         133        8       49     190    30       ‐     30        23         ‐         ‐       23      243
     Crestwood                       121        ‐       14     135    41       ‐     41        23         ‐        40       63      239
     Dannemora Gardens                 ‐      201        ‐     201     ‐       ‐      0          ‐        ‐         ‐        0      201
     Forest Lake Gardens             142       56        ‐     198     ‐       ‐      0          ‐        ‐         ‐        0      198
     Glenfield ‐ Greenfield            ‐        ‐        ‐       0     ‐       ‐      0         96        ‐        36       132     132
     Greenwood Park                  146       79       15     240     ‐       ‐      0          ‐        ‐         ‐         0     240
     Hibiscus Coast Village          150       71       48     269     ‐       ‐      0          ‐        ‐         ‐         0     269
     Highlands                       129        ‐       70     199    41       ‐     41          ‐        ‐         ‐         0     240
     Hillsborough Heights Village    176        ‐       42     218     ‐       ‐      0          ‐        ‐         ‐         0     218
     Kapiti                          225        ‐        ‐     225     ‐       ‐      0          ‐        ‐         ‐         0     225
     Longford Park Village           144        7       42     193     ‐       ‐      0          ‐        ‐         ‐         0     193
     Oakridge Villas                  48        ‐        ‐      48     ‐       ‐      0        100        ‐         ‐       100     148
     Pakuranga                        69        ‐       18      87    60       ‐     60          ‐        ‐         ‐         0     147
     Palmerston                       49        ‐       50      99    38       ‐     38          ‐        ‐         ‐         0     137
     Papamoa Beach Village            41        ‐        ‐      41     ‐       ‐      0        114        5         ‐       119     160
     Pinesong                        100      232       27     359            10     10          ‐        ‐         ‐        0      369
     Powley                           46        ‐       34      80     45            45          ‐        ‐         ‐        0      125
     Poynton                           ‐      125       15     140      ‐     5       5         62       55         ‐       117     262
     Seven Saint Vincent                       81       12      93      ‐     2       2          ‐        ‐         ‐        0       95
     Somervale                         83       ‐       11      94     40      ‐     40          ‐        ‐         ‐        0      134
     Unsworth Heights ‐ Greenfield      ‐       ‐        ‐       0      ‐      ‐      0        310        ‐        61       371     371
     Wairarapa                         56       ‐       25      81     41      ‐     41          ‐        ‐         ‐        0      122
     Waitakere Gardens                  ‐     324        ‐     324      ‐      ‐      0          ‐        ‐         ‐        0      324
     Total                           2,017   1,330     489    3,836   336     23     359       767       60        173     1,000   5,195

27
Glossary of Terms
      –   Sales: The first time sale of ORA (new stock)

      –   Resales: The sale of an ORA where a sale has previously been completed

      –   ORA: Occupation Right Agreement

      –   LTO: License to Occupy

      –   Gross Settlement Value: Total purchase price paid

      –   Net Settlement Value: Total purchase price paid less existing repayment obligation

      –   Net Bank Debt: Bank loans less cash at bank

      –   ILU: Independent Living Unit

      –   SA: Serviced Apartment

      –   Relicensing: Resales of ORAs

      –   DMF – Deferred Management Fees

 28
Disclaimer

•    The information in this presentation does not contain all information necessary to make an investment decision. It is
     intended to constitute a summary of certain information relating to the performance of Metlifecare Limited (“Metlifecare”)
     for the period ended 30 June 2013.
•    Investors must rely on their own examination of Metlifecare. Investors should consult with their own legal, tax, business
     and/or financial advisors in connection with any acquisition of securities.
•    The information contained in this presentation has been prepared in good faith by Metlifecare. No representation or
     warranty, express or implied, is made as to the accuracy, adequacy or reliability of any statements, estimates or opinions
     or other information contained in this presentation, any of which may change without notice. To the maximum
     extent permitted by law, Metlifecare, its directors, officers, employees and agents disclaim all liability and responsibility
     (including without limitation any liability arising from fault or negligence on the part of Metlifecare, its directors, officers,
     employees and agents) for any direct or indirect loss or damage which may be suffered by any recipient through use of or
     reliance on anything contained in, or omitted from, this presentation.
•    This presentation is not a prospectus, investment statement or disclosure document, nor an offer of shares for
     subscription, or sale, in any jurisdiction.
•    This presentation includes non-GAAP financial measures in various sections. This information has been included on the
     basis that Metlifecare believes that this information assists readers with key drivers of the performance of Metlifecare.

29
You can also read