Modeling COVID-19 Policy Options: Will a Canadian Shield Lockdown Save Jobs in Ontario?
←
→
Page content transcription
If your browser does not render page correctly, please read the page content below

JDI Policy Paper 21-0101, January 2021

Modeling COVID-19 Policy Options:
Will a Canadian Shield Lockdown Save
Jobs in Ontario?
Christopher S. Cotton
Brett Crowley
Bahman Kashi
Huw Lloyd-Ellis
Frederic Tremblay

Abstract:

We apply the methodology developed in Cotton et al (2021) to compare the
economic outcomes under alternative COVID-19 mitigation and recovery strategies
under consideration by policymakers and public health officials in Canada. This
includes an analysis of the “Canadian Shield” proposal in which preemptive strict
lockdowns are implemented, which increase economic costs in the short run but
enable the economy to more-fully reopen sooner and avoid further lockdowns in
summer 2021. This policy paper applies an updated methodology and provides a
detailed analysis for the Province of Ontario.
JDI Policy Paper 21-0101, January 2021

Author Affiliations: Christopher Cotton is a Professor of Economics and the
Jarislowsky-Deutsch Chair in Economic & Financial Policy at Queen’s University, and the
Director of Research at Limestone Analytics. Brett Crowley is a Project Coordinator at
Limestone Analytics. Bahman Kashi is President of Limestone Analytics and Adjunct
Professor at Queen’s University. Huw Lloyd-Ellis is a Professor of Economics at Queen’s
University and Academic Research Advisor at Limestone, Frederic Tremblay is a Researcher
at Limestone and a Ph.D. Candidate at Queen’s University.

Project Background and Funding: Limestone Analytics provided financial support for this
modeling exercise and the development of the STUDIO economic model on which it builds.
The methodology is presented in Cotton et al. (2021). The epidemiological and public policy
scenarios considered in this brief were provided to the research team by Global Canada’s
COVID Strategic Choices Group.

About the JDI Policy Paper Series: The John Deutsch Institute for the Study of Economic
Policy (JDI) works to build connections between academic researchers and policymakers.
The JDI Policy Paper Series includes reports conducted by faculty on behalf of governments
and institutions, research summaries and policy briefs written by Queen’s researchers in an
effort to inform decisions, and academic working papers that may be of relevance to
policymakers and practitioners.

Limestone COVID-19 Update #2
limestone-analytics.com
January 10, 2021
Will the Canadian Shield lockdown policy
save jobs in Ontario?
Projections from Limestone Analytics STUDIO model
Starting in late December, Ontario began a second wave of strict province-wide lockdowns to
reduce the transmission of COVID-19. These measures have been put in place as Ontario, along with
other provinces across Canada, face epidemiological projections showing how healthcare systems in
many locations are again at risk of being overrun by the disease. This raises a question as to how
strict the new restrictions should be and how quickly we should move to relax them as the
immediate risk of hospitals being overwhelmed is avoided.
Is it better to relax the economic restrictions as soon as we can safely do so, or to follow a more
aggressive mitigation strategy in which we prioritize further reductions to reduce the probability of
future waves of disease and lockdown policies before widespread vaccination is possible?
This document compares the costs to the Ontario economy of continuing to follow a mitigation
policy modeled after the policies from early 2020, or alternatively adopting the “Canadian Shield”
strategy with stricter restrictions in the early months of 2021 in order to avoid additional waves of
lockdown later in the spring. The Canadian Shield strategy, proposed by the COVID Strategic
Choices Group, involves shifting priority away from a quick-as-possible reopening to instead
prioritize avoiding later waves of restrictions.
Our previous COVID-19 economic update provided nationwide economic projections for various
mitigation strategies, including the Canadian Shield. That analysis was used by the COVID Strategic
Choices Group to compare the economic and health outcomes under alternative scenarios before
releasing its Canadian Shield proposal.1 In the current policy brief, we provide detailed economic
1
For details on the Canadian Shield proposal see https://covidstrategicchoices.ca/. For details on our
economic model and Canadawide analysis see https://limestone-analytics.com/publications/.
Page 1 of 13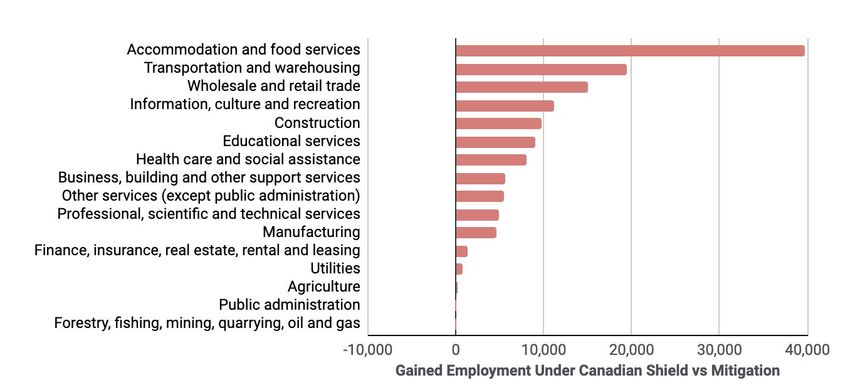
Limestone COVID-19 Update #2
limestone-analytics.com
January 10, 2021
projections for Ontario, including a breakdown by industry. The numbers presented here differ
slightly from the aggregate estimates for Ontario presented in our previous estimates and are
consistent with the updated projections for the Canadian Shield policy to incorporate a more detailed
approximation of the projected lockdown relaxation under the policy. At the end of this document, we
also provide updated projections for all of Canada.
The analysis shows that the Ontario economy is better off under the Canadian Shield than the
alternative strategy of continued mitigation. This is because a more-intense early year lockdown can
be less costly for the economy than less-intense, shorter duration lockdowns spread across a longer
period of time. We show that this is the case even under the expectation that vaccinations will be
widely available in the second half of the year. Full economic activity does not immediately resume
with the lifting of economic restrictions; rather the economy takes time to fully recover. This means
that an intense lockdown that allows for full reopening afterwards can result in fewer overall jobs
lost and a lower decline in GDP than on-again, off-again lockdowns where new restrictions are
required every few months.
As such, the Canadian Shield strategy is estimated to save Ontario approximately $19 billion in GDP
and 135,000 full-time equivalent jobs over the course of 2021. Details are provided in the brief below.
Impact of lockdowns on jobs in Ontario
(Average employment deficit in 2021)
Impact of lockdowns on Ontario’s GDP
(Million Dollars in 2021)
Projections from Limestone Analytics STUDIO model
Page 2 of 13
Limestone COVID-19 Update #2
limestone-analytics.com
January 10, 2021
Background
Limestone Analytics, together with economists from Queen’s University, developed the Short-Term
Under-capacity Dynamic Input-Output (STUDIO) model to measure the economic impact of
COVID-19.2 The model is designed to provide GDP and workforce projections under various
pandemic mitigation and recovery policies. It is capable of providing national, provincial, or
local-level projections of job and GDP loss for alternative lockdown and reopening strategies in
order to guide policymaker strategy.
STUDIO captures dynamic input-output interactions between industrial sectors resulting from the
lock-down and recovery policies. The highly-flexible model can consider policies implemented at
either the province-wide or location-specific levels to provide projections down to the level of
census division and industry level using readily-available public data sources. It can accommodate
various scenarios regarding how the disease is likely to spread and consumer behaviour likely to
change over the recovery period. The model has been implemented for all of Canada and provides
the economic projections for the federally funded Looking Glass project supported through Canada’s
Digital Technology Supercluster, and was the economic model behind the Canadian Shield analysis.
In this policy brief, we highlight the ability of the STUDIO model to provide rapid-response policy
analysis to guide the short-to-medium term policy response within Canada. The analysis applies the
model to two alternative strategies COVID-19 mitigation and recovery that are being debated among
policy leaders going into 2021. The analysis reported here provides detailed projections for Ontario
while complementing the previous analysis we conducted for all of Canada. The numbers in this
report for Ontario have also been updated to reflect more recent data. That previous analysis can be
found on the Limestone Analytics publication page: https://limestone-analytics.com/publications/
Limestone Analytics is able to provide more detailed and customized analyses, including the
breakdown at the local level of the economic costs of alternative mitigation and reopening strategies
being considered by the government.
Policy Options and Scenarios
We provide economic projections for the period of January to December 2021 for two mitigation and
recovery strategies that map into alternative approaches for addressing COVID-19 in Ontario until
the widespread vaccination of the population. The first strategy involves continuing to follow the
mitigation strategy that the government has largely been following for the past several months. The
second is to adopt the Canadian Shield strategy that has been proposed by the COVID Strategic
Choices Group led by Global Canada.
Policy 1: Continued Mitigation
One option available to policymakers is to continue along the current path in many locations of
locking down in cases where hospitals are at risk of being overrun by the disease, and restricting
high-risk activities and large gatherings, but otherwise avoiding strict economic and social
2
The academic paper summarizing the methodology is: Cotton, Christopher, Brett Crowley, Bahman Kashi,
Huw Lloyd-Ellis, and Frederic Tremblay (2020). Quantifying the Economic Impacts of COVID-19 Policy
Responses on Canada’s Provinces in (Almost) Real Time. Queen’s Economic Department Working Paper 1441.
https://limestone-analytics.com/publications/
Page 3 of 13
Limestone COVID-19 Update #2
limestone-analytics.com
January 10, 2021
restrictions. Such a policy may play out in several different ways, depending on the disease spreads
and the effectiveness of short term mitigation strategies. Based on consultations with other
members of Canada’s COVID Strategic Choices Group, we model the Continued Mitigation policy as
an on-again, off-again lockdown strategy.
As an estimation of how such a policy will play out, we assume that the first month of each quarter
involves moderate lockdown restrictions, defined as being 2/3rds as economically restrictive as the
lockdown policies in each province in May 2020 (during the first stage of the more-relaxed
lockdown restrictions that were rolled out following the stricter policies from March and April).
Each one-month lockdown period followed by two months of reopening before another round of
light-to-moderate lockdown is implemented. For the scenario illustrated in this document, we
assume that such an on-again-off-again cycle continues through fall 2021, after which time we
assume vaccinations are widely-available enough to avoid another wave of lockdown restrictions.
This means that the last month of lockdown is July 2021 and no additional lockdown occurs in
October 2021, and the economy converges to the trajectory of the recovery from summer to fall
2020.
Policy 2: Canadian Shield
The policy alternative involves the imposition of immediate and wider-reaching lockdown
restrictions in an effort to ensure that COVID-19 transmission rates decline to the point that they
continue to decline after the lockdown restrictions are relaxed. For this policy case, the January
lockdown restriction is assumed to be wide-reaching and strict, which is assumed to be 2/3rds as
economically restrictive across all industries and locations as the heavy lockdown restrictions that
were in place across Canada during April 2020. Assuming such restrictions are moderately less
costly compared to what they were in April 2020 could be interpreted as either the restrictions
themselves being less-strict or better-targeted compared to the blanket stay-at-home orders from
last April, as well as the fact that many businesses are better able to cope with remote work and
travel bans than they were at the beginning of 2020. In February, the strict lockdown restrictions
from January are then relaxed moderately and remain in place through April 2020. These
less-restrictive measures defined as being 2/3rds as economically restrictive as the policies that
were in place across provinces in May 2020. From May 2021 onward, the economy begins its
recovery towards ‘normal’ activity.
For details regarding the epidemiological model and policy projections behind the Canadian Shield
scenario, see the Canadian Shield policy proposal released by the COVID Strategic Choices Group
led by Global Canada.3
3
https://covidstrategicchoices.ca/
Page 4 of 13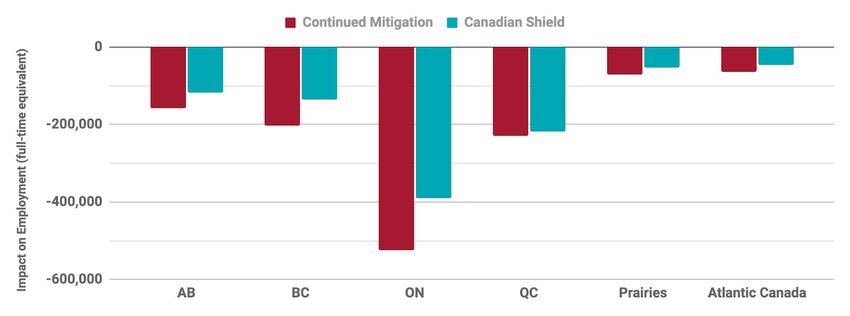
Limestone COVID-19 Update #2
limestone-analytics.com
January 10, 2021
Economic Projections
The STUDIO model can provide economic projections by industry at the local level. For the purposes
of this report, we break out results for Ontario by industry but not localities. The estimates are
presented in terms of lost economic activity compared to the level of activity that would have been
expected in the same time period had the COVID-19 pandemic never happened.
We can consider how the economic costs of COVID-19 for Ontario evolve over the course of the
year under different scenarios. Tables 1 and 2 break out the projected Ontario-wide economic
impact by quarter. The chart in Figure 1 displays the trends under each scenario from December
2020 through December 2021.
The projections show that the stricter lockdown under the Canadian Shield strategy results in a
more substantial economic decline in the first quarter of 2021 compared to a Continued Mitigation
strategy. However, the economic deficit over the rest of the year is lower under the Canadian Shield
strategy compared to the alternative. This is because the stricter lockdown restrictions are designed
to avoid the need for additional waves of lockdown restrictions later in the year. In aggregate, the
decline in jobs and GDP are both lower under the Canadian Shield policy, suggesting that such a
policy is better for the economy.
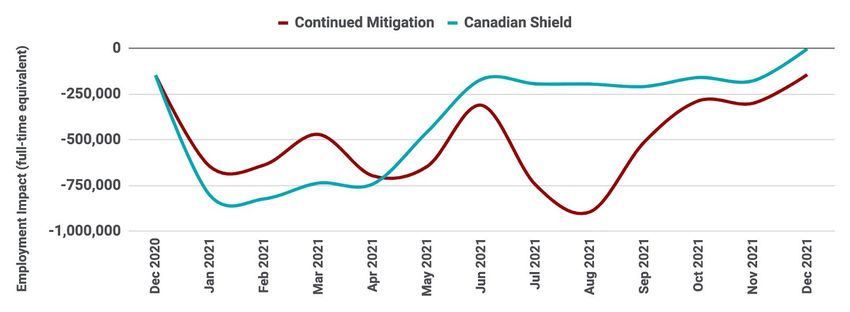
Tables 3 and 4, together with Figures 3 and 4, break out the job and GDP projections by industry.
The tables show the transportation, accommodation, and food services sectors benefit most from
the shift in strategy. These sectors are also those that are hardest hit by COVID-19 overall.4
Differences in cross-industry patterns in job loss and GDP loss are due to differences in wages paid
within the industries.
Table 1: Ontario average deficit in FTE employment due to COVID-19 by policy, 2021
Q1 Q2 Q3 Q4 Average
Continued Mitigation -584,626 -551,343 -717,739 -243,956 -524,416
Canadian Shield -733,655 -491,006 -218,065 -115,587 -389,579
Projections from Limestone Analytics STUDIO model
Table 2: Quarterly deficit in Ontario annual GDP due to COVID-19 (millions CAD), 2021
Q1 Q2 Q3 Q4 Total
Continued Mitigation -$23,352 -$20,994 -$27,429 -$10,852 -$82,627
Canadian Shield -$30,161 -$18,745 -$7,728 -$7,147 -$63,781
Projections from Limestone Analytics STUDIO model
4
To explore the industry breakdown of the impact of COVID-19 to date, see the dashboard Limestone
developed for the Eastern Ontario Leadership Council:
http://www.eolc.info/en/working-groups-and-projects/covid-19-economic-modelling.aspx
Page 5 of 13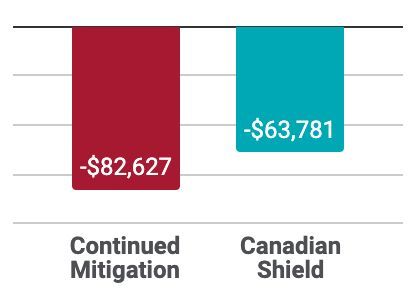
Limestone COVID-19 Update #2
limestone-analytics.com
                                                                                         January 10, 2021

Figure 1: Projected trends in full-time equivalent job loss due to COVID-19 under each policy alternative

                                                                        Projections from Limestone Analytics STUDIO model

   Figure 2: Projected trends in national GDP deficit due to COVID-19 under each policy alternative

                                                                                                     Page 6 of 13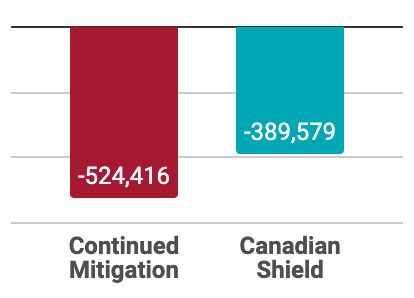
Limestone COVID-19 Update #2
limestone-analytics.com
                                                                                                   January 10, 2021

Table 3: Ontario average annual deficit in FTE employment due to COVID-19 by policy, 2021
                                                      Continued Mitigation   Canadian Shield               Jobs Saved

Agriculture                                                   -597                -360                          237

Forestry, fishing, mining, quarrying, oil and gas             -946               -1,017                         -71

Utilities                                                    -3,472              -2,776                         696

Construction                                                -37,676              -27,986                       9,690

Manufacturing                                               -51,553              -46,956                       4,597

Wholesale and retail trade                                  -91,642              -76,622                      15,020

Transportation and warehousing                              -42,160              -22,741                       19,419

Finance, insurance, real estate, rental and leasing          -7,057              -5,671                        1,386

Professional, scientific and technical services             -23,240              -18,404                       4,836

Business, building and other support services               -15,678              -10,111                       5,567

Educational services                                         -51,577             -42,523                       9,054

Health care and social assistance                           -44,847              -36,818                       8,029

Information, culture and recreation                         -27,656              -16,428                       11,228

Accommodation and food services                             -102,640             -62,908                      39,732

Other services (except public administration)               -23,517              -18,062                       5,455

Public administration                                         -159                -196                          -37

Total                                                       -524,417            -389,579                      134,838

 Impact of lockdowns on jobs in Ontario
  (Average employment deficit in 2021)

                                                                                  Projections from Limestone Analytics STUDIO model

   Figure 3: Differences in full-time equivalent employment by sector under alternative policies, 2021

                                                                                                               Page 7 of 13
Limestone COVID-19 Update #2
limestone-analytics.com
January 10, 2021
Table 4: Deficit in Ontario’s GDP due to COVID-19 by policy, 2021
Continued Mitigation Canadian Shield Difference
Agriculture -$126 -$76 $50
Forestry, fishing, mining, quarrying, oil and gas -$345 -$370 -$25
Utilities -$1,242 -$996 $246
Construction -$7,527 -$5,525 $2,002
Manufacturing -$11,309 -$10,309 $1,000
Wholesale and retail trade -$11,459 -$9,559 $1,900
Transportation and warehousing -$6,230 -$3,377 $2,853
Finance, insurance, real estate, rental and leasing -$9,711 -$7,799 $1,912
Professional, scientific and technical services -$3,410 -$2,711 $699
Business, building and other support services -$3,249 -$2,064 $1,185
Educational services -$6,209 -$4,985 $1,224
Health care and social assistance -$5,913 -$4,866 $1,047
Information, culture and recreation -$5,473 -$3,315 $2,158
Accommodation and food services -$5,766 -$3,495 $2,271
Other services (except public administration) -$3,123 -$2,404 $719
Public administration -$1,537 -$1,929 -$392
Total -$82,629 -$63,781 $18,849
Impact of lockdowns on Ontario’s GDP
(Million Dollars in 2021)
Projections from Limestone Analytics STUDIO model
Figure 4: Differences in GDP by sector under alternative policies, 2021
Page 8 of 13Limestone COVID-19 Update #2
limestone-analytics.com
January 10, 2021
Discussion of Results for Ontario
The economic projections compare economic costs under the Canadian Shield COVID-19 mitigation
strategy and a continued mitigation approach that involves relaxing economic restrictions more
quickly, similar to the approach taken in spring 2020. Both scenarios are calibrated using
epidemiological and policy projections provided by Canada’s COVID Strategic Choices Group in their
policy analysis of alternative mitigation and recovery strategies. The projections are intended to
enable more-informed policy discussion and provide rigorous quantitative estimates to help guide
policy recommendations.
The analysis clearly illustrates how a more intense early year lockdown can be less costly for the
economy than less-intense, shorter duration lockdowns spread across a longer period of time. We
show that this is the case even under an expectation that vaccinations will be widely available in the
second half of the year, facilitating a more robust recovery in the fall and winter even without an
early-year lockdown. This is because full economic activity does not immediately resume with the
lifting of economic restrictions; rather the economy takes time to fully recover. This means that an
intense lockdown that allows for fuller reopening afterwards may result in fewer overall jobs lost
and a lower decline in GDP than on-again, off-again lockdowns where new restrictions are required
every few months before the economy has a chance to fully recover from the previous round of
restrictions.
Understanding how various lockdown policies are likely to impact the economy is essential for
Canada’s policy response. However, the employment and GDP figures considered here are just some
of the outcomes that need to be considered by policymakers when weighing alternative options. It
is important to acknowledge several effects that are not fully accounted for in our projections. First,
the model provides estimates of lost employment and GDP; it does not assign any additional
economic value to declines in health or mortality (which are also likely to favour the Canadian Shield
proposal). Second, our model does not account for differences in the impact on mental health, social
interactions, or education outcomes, even though these factors are likely to affect future
productivity and economic outcomes into the future. A full accounting of the costs and benefits of
alternative policy choices would need to account for these effects, and others. It is important to
consider the extent to which some of these additional costs may be avoided under any new wave of
lockdown policies. Even though they are not explicitly modeled, it is our opinion from extensive
work evaluating education systems and programs that the reopening of in-person primary schools,
for example, should be prioritized when safe reopening is feasible.
Other considerations not present in the current analysis include breakdowns by municipality. The
STUDIO model at the foundation of the analysis can account for local level differences in lockdown
policies, and we have the capability to produce projections for different policy scenarios at the local
level.
Furthermore, we do not consider declines in employment by age or gender. However, based on an
analysis using 2020 data, we know that the employment losses under COVID-19 disproportionately
affect young workers and women. These trends are likely to continue to hold in 2021.5
5
For an analysis of gender and age differences in job loss to date, see Limestone’s COVID-19 Economic Impact
Explorer. https://limestone-analytics.com/project/economic-impact-explorer/
Page 9 of 13Limestone COVID-19 Update #2
limestone-analytics.com
January 10, 2021
It is important to highlight that the most appropriate application of a Canadian Shield strategy
involves relaxing restrictions when they can be relaxed while maintaining downward trends in
disease transmission.
These projections highlight the ability of Limestone’s STUDIO model to guide policy through the
analysis of a myriad of mitigation and recovery scenarios. It can provide justifiable quantitative
projections based on a rigorous peer-reviewed methodology for any description of how the disease
and policy are likely to evolve over the coming year. The accuracy of the economic projections will
depend on how well the scenarios fed into the model match the actual evolution of the disease and
policy response that occurs under any policy.
Page 10 of 13Limestone COVID-19 Update #2
limestone-analytics.com
January 10, 2021
Updated Canadawide Projections
In our previous policy brief, we provided economic projections under various mitigation and
recovery strategies for all of Canada, as well as aggregate estimates for individual provinces and
regions within Canada. Since the initial release, we have updated the economic model to improve
the expected accuracy of the Canadian Shield projections to ensure that it best matches the
description of the policy under consideration in the policy debate. The other estimates from the
previous reports (including projections under the continued mitigation strategy, a continued
mitigation strategy with delayed vaccine, and a stricter-lockdown Melbourne Model) remain
unchanged with the updates.
These updates to the accuracy of the Canadian Shield strategy lead to very slightly higher economic
losses under that strategy, but these changes are small enough that they do not change any of the
qualitative results from the nationwide analysis. The Canadian Shield strategy remains the least
economically costly strategy for the nationwide economy compared to any of the alternative strategies,
whether we focus on job or GDP loss.
Projections from Limestone Analytics STUDIO model
Figure 5: Impact on Employment and GDP across Canada in 2021
Page 11 of 13Limestone COVID-19 Update #2
limestone-analytics.com
January 10, 2021
Table 5: Impact on GDP across Canada in 2021
Prairies Atlantic
AB BC ON QC CA
(MB + SK) Canada
Continued
-$34,600 -$28,156 -$82,627 -$34,187 -$14,636 -$8,128 -$202,334
Mitigation
Canadian Shield -$29,182 -$20,327 -$63,781 -$37,219 -$11,716 -$6,959 -$169,184
Projections from Limestone Analytics STUDIO model
Table 6: Impact on Employment across Canada in 2021
Prairies Atlantic
AB BC ON QC CA
(MB + SK) Canada
Continued
-157,636 -203,240 -524,416 -228,956 -70,210 -63,939 -1,248,397
Mitigation
Canadian Shield -117,861 -135,228 -389,579 -218,055 -52,777 -46,092 -959,592
Projections from Limestone Analytics STUDIO model
Page 12 of 13Limestone COVID-19 Update #2
limestone-analytics.com
January 10, 2021
About Limestone
Limestone Analytics (Limestone) is a Canada- and U.S.-based consulting firm that specializes in the
evaluation of projects and policies around the globe. The firm is recognized for combining academic
rigour, state-of-the-art methods, and policy experience to provide the highest-quality, customized
analysis and evaluation services and to help clients incorporate evidence into the design, financing
and implementation of their projects. The firm and its principal staff have successfully completed
assignments for large organizations and NGOs such as the US Department of State, Nutrition
International, Copenhagen Consensus Center, World Bank, World Vision and the Millenium
Challenge Corporation, among many other clients.
Limestone Analytics, together with economists from Queen’s University, developed the Short-Term
Under-capacity Dynamic Input-Output (STUDIO) model to measure the economic impact of
COVID-19. That model serves as a foundation for the analysis in this policy brief.
This policy brief is based on research conducted by Christopher Cotton, Brett Crowley, Bahman
Kashi, Huw Lloyd-Ellis, and Frederic Tremblay.6
6
Cotton is the Director of Research at Limestone Analytics and the Jarislowsky-Deutsch Chair in Economic &
Financial Policy at Queen’s University; Crowley is an Associate at Limestone; Kashi is the President of
Limestone and an Adjunct Professor at Queen’s; Lloyd-Ellis is a Professor of Economics at Queen’s and an
Academic Research Advisor at Limestone; Tremblay is a Research Associate at Limestone and Ph.D. Candidate
at Queen’s.
Page 13 of 13JDI Policy Paper 21-0101, January 2021 The bibliography includes sources directly referred to in the analysis and related policy briefs that informed the research team’s analysis, including reference to updated, publicly available versions of the health projections that were shared with the research team.. References Agnew, Mark, Tasha Ayinde, Andre Beaulieu, Caroline Colijn, Christopher Cotton, Marion Crowe, Irfan Dhalla, Justin Ferbey, Robert Greenhill, Blayne Haggart, Brett House, Ryan Imgrund, Jack Jebwab, Jaspreet Khangura, Jeff Kwong, Chris McCabe, Andrew Morris, Jean-Paul R. Soucy, and Ashleigh Tuite. “Building the Canadian Shield: A New Strategy to Protect Canadians from COVID and from the Fight Against COVID.” A Policy Proposal by the COVID Strategy Choices Group, December 2020. Cotton, Christopher, Brett Crowley, Bahman Kashi, Huw Lloyd-Ellis, and Frederic Tremblay (2021), “Quantifying the Economic Impacts of COVID-19 Policy Responses on Canada's Provinces in (Almost) Real Time,” Canadian Journal of Economics, forthcoming. Cotton, Christopher, Brett Crowley, Bahman Kashi, Huw Lloyd-Ellis, and Frederic Tremblay (2020), “COVID-19 PLanning for 2021: Comparing the Economic Impact of Alternative Recovery Scenarios,” Limestone Analytics and JDI Public Policy Paper 201202. Cotton, Christopher, Brett Crowley, Bahman Kashi, Huw Lloyd-Ellis, and Frederic Tremblay (2021b), “New Variants of COVID-19: What are the Economic Costs?” Limestone Analytics and JDI Public Policy Paper 210201. Cotton, Christopher, Brett Crowley and Huw Lloyd-Ellis (2021), “The Economic Costs of Delayed Policy and Delayed Vaccines in the Fight Against COVID-19,” Limestone Analytics and JDI Public Policy Paper 210302. Crowley, Brett and Frederic Tremblay (2021), "Optimizing COVID-19 Stimulus Spending in Malawi," Limestone Analytics and JDI Public Policy Paper 210301. Global Canada, “Should Canada Go For Zero? Global Best Practices, TANZANC Democracies & Lessons For Canada,” working paper, December 2020. McCabe, Christopher, Vic Adamowicz, Robin Boadway, Dan Breznitz, Christopher Cotton, Nathalie de Marcellis-Warin, Stewart Elgie, Evelyn Forget, Richard Gold, Esyllt Jones, Fabian Lange, Stuart Peacock, and Lindsay Tedds, “Renewing the social contract: Economic recovery in Canada from COVID-19,” An RSC Policy Briefing, Royal Society of Canada COVID-19 Task Force, December 2020. Otto, Sarah “Sally”, Dean Karlen, Caroline Colijn, Jens von Bergmann, Rob James, James Collander, Eric Cytrynbaum, Daniel J. McDonald, Paul Tupper, Dan Coombs, Elisha Are (2021), “COVID Model Projections,” BC COVID-19 Modelling Group.
You can also read