Modeling Player Experience in Super Mario Bros
←
→
Page content transcription
If your browser does not render page correctly, please read the page content below
Modeling Player Experience in Super Mario Bros
                               Chris Pedersen, Julian Togelius and Georgios N. Yannakakis

   Abstract— This paper investigates the relationship between         content. Automatic content generation is likely to be of great
level design parameters of platform games, individual playing         importance to computer game development in the future;
characteristics and player experience. The investigated design        both offline, for making the game development process
parameters relate to the placement and sizes of gaps in the level
and the existence of direction changes; components of player          more efficient (design of content such as environments and
experience include fun, frustration and challenge. A neural           animations now consume a major part of the development
network model that maps between level design parameters,              budget for most commercial games) and online, for enabling
playing behavior characteristics and player reported emotions         new types of games based on player-adapted content. These
is trained using evolutionary preference learning and data from       efforts see some aspect of a game as variable, define a
480 platform game sessions. Results show that challenge and
frustration can be predicted with a high accuracy (77.77% and         fitness (“goodness”) function based on a theory of player
88.66% respectively) via a simple single-neuron model whereas         satisfaction, and use a learning or optimization algorithm to
model accuracy for fun (69.18%) suggests the use of more              change the variable aspect of the game so as to become more
complex non-linear approximators for this emotion. The paper          “fun” according to some definition. The literature on this is
concludes with a discussion on how the obtained models can            so far scarce, as it is a new research direction. The aspects
be utilized to automatically generate game levels which will
enhance player experience.                                            of games that have been optimized include:
   Keywords: Platform games, player satisfaction, content               •   Environments, such as tracks for racing games [8] and
creation, fun, preference learning, entertainment modeling,                 levels for platform games [9].
neuroevolution                                                          •   Narrative [10]
                                                                        •   Rules for board games [11], [12] and Pac-Man-like
                      I. I NTRODUCTION                                      games [13].
   Numerous theories exist regarding what makes computer              What the above studies have in common is that the fitness
games fun, as well as which aspects contribute to other types         or cost functions used for optimization have been somewhat
of player experience such as challenge, frustration and im-           arbitrary, in that they have been based on intuition in com-
mersion [1], [2], [3], [4], [5]. These theories have originated       bination with some qualitative theory of player experience.
in different research fields and in many cases independently          Optimization of game aspects based on empirically derived
of each other (however, there is substantial agreement on             models have so far been limited to the impact of NPC be-
several counts, e.g. regarding the importance of challenge            havior [6] and the adjustment of NPC behavioral parameters
and learnability for making a game fun). While useful high-           for maximizing satisfaction in games [14]. To the best of
level guidance for game design, none of these theories is             our knowledge, game content such as rules or environments
quantitative — derived models of player experience are not            has not been generated based on empirically derived models.
mathematical expressions — and they tend to apply to games            We consider better modeling of player experience to be of
in general rather than specific aspects of specific games. This       utmost importance for making automatic content generation
means that if we want to develop algorithms that design or            techniques more sophisticated and usable.
adapt games (or aspects of games) automatically, we have to              The work we describe in this paper is concerned with the
make several auxiliary assumptions in order to achieve the            construction of computational models of player experience,
necessary specificity and preciseness of our models.                  derived from gameplay interaction, which can be used as
   It seems clear that we need empirical research on particular       fitness functions for game content generation. We use a mod-
games to acquire such models. Recently, research in player            ified version of a classic platform game for our experiments
satisfaction modeling has focused on empirically measuring            and collect player data through the Internet.
the effects on player experience of changing various aspects             In the following, we describe the game used for our
of computer games, such as non-player character (NPC)                 experiments; which player interaction data was collected and
playing styles in the Pac-Man game [6]. Similarly, efficient          how; the preference learning method we used to construct
quantitative models of player satisfaction have been con-             player experience models; how feature selection was used
structed using in-game data, questionnaires and physiological         to reduce the number of features used in the model; results
measurements in augmented-reality games [7].                          of an initial statistical analysis; and the results of training
   At the same time, a parallel research direction aims to            nonlinear perceptrons to approximate the functions mapping
find methods for automatically generating entertaining game           between selected gameplay features and aspects of player
                                                                      experience. Finally, we discuss how the induced models will
   The authors are with the Center for Computer Games Research, IT
University of Copenhagen, Rued Langgaards Vej 7, DK-2300 Copenhagen   be used for automatically generating game content. This
S, Denmark. Emails: gammabyte@gmail.com, {juto, yannakakis}@itu.dk    paper significantly extends [15] in which only the core ideas
of the methodology proposed are outlined.
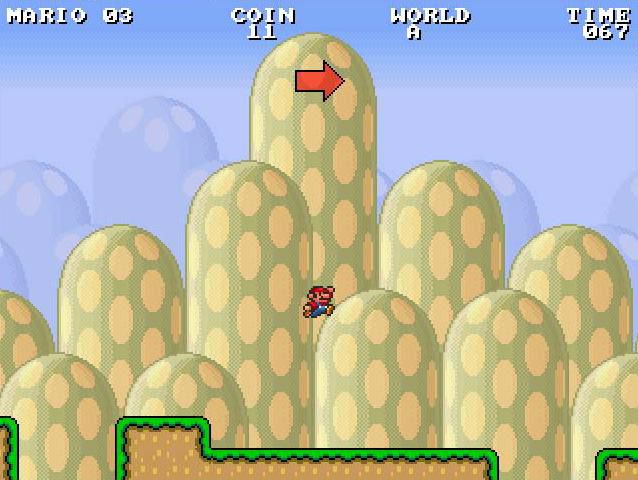
II. T ESTBED PLATFORM GAME
The test-bed platform game used for our studies is a
modified version of Markus Persson’s Infinite Mario Bros
(see Fig. 1) which is a public domain clone of Nintendo’s
classic platform game Super Mario Bros. The original Infinite
Mario Bros is playable on the web, where Java source code
is also available1 .
The gameplay in Super Mario Bros consists of moving the
player-controlled character, Mario, through two-dimensional
levels, which are viewed sideways. Mario can walk and run
to the right and left, jump, and (depending on which state
he is in) shoot fireballs. Gravity acts on Mario, making it
necessary to jump over holes (or gaps) to get past them.
Fig. 1. Test-bed game screenshot, showing Small Mario jumping over a
Mario can be in one of three states: Small (at the beginning piece of flat terrain surrounded by two gaps.
of a game), Big (can crush some objects by jumping into
them from below), and Fire (can shoot fireballs).
The main goal of each level is to get to the end of the levels are randomly generated by traversing a fixed width
level, which means traversing it from left to right. Auxiliary and adding features (such as blocks, gaps and opponents)
goals include collecting as many as possible of the coins according to certain heuristics. In our modified version of
that are scattered around the level, clearing the level as fast Infinite Mario Bros most of the randomized placement of
as possible, and collecting the highest score, which in part level features is fixed since we concentrate on a few selected
depends on the number of collected coins and killed enemies. game level parameters that affect game experience.
The presence of gaps and moving enemies are the main III. DATA COLLECTION
challenges of Mario. If Mario falls down a gap, he loses a
life. If he touches an enemy, he gets hurt; this means losing Before any modeling could take place we needed to collect
a life if he is currently in the Small state, whereas if he data to train the model on. We collected three types of data
is in the Big and Fire state he shifts to Small and Large from hundreds of players over the Internet:
state respectively. However, if he jumps so that he lands 1) Controllable features of the game, i.e. the parameters
on the enemy from above, the outcome is dependent on the used for level generation, and affecting the type and
enemy: Most enemies (e.g. goombas, fireballs) die from this difficulty of the level. These were varied systematically
treatment; others (e.g. piranha plants) are not vulnerable to to make sure all variants of the game were compared.
this and proceed to hurt Mario; finally, turtles withdraw into 2) Gameplay characteristics, i.e. how the user plays the
their shells if jumped on, and these shells can then be picked game. We measured statistical features such as how
up by Mario and thrown at other enemies to kill them. often and when the player jumped, ran, died etc. These
Certain items are scattered around the levels, either out in features cannot be directly controlled by the game as
the open, or hidden inside blocks of brick and only appearing they depend solely on the player’s skill and playing
when Mario jumps at these blocks from below so that he style in a particular game level.
smashes his head into them. Available items include coins 3) The player’s experience of playing the game, measured
which can be collected for score and for extra lives (every through a 4-alternative forced choice questionnaire
100 coins), mushrooms which make Mario grow Big if he administered after playing two pairs of games with
is currently Small, and flowers which make Mario turn into different controllable features and asking the players
the Fire state if he is already Big. to rank the games in order of emotional preference.
No textual description can fully convey the gameplay of a Below we describe in detail which features were collected
particular game. Only some of the main rules and elements of for each type of data.
Super Mario Bros are explained above; the original game is A. Controllable features
one of the world’s best selling games, and still very playable
more than two decades after its release in the mid-eighties. We modified the existing level generator to create levels
Its game design has been enormously influential and inspired according to four controllable parameters presented below.
countless other games, making it a good experiment platform Three of these parameters are dedicated to the number, width
for player experience modeling. and placement of gaps. The fourth parameter turns a new
While implementing most features of Super Mario Bros, function, the direction switch, on or off.
the standout feature of Infinite Mario Bros is the automatic • The number of gaps in the level, G.
generation of levels. Every time a new game is started, • The average width of gaps, E{Gw }.
• The spatial diversity of gaps which is measured by the
1 http://www.mojang.com/notch/mario/ entropy of the number of gaps appearing in a number ofG (equally-spaced) segments of the level. The entropy Time: completion time, tc ; playing duration of last life
of gap-placements Hg in the G segments is calculated over total time spent on the level, tll ; percentage of
and normalized into [0, 1] via (1): time that the player: is standing still, ts , running, tr ,
" # is on large Mario mode, tl , is on fire Mario mode,
G
1 X gi g
i tf , is on powerup mode, tp , is moving left, tL , is
Hg = − log (1) moving right, tR , and is jumping, tj .
logG i=1 G G
Item: number of collected items (coins, destroyed blocks
where gi is the number of gap-placements into level and powerups) over total items existent in the level,
segment i. If the gaps are placed in all G level segments nI ; number of times the player kicked an opponent
uniformly then gi = 1 for all G parts and Hg will be 1; shell, ns ; number of coins collected over the total
if all gaps are placed in one level segment Hg is zero. number of coins existent in the level, nc ; number
This controllable feature provides a notion of unpre- of empty blocks destroyed over the total number of
dictability of gaps and, therefore, jumps in the level. empty blocks existent in the level, neb ; number of
Unpredictability has been identified as an important coin blocks pressed over the total number of coin
factor of playing experience [16]. blocks existent in the level, ncb ; number of powerup
• Number of direction switches, S. No direction switch blocks pressed over the total number of powerup
means that the player needs to move from left to right blocks existent in the level, np ; and the sum of all
in order to complete the level, as in the original Super blocks pressed or destroyed over the total number
Mario Bros. If one or more direction switch is present, of blocks existent in the level nb = neb + ncb + np .
the level direction will be mirrored at certain points, Death: number of times the player was killed: by an op-
forcing the player to turn around and go the other way, ponent, do ; by jumping into a gap, dg ; by jumping
until reaching the end of the level or the next switch. into a gap over the total number of deaths dj .
The selection of these particular controllable features was Kill: number of opponents died from stomping over the
done after consulting game design experts, and with the total number of kills, ks ; number of opponents
intent to find features which where common to most, if not died from fire-shots over the total number of kills,
all, platform games. kf ; total number of kills over total number of
Two states (low and high) for each of the four controllable opponents, kT ; number of opponent kills minus
parameters above are investigated. The combinations of these number of deaths caused by opponents, kP ; and
states result in 24 = 16 different variants of the game which number of cannonballs killed, kc .
are used in the user study designed. In the Super Mario Bros Misc: number of times the player shifted the mode (Small,
game investigated here the number of coins, opponents, coin Big, Fire), nm ; number of times the run button
blocks, powerup blocks and empty blocks are fixed to 15, 3, was pressed, nr ; number of ducks, nd ; number of
4, 2, and 8 respectively. cannonballs spawned, ncs ; and whether the level
was completed or not C (boolean).
B. Gameplay features C. Reported player experience and experimental protocol
Several statistical features are extracted from playing We designed a game survey study to solicit pairwise
data which are logged during gameplay and include game emotional preferences of subjects playing different variants
completion time, time spent on various tasks (e.g. jumping, of the test-bed game by following the experimental protocol
running), information on collected items (e.g. type and proposed in [7]. Each subject plays a predefined set of four
amount), killed enemies (e.g. type, amount, way of killing) games in pairs: a game pair of game A and game B played in
and information on how the player died. The choice of those both orders. The games played differ in the levels of one or
specific statistical features is made in order to cover a decent more of the four controllable features presented previously.
amount of Super Mario Bros playing behavior dynamics. In For each completed pair of games A and B, subjects report
addition to the four controllable game features that are used their emotional preference using a 4-alternative forced choice
to generate Super Mario Bros levels presented earlier, the (4-AFC) protocol:
following statistical features are extracted from the gameplay • game A [B] was/felt more E than game B [A] game
data collected and are classified in five categories: jump, (cf. 2-alternative forced choice);
time, item, death, kill and misc. • both games were/felt equally E or
Jump: difference between the total number of jumps, J, • neither of the two games was/felt E.
minus the number of gaps, G; number of jumps Where E is the emotional state under investigation and
over gaps or without any purpose (e.g. to collect an contains fun, challenging, boring, frustrating, predictable and
item, to kill an opponent), J 0 ; difference between anxious. The selection of these six states is based on their
J 0 and the number of gaps, G; and a jump difficulty relevance to computer game playing and their popularity
heuristic, Jd , which is proportional to the number when it comes to game-related user studies [17]. In this
of Super Mario deaths due to gaps, number of gaps initial investigation of player experience we focus only on
and average gap width. three emotions: fun, challenge and frustration.Data is collected over the Internet. Users are recruited [18]. A generational genetic algorithm (GA) is implemented,
via posts on blogs and mailing lists and directed to a web using a fitness function that measures the difference between
page containing a Java applet implementing the game and the subject’s reported emotional preferences and the relative
questionnaire2 . As soon as the four games are played and magnitude of the corresponding model (ANN) output.
the questionnaire is completed, all the features (controllable,
gameplay and player experience) are saved in a database at V. F EATURE S ELECTION
the server hosting the website and applet. Data collection is We would like our model to be dependent on as few
still in progress and at the moment of writing, 181 subjects features as possible, both to make it easier to analyze, and
have participated in the survey experiment. The minimum to make it more useful for incorporation into future games
number of experiment participants required is determined for purposes of e.g. content creation. Therefore, feature
by C216 = 120, this being the number of all combinations selection is utilized to find the feature subset that yields that
of 2 out of 16 game variants. The experimental protocol is most accurate user model and save computational effort of
designed in such a way that at least 2 preference instances exhaustive search on all possible feature combinations. The
should be obtained for each pair of the 16 game variants quality of the predictive model constructed by the preference
played in both orders (1 preference instance per playing learning outlined above depends critically on the set of input
order). The analysis presented in this paper is based on the data features chosen. Using the extracted features described
240 game pairs (480 game sessions) played by the first 120 earlier the n best individual feature selection (nBest), the Se-
subject participants. quential Forward Selection (SFS) and the Perceptron Feature
Selection (PFS) schemes are applied and compared.
IV. P REFERENCE L EARNING FOR M ODELING P LAYER
E XPERIENCE A. nBest
Based on the data collected in the process described above, nBest feature selection ranks the features used individually
we try to approximate the function from gameplay features in order of model performance; the chosen feature set of size
(e.g. number of coins gathered) and controllable game level n is then the first n features in this ranking. The nBest method
features (e.g. number of gaps) to reported emotional prefer- is used for comparative purposes, being the most popular
ences using neuroevolutionary preference learning. technique for feature selection.
The data is assumed to be a very noisy representation of B. SFS
the underlying function, given the high level of subjectivity
SFS is a bottom-up search procedure where one feature is
of human preferences and the expected variation in playing
added at a time to the current feature set. The feature to be
styles. Together with the limited amount of training data,
added is selected from the subset of the remaining features
this makes overfitting a potential hazard and mandates that
such that the new feature set generates the maximum value
we use a robust function approximator. We believe that
of the performance function over all candidate features for
a non-linear function such as an artificial neural network
addition. The SFS method has been successfully applied to
(ANN) is a good choice for approximating the mapping
a wide variety of feature selection problems, yielding high
between reported emotions and input data. Thus, a simple
performance values with minimal feature subsets [7], [19]
single-neuron (perceptron) is utilized for learning the relation
between features (ANN inputs) — selected from feature C. PFS
selection schemes presented in Section V — and the value The third method we investigate is Rosenblatt’s perceptron
of the investigated emotional preference (ANN output) of as a methodology for selecting appropriate feature subsets.
a game. The main motivation for using a single neuron Our algorithm which is similar to [20] is adjusted to match
instead of a multi-layered perceptron (MLP) in this study preference learning problems. Thus, the perceptron used
is that we want to be able to analyze the trained function employs the sigmoid activation function in a single output
approximator. While an MLP can potentially approximate neuron. The ANN’s initial input vector has the size of
the function investigated with a higher accuracy, it is much the number of features examined. The perceptron feature
easier for a human to understand the obtained function when selection (PFS) procedure is as follows:
represented as a single-neuron ANN.
Step 1Use artificial evolution to train the perceptron on
The single neuron uses the sigmoid (logistic) activation
the pairwise preferences (see Section IV). Perfor-
function; connection weights take values from -5 to 5 to
mance of the perceptron is evaluated through 3-fold
match the normalized input values that lie in the [0, 1]
cross-validation. The initial input vector consists of
interval. Since there are no prescribed target outputs for the
all features extracted F (40 in this paper).
learning problem (i.e. no differentiable output error func-
Step 2Eliminate all features F 0 whose corresponding ab-
tion), ANN training algorithms such as back-propagation are
solute connection weight values are smaller than
inapplicable. Learning is achieved through artificial evolution
E{|w|} − σ{|w|}, where w is the connection
by following the preference learning approach presented in
weight vector.
2 The game and questionnaire are available at Step 3If F 0 = ∅ continue to Step 4, otherwise use the
www.bluenight.dk/mario.php remaining features and go to Step 1.Step 4Evaluate all feature subsets obtained using the and A ≺ B selection occurrences over all 240 preference
neuro-evolution preference learning approach pre- instances for different emotional states varies from 78.7%
sented in Section IV. (challenge) to 62.9% (frustration). These percentages provide
Note that all three methods are incomplete. Neither is some first evidence that the selected game level and rule
guaranteed to find the optimal feature set since neither parameters have an dissimilar impact on the emotional states
searches all possible combinations (they are all variants of investigated. For instance, challenge appears to be very
hill-climbing). To evaluate the performance of each input much affected by varying the selected parameters whereas
feature subset, the available data is randomly divided into frustration, on the contrary, does not appear as an emotion
thirds and training and validation data sets consisting of which is directly affected by variations in the game.
2/3 and 1/3 of the data respectively are assembled. The
performance of each user model is measured through the TABLE I
average classification accuracy of the model in three inde- T OP TEN STATISTICALLY SIGNIFICANT ( P - VALUE < 1%) CORRELATION
pendent runs using the 3-fold cross-validation technique on COEFFICIENTS BETWEEN REPORTED EMOTIONS AND EXTRACTED
the three possible independent training and validation data FEATURES .
sets. Since we are interested in the minimal feature subset
Fun Challenge Frustration
that yields the highest performance we terminate the SFS
ns 0.345 C −0.600 C −0.826
selection procedure when an added feature yields equal or
ncb 0.311 np −0.480 np −0.815
lower validation performance to the performance obtained kT 0.256 dj 0.469 ncb −0.688
without it. On the same basis, we store all feature subsets nr 0.253 dg 0.447 dg 0.578
selected by PFS and explore the highest performing subset tL 0.237 Jd 0.439 dj 0.564
starting with the smallest feature subset generated. kP 0.222 E{Gw } 0.409 nI −0.544
tr 0.192 nd −0.368 ts 0.520
tll −0.312 kf −0.515
VI. S TATISTICAL A NALYSIS ncb −0.292 tll −0.513
This section describes testing for correlations between G −0.287 nc −0.511
playing order, controlled features and gameplay features and
the reported emotions of fun, challenge and frustration.
To check whether the order of playing Super Mario game
variants affects the user’s judgement of emotional prefer- A. Fun
ences, we follow the order testing procedure described in
[6] which is based on the number of times that the subject Statistically significant correlations are observed between
prefers the first or the second game in both pairs. The reported fun and seven features: number of times the player
statistical analysis shows that order of play does not affect kicked a turtle shell, proportion of coin blocks that were
the emotional preferences of fun and frustration; however a “pressed” (jumped at from below), proportion of opponents
statistically significant effect is observed in challenge pref- that were killed, number of times the run button was pressed,
erences (p-value = 0.006). The effect reveals a preference proportion of time spent moving left, number of enemies
for the second game played which implies the existence killed minus times died, and proportion of time spent run-
of random noise in challenge preference expression. On ning. All of these were positive correlations.
the other hand, the insignificant order effects of fun and Such correlations draw a picture of most players enjoying
frustration, in part, demonstrate that effects such as a user’s a fast paced game that includes near-constant progress, plenty
possible preference for the very first game played and the of running, many enemies killed and many coins collected
interplay between reported emotions and familiarity with the from bouncing off the coin blocks. One might argue that
game are statistically insignificant. this picture fits with the concept of Flow, in that the player
More importantly, we performed an analysis for explor- makes unhindered progress [3]. However, the Flow concept
ing statistically significant correlations between subject’s also includes a certain level of challenge, and no features
expressed preferences and extracted features. that signify challenge are associated with fun in this case.
PNCorrelation
coefficients are obtained through c(z) = i=1 {zi /Ns },
s
It might be that players enjoy when the game is easy — at
where Ns is the total number of game pairs where subjects least when they only play a single level of the game.
expressed a clear preference for one of the two games (e.g. The feature that correlates the most with fun preferences is
A B or A ≺ B) and zi = 1, if the subject preferred kicking turtle shells. Kicking a turtle shell is a simple action
the game with the larger value of the examined feature and which often results in the unfolding of a relatively complex
zi = −1, if the subject chooses the other game in the game sequence of events, as the shell might bounce off walls, kill
pair i. Note that, Ns is 161, 189 and 151 respectively, for enemies, fall into gaps etc. The fun inherent in setting of
reported fun, challenge and frustration complex chains of events with simple actions is something
The variation of the Ns numbers above indicates, in part, many players can relate to and which features prominently
the difficulty in expressing a clear emotional preference in many games, but which is to our knowledge not part of
on different game variants. The percentage of A B any of the “established” theories of what makes games fun.B. Challenge as a result of not collecting power-ups is rarely in the Fire
Eighteen features are significantly correlated with chal- Mario state (necessary to shoot fireballs). But frustration can
lenge. The ten most highly correlated are (+/− in paren- also be very well predicted from not winning the level and
thesis signifies positive or negative correlation): whether the from falling into gaps often, just like challenge.
level was completed (−), proportion of power-up blocks D. Controllable features and intra-correlations
pressed (−), proportion of Mario deaths that were due to When only looking at linear correlations, it would appear
falling into a gap (+), number of times Mario died from that fun is not connected to any of the four controllable
falling into a gap (+), jump difficulty (+), average width of features. Fun is also less strongly correlated with gameplay
gaps (+), number of times Mario ducked (−), proportion of features than is the case for challenge and frustration. The
time spent in the last life (−), proportion of coin blocks that latter two emotions are easier to model with linear models,
were pressed (−), and the number of gaps (−). In addition, and are also strongly correlated with controllable features,
a weaker but still significant positive correlation was found namely gap entropy, gap width and number of gaps.
between gap entropy, Hg , and challenge. The three emotions are also all significantly (p-value <
A first observation is that it is obviously much easier to 0.001) correlated to each other. The correlation coefficient
predict challenge than to predict fun — many more features c(z) between challenge and fun and between challenge and
are significantly correlated, and the correlations are stronger. frustration is 0.346 and 0.462, respectively, while the corre-
It also seems that challenge is somehow orthogonal to fun, as sponding correlation between fun and frustration is −0.284.
almost none of the features that are correlated with challenge The positive effect of challenge on fun and frustration,
are correlated with fun. The exception is the proportion combined with the negative effect of fun on frustration
of coin blocks pressed, but while this feature is positively indicate the nonlinearity (and possibly complexity) of those
correlated with fun it is negatively correlated with challenge. emotions’ interrelationships.
(This is somewhat expected: if the level is so hard that the
player has to struggle to survive it, she does not have time VII. N ONLINEAR P REFERENCE M ODELLING
to make detours in order to collect more coins.) The correlations calculated above provide linear relation-
Most of the correlations are easy to explain. That a level ships between individual features and reported emotions.
is perceived as less challenging if you complete it should not However, these relationships are most likely more complex
come as a surprise to anyone. Likewise, we can understand than can be captured by linear models. The aim of the analy-
that players think a level is hard when they repeatedly sis presented below is to construct non-linear computational
die from falling into gaps. Three particularly interesting models for reported emotions and analyze the relationship
correlations are those between the controllable features and between the selected features and expressed preferences.
challenge: increase in gap width, E{Gw }, and gap entropy, For this purpose we evolve weights for nonlinear percep-
Hg , imply increased challenge whereas increased number trons as described in Section IV. The weights of the highest
of gaps, G, implies a linear decrease of challenge. These performing networks are presented in Table II. All evolved
effects suggest that challenge can be controlled to a degree networks performed much better than networks with random
by changing the number, width and distribution of gaps. weights, which reached chance level prediction accuracy.
The correlation with number of ducks would have been
TABLE II
easy to explain — if it was positive. The main reason for
L EARNING FROM P REFERENCES : F EATURES AND C ORRESPONDING
ducking in Super Mario Bros (at least in the tested levels) is
C ONNECTION W EIGHTS FOR H IGHEST P ERFORMING ANN S
to avoid cannonballs. To the authors, cannons are perceived
as some of the most difficult elements on a level. However, Fun Challenge Frustration
players reported lower challenge on levels where they ducked tL 4.905 ts −1.703 ts 3.267
many times. We have yet to find an explanation for this. ks 0.942 Jd 3.805 tll −1.851
L −3.873 neb −1.502 Jd −0.995
C. Frustration kc 1.073 dg 0.233
ks −0.189
Twenty-eight features are significantly correlated with
frustration, and some of the correlations are extremely strong.
Of the top ten correlated features, most are also in the top A. Fun
ten list for features correlated with challenge, and correlated In the comparison between the three different selection
in the same way. The exceptions are proportion of collected mechanisms applied it is evident that SFS has advantages
items (−), time spent standing still (+), proportion of killed over nBest and PFS for fun preferences (see Fig. 2(a)). nBest
opponents that were killed with fireballs (−), and proportion achieves a satisfactory performance (67.92%) but requires
of coins collected (−). 10 features as inputs to the ANN. PFS generates the lowest
From these new features, it seems that a frustrated player is classification accuracies; its best network has an accuracy of
most likely one that spends time standing still and thinking 63.52% with a selected subset of 11 input features.
about how to overcome the next obstacle; is far too busy The best obtained perceptron model of fun preferences
overcoming obstacles to collect coins and power-ups; and is designed by SFS. This model achieves a performanceof 69.18% which is with a selected feature subset of size
75 three. The selected perceptron input vector consists of the
PFS time spent moving left tL , the number of opponents died
nBest
70 SFS from stomping over the total number of kills, ks , and
the controllable switching feature which is defined as the
65 percentage of level played in the left direction L3 .
Fun is the least correlated of the three modeled emotions,
Performance (%)
60 and the hardest to model with a nonlinear perceptron as
well. Still, it’s remarkable that this complex emotion can
55 be predicted to a moderate degree simply by observing that
Mario keeps running left and kills enemies by stomping.
50
B. Challenge
45 The best-performing ANN for challenge prediction has an
accuracy of 77.77%. It is more complex than the best fun
40 predictor, using five features: time spent standing still (−),
1 2 3 4 5 6 7 8 9 10 11 12 13 14 15
Number of features jump difficulty (+), proportion of coin blocks pressed (−),
(a) Fun number of cannonballs killed (−) and proportion of kills by
80
stomping (−). While the jump difficulty heuristic has the
PFS largest corresponding weight — a testament to the central
nBest role of gap placement and size for challenge — it is also the
SFS
75
only feature related to gaps used by this model, pointing to
the adequateness of this particular heuristic.
70
C. Frustration
Performance (%)
Our best evolved ANN for predicting frustration has an
65
accuracy of 88.66%. We can predict with near-certainty
whether the player is frustrated by the current game by just
60
calculating the time spent standing still (+), the proportion
of time spent on last life (−), the jump difficulty (−), and
55 the proportion of deaths due to falling in gaps (+).
Somewhat surprisingly, time spent standing still counts
50
against challenge, whereas it is a strong positive predictor
1 2 3 4 5 6 7 8 9 10 11 12 13 14 15
Number of features
of frustration. This observation could be valuable if trying to
design a feedback system that keeps the game challenging
(b) Challenge
but not frustrating. Another feature that has different effect on
PFS
challenge and frustration is jump difficulty, where frustration
nBest is connected with lower jump difficulty. Maybe the player
SFS
85 gets frustrated by falling into gaps that she knows are not
that hard.
80
That the player feels frustrated when dying after a short
Performance (%)
time during his last life is understandable — many players
feel that their last attempt should be their best. Additionally,
75
a high frustration level can cause the player to care less about
the game and play worse in her final life.
70
VIII. D ISCUSSION
65
While we have found relatively good predictors for all
three emotions, two problems remain: the predictions (at least
for fun and challenge) are still not as good as we would
60
1 2 3 4 5 6 7 8 9 10 11 12 13 14 15 like them to be, and we cannot reliably predict fun from
Number of features
controllable features. As controllable features (such as level
(c) Frustration
3 The L feature is there to correct for the fact that when the level direction
Fig. 2. Performance comparison of feature selection mechanisms on switches, Mario moves right rather than left to move forward, and so tL
emotional preferences. is diminished. This points to an oversight on our part when designing the
gameplay features: we should have measured the time spent moving towards
the end of the level rather than moving left.design parameters) are those that we can vary, and therefore environments for this game using artificial evolution with
those that can be optimized by evolution or other global the induced player experience models as fitness functions.
optimizers, we need to be able to predict emotions at least
ACKNOWLEDGMENTS
partly from controllable features.
This points to the need for better models and/or features. The authors would like to thank Aki Järvinen and Markus
First of all, we will try to induce multi-layer perceptron Persson for insightful discussions, and all subjects that par-
models of emotional preferences. MLPs have the advantage ticipated in the experiments.
of universal approximation capacity; in particular, combina- R EFERENCES
torial relationships (such as XOR) can be represented. We
[1] C. Bateman and R. Boon, 21st Century Game Design. Charles River
might very well have a situation were one controllable feature Media, 2005.
(such as gap width) can be both negatively and positively [2] K. Isbister and N. Schaffer, Game Usability: Advancing the Player
connected with an emotion (such as frustration) depending Experience. Morgan Kaufman, 2008.
[3] M. Csikszentmihalyi, Flow: the Psychology of Optimal Experience.
on the player’s playing style, as measured through gameplay Harper Collins, 1990.
features (such as number of jumps). Such relationships can [4] R. Koster, A theory of fun for game design. Paraglyph press, 2005.
be captured by MLPs but not by nonlinear perceptrons. [5] J. Juul, Half-real. MIT Press, 2005.
[6] G. N. Yannakakis and J. Hallam, “Towards optimizing entertainment
Data collection is continuing at the time of writing, and in computer games,” Applied Artificial Intelligence, vol. 21, pp. 933–
probably at the time of reading (the reader is welcome to 971, 2007.
contribute by visiting the project’s web site), the new data [7] ——, “Entertainment modeling through physiology in physical play,”
International Journal of Human-Computer Studies, vol. 66, pp. 741–
will be used to improve the accuracy of our predictions. 755, 2008.
Depending on the success of finding predictors partly [8] J. Togelius, R. De Nardi, and S. M. Lucas, “Towards automatic
dependent on controllable features, we might need to design personalised content creation in racing games,” in Proceedings of the
IEEE Symposium on Computational Intelligence and Games, 2007.
new controllable features or revise the existing ones. New [9] K. Compton and M. Mateas, “Procedural level design for platform
features might include the number and type of enemies, the games,” in Proceedings of the Artificial Intelligence and Interactive
existence of dead ends in the level (forcing backtracking) etc. Digital Entertainment International Conference (AIIDE), 2006.
After good models have been learned, evolutionary algo- [10] M. J. Nelson, C. Ashmore, and M. Mateas, “Authoring an interactive
narrative with declarative optimization-based drama management,”
rithms will be used to optimize the level design parameters in Proceedings of the Artificial Intelligence and Interactive Digital
(relating to gaps and switches) for different objectives. We Entertainment International Conference (AIIDE), 2006.
hope to, this way, be able to generate levels that tailor the [11] C. Browne, “Automatic generation and evaluation of recombination
games,” Ph.D. dissertation, Queensland University of Technology,
playing experience according to the needs of the game design Brisbane, Australia, 2008.
(e.g. a challenging level combined with a non-frustrating [12] J. Marks and V. Hom, “Automatic design of balanced board games,”
experience). The success of our optimization attempts will in Proceedings of the Artificial Intelligence and Interactive Digital
Entertainment International Conference (AIIDE), 2007, pp. 25–30.
be validated with further user studies. [13] J. Togelius and J. Schmidhuber, “An experiment in automatic game
Another question concerns the generality of the results design,” in Proceedings of the IEEE Symposium on Computational
gathered here — do they apply to just the players and Intelligence and Games, 2008.
[14] G. N. Yannakakis and J. Hallam, “Real-time Game Adaptation for
the particular game tested here, or do they have wider Optimizing Player Satisfaction,” IEEE Transactions on Computational
applicability? We venture that, as Super Mario Bros more Intelligence and AI in Games, 2009, (to appear).
or less defined the platform game genre, the results apply [15] C. Pedersen, J. Togelius, and G. Yannakakis, “Optimization of platform
game levels for player experience,” in Proccedings of the Artificial
to some extent to all games of the same genre. Further, the Intelligence and Interactive Digital Entertainment International Con-
population of experimental subjects is believed to be very ference (AIIDE), 2009.
diverse, but this needs to be verified. A possible critique is [16] T. W. Malone, “What makes computer games fun?” Byte, vol. 6, pp.
258–277, 1981.
that the emotions reported are those that have been elicited [17] R. L. Mandryk and M. S. Atkins, “A Fuzzy Physiological Approach
after only a few minutes of play. It is possible that challenge for Continuously Modeling Emotion During Interaction with Play
or variety (gap entropy) would factor in more if play sessions Environments,” International Journal of Human-Computer Studies,
vol. 65, pp. 329–347, 2007.
were longer, so subjects would have had a chance of getting [18] G. N. Yannakakis and J. Hallam, “Game and Player Feature Selection
bored with the game. for Entertainment Capture,” in Proceedings of the IEEE Symposium on
Computational Intelligence and Games. Hawaii, USA: IEEE, April
IX. C ONCLUSIONS 2007, pp. 244–251.
[19] G. N. Yannakakis, M. Maragoudakis, and J. Hallam, “Preference
We designed a user study focused on a version of the Super Learning for Cognitive Modeling: A Case Study on Entertainment
Mario Bros platform game, in which a population of subjects Preferences,” IEEE Systems, Man and Cybernetics; Part A: Systems
played in a number of different versions (mainly differing in and Humans, 2009, (to appear).
[20] M. Mejia-Lavalle and G. Arroyo-Figueroa, “Power System Database
the game environments encountered). Controllable features Feature Selection Using a Relaxed Perceptron Paradigm,” in Proceed-
and emergent gameplay features were correlated with re- ings of 5th Mexican International Conference on Artificial Intelli-
ported emotions during gameplay. We found a large number gence, LNCS. Springer Berlin/Heidelberg, 2006, pp. 522–531.
of statistically significant correlations, and were able to train
good predictors of player emotions using preference learning
and neuroevolution. These results will be improved upon
and form the basis for attempts to automatically generateYou can also read