Monitoring the Weather - American Meteorological Society
←
→
Page content transcription
If your browser does not render page correctly, please read the page content below
Chapter 1
                                                          Monitoring the Weather

             LEARNING OBJECTIVES
             •    Distinguish between weather and climate, meteorology and climatology.
             •    List some of the readily available sources of regional and national weather information.
             •    Explain why the drawing of a weather map requires weather observations that are
                  simultaneous.
             •    Identify the principal weather systems that are plotted on a surface weather map.
             •    Distinguish between the types of weather usually associated with high pressure systems
                  and low pressure systems.
             •    Characterize the relationship between air masses and fronts.
             •    Distinguish between geostationary and polar-orbiting weather satellites.
             •    Identify the advantages of infrared satellite images versus visible satellite images in
                  monitoring the Earth-atmosphere system.
             •    Present the fundamental principles of weather radar.
             •    Give some examples of how the habit of observing the sky and changing cloud cover might
                  provide indications of future changes in the weather.

                                             Central Queson
                 What are some basic characteriscs of the atmosphere and weather?

           Case-in-Point
                                Blizzards then and now

        Across the Dakota Territory and Nebraska, 12 January 1888 began mild, almost spring-like, a welcome
respite from several weeks of persistent bitter cold. Farmers took advantage of the pleasant weather, attending to
chores in pastures a distance from the safety of their homes. Neither farmers nor other residents of the isolated
settlements that dotted the Northern Prairie could know a ferocious blizzard was sweeping southeastward over
eastern Montana and bearing down on the Dakota Territory and Nebraska. The blizzard struck suddenly with
winds strengthening to gale-force, plunging temperatures, and swirling snow that cut visibility to near zero. In
some places the wind-chill plummeted to near −40°C (−40°F). Anyone caught out in the open became disori-
ented, unable to find their way to shelter.
        In Nebraska, the storm hit just as school let out for the day. Because the day started mild, students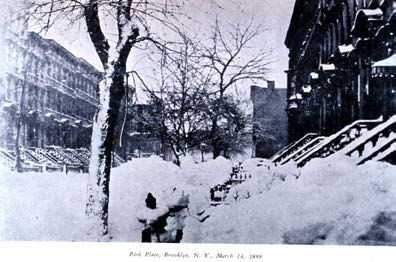
dressed inadequately for the deteriorating conditions, trudging home from country schools through blinding
snow and cold winds. More than a hundred of them never made it to their destinations, victims of exposure
(hypothermia). All told, as many as 500 people perished from the storm, the deadliest blizzard on record in the
American prairie. Because so many school children perished, the storm is referred to as the Children’s Blizzard.
        About two months later, on 12–14 March 1888, a powerful coastal storm (nor’easter) accompanied by
heavy snow and strong winds blasted the Eastern Seaboard from Washington, DC, northward into southern New
England. A nor’easter is a storm that tracks offshore, parallel to the Atlantic coast, and is named for the strong
northeast winds that affect coastal areas. This Blizzard of ‘88 brought to a standstill virtually all activity. Par-
ticularly hard hit was New York City, which reported a three-day snowfall total of 53 cm (21 in.) (Figure 1.1).
Winds up to 65 km per hr (40 mph) whipped snow into drifts 4.5–6.0 m (15–20 ft.) deep. Much greater snow-
falls (generally 100–125 cm or 40–50 in.) and deeper snowdrifts (to 12 m or 40 ft.) were reported over south-
eastern New York, western Connecticut, and western Massachusetts. On land, more than 300 people lost their
lives to exposure, accidents, or overexertion, while at sea almost 200 ships sunk or were damaged with nearly
100 lives lost. Hundreds of trains stalled in deep snow drifts, marooning passengers for days, and telephone and
telegraph lines were severed all over the Northeast.

   Figure 1.1
   Scene of the aftermath of the blizzard of 12–14 March 1888 at Park Place in Brooklyn, NY. [Courtesy of NOAA
   Photo Library, Historic NWS Collection]

        The Children’s Blizzard and the Blizzard of ‘88 surprised the people impacted. At the time, the U.S.
Army Signal Corps had operated the nation’s weather service for more than 17 years, and observers at 154
weather stations nationwide telegraphed weather observations three times a day to headquarters in Washington,
DC. Indications (later called weather forecasts) were issued based on surface weather observations alone. In
St. Paul, MN, an experimental office was charged with forecasting cold waves and blizzards for the Northern
Plains. The technology of the day and limited understanding of the atmosphere put meteorologists at a distinct
disadvantage in forecasting storms, especially nor’easters that track offshore. There was no means of monitoring
the upper atmosphere, no satellites, no radar, no wireless communications with ships at sea, and no computer
models for forecasting the weather.
        Efforts to communicate weather warnings to the public were often unsuccessful. The public received
most (if not all) of their weather information from newspapers that could be a day or two old. The officer in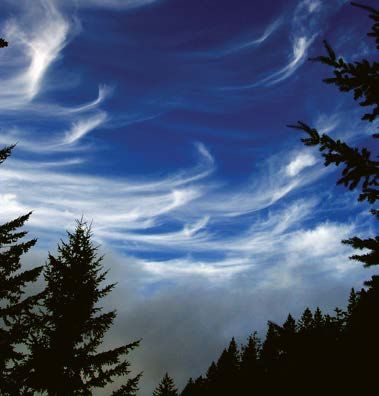
charge of the St. Paul office knew a blizzard headed toward the Dakota Territory and Nebraska and sent warn-
ings via telegraph. However, the telegraph lines ran along the railroad tracks, too far away from most of the
region’s residents for them to receive any advance warning.
         The historic blizzards of 1888 were rivaled in ferocity by four nor’easters that hit major metropolitan ar-
eas of the mid-Atlantic during the winter of 2009-10, and more recently the January 2016 blizzard. Each 2009-
10 storm brought widespread 25–50 cm (10–20 in.) swaths of wind-driven snowfall, with greater amounts lo-
cally. Three of the 2010 storms impacted the 15 million residents of the Washington, DC-Philadelphia, PA urban
corridor. Two arrived back-to-back (4–7 and 9–11 February), causing widespread power outages and shutting
down commercial aviation, ground transportation, shipping, and the local economy. School systems closed for
at least a week and offices of the Federal Government closed four successive days. These storms were primarily
responsible for establishing seasonal snowfall records in Richmond, VA (71.1 cm or 28.0 in.), Washington, DC
(142.2 cm or 56.0 in.), Baltimore, MD (195.6 cm or 77.0 in.), and Philadelphia, PA (199.9 cm or 78.7 in.).
         The 22–24 January 2016 snowstorm rated a rare Category 5 “Extreme” for the northeastern U.S. on the
National Oceanic and Atmospheric Administration (NOAA) Regional Snowfall Index. Unlike the 1888 storms,
forewarning arrived up to a week in advance with extensive preparation. Meteorologists issued blizzard warn-
ings and stressed the potential historical nature of the snowstorm. Eleven states and Washington, DC had pre-
storm state of emergency declarations and thousands of members of the U.S. National Guard readied. Among
numerous storm-related impacts, thousands of flights were cancelled, New York City and Newark, NJ were
placed under travel bans, and a significant portion of the Washington, DC-area Metro bus and train service was
suspended. Significant amounts of snow fell over a large swatch of the Mid-Atlantic and Northeast (Figure 1.2).
NOAA reported that 102.8 million people were impacted by the snowstorm, with 24 million of those experienc-
ing snowfall in excess of about 51 cm (20 in.) and 1.5 million with snow exceeding 76 cm (30 in.). The maxi-
mum snowfall was 107 cm (42 in.) at Glendary, WV. Despite the forewarning, 55 fatalities are attributed to the
storm.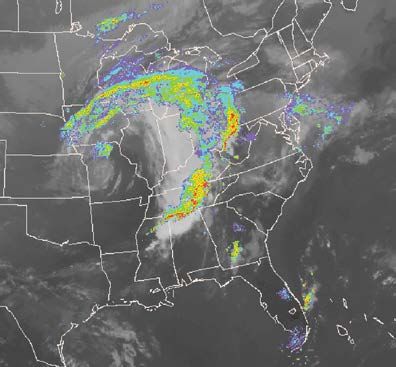
Figure 1.2
   (A) Total snowfall (in inches) from the 22–24 January 2016 snowstorm. The Northeast region received a Category
   5 “Extreme” rating on the Regional Snowfall Index. [Courtesy of NOAA]. (B) Post-storm snowfall in a Fairfax, VA
   neighborhood. [Photo by Jarek Tuszyński/Creative Commons]

         Weather forecasters were better prepared in 2009-10 and 2016 because the science of meteorology,
including the understanding of nor’easters, matured considerably since 1888. Today, Earth-orbiting weather
satellites continuously monitor a storm’s developing cloud shield and track its movements, radar locates snow
bands sweeping onshore, and observational data from the surface and upper atmosphere feed into sophisticated
numerical weather forecast models running on supercomputers. Well in advance of a storm’s arrival, the NOAA
National Weather Service (NWS) issues winter storm watches and warnings and rapidly communicates them to
the public and public service agencies. Some school districts and businesses announce closings more than 12
hours before the first snowflake is expected, giving people time to stock up on food and other supplies in case
they become marooned at home, as many were in the mid-Atlantic area during the winter of 2009-10 and the
January 2016 storm.
         While the historic winter storms of 1888, 2009-10, and 2016 clearly demonstrate how weather analy-
sis and forecasting benefited from advances in scientific knowledge and technology, there is still more to be
learned of Earth’s atmosphere. It is evident, for example, that atmospheric conditions favoring development
of nor’easters are linked to complex changes in the planetary-scale circulation. There is more on this topic in
Chapter 10.
         For more on the Children’s Blizzard, refer to: Laskin, D, 2004: The Children’s Blizzard. Harper Collins
Publishers, 307 pp.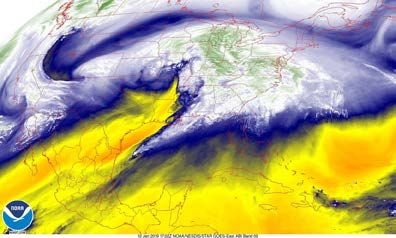
All about nor’easters

                                                                                   1   .1
                                                                          e   pt h
                                                             Topic in D

1.1 Introduction
        Weather Studies: Introduction to Atmospheric Science provides a systematic study of the dynamic
atmospheric environment. The textbook first explores weather observational techniques and basic scientific
principles that govern the atmosphere. It then investigates a wide variety of atmospheric phenomena ranging
from high and low pressure systems to tornadoes and hurricanes. The final chapters of delve into more special-
ized topics such as weather forecasting, atmospheric optics, and global climate change. The behavior of the
atmosphere is not arbitrary; rather its workings are explainable in scientific terms, drawn from many scientific
disciplines, such as physics and chemistry. Although the atmosphere is governed by natural laws, questions are
likely to persist regarding past, present, and future weather and climate.
        The textbook contains numerous “Topics in Depth” to enrich certain topics with videos, animations, and
links to weather imagery. Key to studying weather is combining textbook knowledge with current observations.
Some Topics in Depth will link directly to current weather maps.
        Chapter 1 introduces and describes tools and basic understandings that guide the investigation of the
atmosphere.

1.2 Weather and Climate
        Everyone experiences the weather and its far-reaching influence. Weather dictates how people dress,
drive, and choose recreational activities. Before setting out in the morning, most check the latest weather fore-
cast on their smartphone, computer, television, or radio, or even glance out the window to look at the sky. These
daily experiences help develop a basic understanding of how the atmosphere functions.
        Weather is defined as the state of the atmosphere at a particular place and time in terms of the current
value of quantitative variables such as temperature, humidity, cloudiness, precipitation, and wind speed and
direction. Thousands of weather stations around the world monitor weather variables at Earth’s surface at least
hourly every day. A place and time is specified when describing weather because the atmosphere is dynamic
and changes from one place to another and with time. When the weather is cold and snowy in New York City, it
might be warm and humid in Miami and hot and dry in Phoenix, and tomorrow’s weather may differ markedly
from today’s weather. If you don’t like the weather, wait a minute is an old saying that is not far from the truth
in many places. Meteorology is the study of the atmosphere, processes that cause weather, and the life cycle of
weather systems.
        While weather often varies from one day to the next, the weather of a particular location tends to follow
reasonably consistent seasonal variations, with temperatures higher in summer and lower in winter. Addition-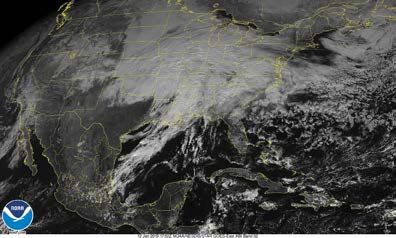
ally, the tropics are associated with warmer weather and less seasonal temperature contrasts than at higher lati-
tudes. Because arithmetic averages of weather elements (e.g., temperature, precipitation) taken over a span of
years are often the easiest way of describing typical weather conditions, climate has been traditionally defined
as weather conditions at a locality averaged over a specified time interval. By international convention, average
values of weather elements are computed for a 30-year period beginning with the first year of a decade. At the
close of a decade, the averaging period is moved forward ten years. In 2020, climatic summaries were based
on weather records from 1981–2010; in 2021 this shifted to a 1991–2020 averaging period. Thirty-year aver-
age monthly and annual temperatures and precipitation totals are used to describe the climate of a locality as
are average seasonal snowfall, length of growing season, percent of possible sunshine, and number of days with
dense fog. Climate is the ultimate environmental control in that it governs, for example, the cultivatable crops,
the fresh water supply, and the heating and cooling requirements for homes.
         In addition to average values of weather elements, the description of a locale’s climate encompasses
extremes in weather (e.g., highest and lowest temperature, greatest 24-hr snowfall and rainfall). Tabulation of
extreme values usually covers the entire period of record (or the period since observations were made at the
same location). Records of weather extremes provide information on the variability of climate at a particular
place and give a more complete and useful description of climate. Farmers, for example, are interested in know-
ing not only the average summer rainfall, but also the frequency of extremely wet or dry summers. Climatology
is the study of climate, its controls, and spatial and temporal variability.
         The definition of climate has expanded to describe the state of the climate system as a whole. The state
of Earth’s climate system, composed of the atmosphere, hydrosphere, cryosphere, lithosphere, and biosphere,
results from internal and external influences, mutual interactions, and feedbacks. Chapter 15 provides a detailed
look at Earth’s climate system.

                                   Global weather and
                                    climate extremes

                                                                              h   1.2
                                                                         e pt
                                                            Topic in D

1.3 Accessing Weather Information
         A key part of this course is accessing current weather data. Whether through a smartphone, computer,
television, or radio, weather information is available practically everywhere. Weathercasts are routine segments
of the local morning, noon, and evening news reports. All-news channels feature weather segments throughout
the day.
         Weather information can obtained by reading reports in local or national newspapers (in print or online)
or listening to the radio. Most newspapers include a weather column or page featuring maps and statistical sum-
maries. Radio stations provide the latest local weather conditions and forecasts, but may not include a summary
of weather conditions across the nation unless a newsworthy event has occurred, such as a tornado outbreak or
hurricane.
         Another rich source of weather information is the Internet, which provides access to national and re-
gional weather maps, satellite and radar images depicting large-scale cloud, precipitation, and atmospheric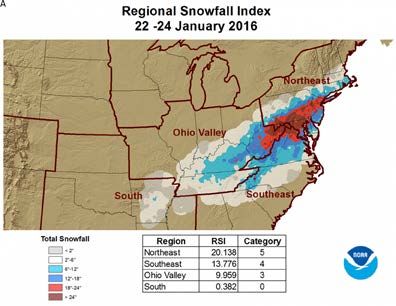
circulation patterns, weather forecasts, plus updates on environmental issues, such as trends in global climate,
stratospheric ozone, and air quality. All National Weather Service Forecast Offices maintain websites to display
a variety of current meteorological, climatological, and hydrological information. The course’s online RealTime
Weather Portal also contains a host of real-time weather data (Figure 1.3). There are hundreds of additional
websites that offer other types of weather services, such as live webcams, to view local weather conditions and
email or text alerts for severe weather events.

   Figure 1.3
   A tablet PC displaying a surface weather map linked from the RealTime Weather Portal. [Photo by E.W. Mills]

         Since the dawn of the computer era, a more efficient and much more popular way to retrieve weather
information is through weather software applications for desktops, laptops, and mobile devices. There are thou-
sands of different weather apps that disseminate a variety of weather data. From a local beach forecast to track-
ing real-time radar, apps have revolutionized the way people get weather information.
         A valuable source of local weather and climate information is the NOAA Weather Radio All Hazards
(NWR). As a public service, the National Weather Service (NWS), a line office of the National Oceanic and
Atmospheric Administration (NOAA), operates low-power, VHF high band FM radio transmitters that broadcast
continuous weather information (e.g., regional conditions, local forecasts, marine warnings, local climatological
statistics) directly from NWS Forecast Offices 24 hours a day, 7 days a week. A series of messages is repeated
every 4–6 minutes and some messages are updated hourly. When weather-related hazards threaten, NWS fore-
casters interrupt routine broadcasts and issue watches, warnings, or advisories.
         Working with federal, state, and local emergency managers and the Federal Communications Commis-
sion’s Emergency Alert System, the NWR provides the public with warnings and post-event information for
all types of hazards: weather, natural (e.g., earthquakes, tsunamis, volcanic eruptions), technological (e.g., oil
spills, chemical leaks), and other non-weather emergencies (e.g., terrorist attacks, Amber alerts, 911 Telephone
outages). The NWS works with federal, state and local emergency managers and the Federal Emergency Man-
agement Agency (FEMA) in broadcasting weather and non-weather (e.g., civil emergencies, evacuation, Amber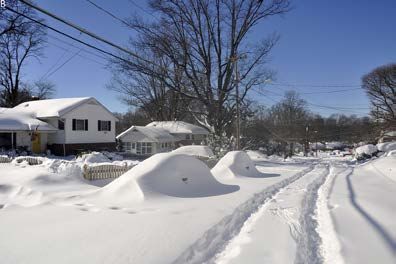
Alerts) emergency messages over NWR. In addition, many broadcasters monitor NWR for weather and non-
weather emergency messages conveyed to the Emergency Alert System.

                                            NWR staon
                                              lisngs

                                                                                h   1.3
                                                                           e pt
                                                              Topic in D

        A special weather radio is required to receive NWR transmissions because the seven broadcast frequen-
cies (from 162.40 to 162.55 MHz) are outside the range of standard AM/FM radios. Some weather radios are
designed to sound an alarm or switch on automatically when a weather watch or warning or other emergency
information is issued (Figure 1.4). The latest generation weather radio is equipped with the Specific Area Mes-
sage Encoding (S.A.M.E.) feature that sounds an alarm only if a weather watch or warning is issued for a spe-
cific county or limited local area programmed (selected) by the user. Depending on terrain, the maximum range
of NOAA weather radio broadcasts is approximately 65 km (40 mi.). More than 1000 transmitters are operating
in all 50 states, the District of Columbia, Puerto Rico, the U.S. Virgin Islands, and the U.S. Pacific Territories,
with the goal of bringing 95% of people in the U.S. and its territories within range of NOAA weather radio
broadcasts. In many communities, NOAA weather radio broadcasts are also available through audio program-
ming channels on television. Environment Canada’s Meteorological Service has transmitters at 185 sites in
its Weatheradio network, broadcasting in the nation’s two official languages. A few of the transmitters operate
on FM frequency, and most use the same broadcast frequencies as NWR. Over 90% of Canadians can access
Weatheradio broadcasts.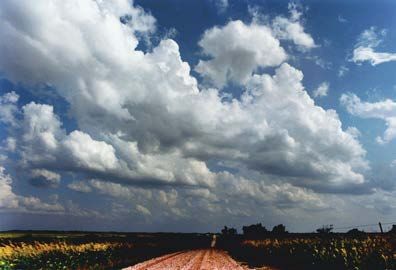
Figure 1.4
   At the push of a button, this weather radio broadcasts weather reports, forecasts, watches and warnings issued
   by the National Weather Service. [Courtesy of Bruce Thomas, Midland Radio]

1.4 Time Keeping
        Weather observations are made simultaneously at weather stations around the world. Simultaneous
observations are necessary if the state of the atmosphere over a large area is to be portrayed accurately on a
weather map at a specific time. This portrayal is also the basis for weather forecasting. Weather maps used in
this course are given in Z time (also known as Greenwich Mean Time). The meaning of Z time and the conven-
tional basis for time keeping are subjects of this section.
        For millennia, humans kept track of their activities by the daily motions of the Sun. Local noon was
a convenient reference, marking the time of day when the Sun reached its highest point in the observer’s sky.
However, locations only a few tens of kilometers to the east or west would have different Sun times. Begin-
ning in the mid-1800s, with advances in transportation and communication made possible by railroads and
telegraphs, travel east or west could be confusing and even potentially hazardous because of local time differ-
ences and the railroads argued for the standardized time keeping scheme we use today. Civil time zones were
instituted in the United States and Canada on 18 November 1883 to standardize time keeping in North America.
The concept of international time zones was officially adopted on 22 October 1884 at the International Meridian
Conference, held in Washington, DC.
        Time zones (Figure 1.5) were established based on longitude, which is measured as degrees east and
west of the prime meridian, which is zero degrees longitude. Because early astronomical determinations of
time had been made at The Old Royal Observatory in Greenwich, England, the 1884 Conference designated the
meridian of longitude passing through the observatory as the prime meridian. For more than 50 years, Green-
wich Mean Time (GMT) was used for meteorological observations. GMT is based upon the daily rotation of
Earth with respect to a “mean Sun.” Often the single letter Z (phonetically pronounced “zulu”) designated the
time within the Greenwich Time zone (centered on the prime meridian). Today, the preferred time system is the
more precise Coordinated Universal Time or Universel Temps Coordinné (UTC), based on an atomic clock and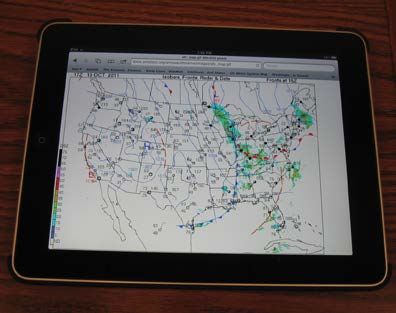
reckoned according to the stars. For practical purposes, Z, GMT, and UTC are equivalent.

                                                                                                 Atlanc
                                                                                                  8 am

                            Pacific
                             4 am           Mountain
                                                            Central            Eastern
                                             5 am
                                                             6 am               7 am

                                                                                            Atlanc
                   Hawaii                                                                    8 am
                    2 am
                                 Aleuan   Alaska
                                  2 am      3 am                                          Puerto Rico-
                                                                                          Virgin Islands

   Figure 1.5
   Times zones in the United States, Puerto Rico and the Virgin Islands, southern Canada, and northern Mexico
   showing Standard Times equivalent to 1200 Z.

        Earth makes one complete rotation (360°) on its axis with respect to the Sun once every 24 hrs. Hence,
Earth rotates through 15° of longitude every hour (360° divided by 24 hrs equals 15° per hr). Ideally, Earth
should be divided into 24 civil time zones each having a width of 15° of longitude. The central meridian of each
time zone is defined as a longitude that is evenly divisible by 15. For example, the central meridian of the Cen-
tral Time Zone in North America is 90°W longitude. Since 90° divided by 15 equals 6, Central Standard Time
(CST) is 6 hrs different from the time at Greenwich. Earth rotates eastward so that Greenwich time is ahead
of CST by 6 hrs. When it is noon at Greenwich, it is 7 a.m. Eastern Standard Time (EST), 6 a.m. CST, 5 a.m.
Mountain Standard Time (MST), and 4 a.m. Pacific Standard Time (PST).
        Boundaries between most time zones are adjusted to accommodate political boundaries of nations. In
a few cases, nations adhere to a local civil time that may differ by a half hour from the central meridian of that
time zone. To head off potential confusion, time is expressed according to a 24-hr clock so that, for example,
7:45 a.m. is 0745 and 2:20 p.m. is 1420. While most of the United States observes Daylight Saving Time, UTC
is fixed and does not shift to a summer schedule. Hence, it is necessary to adjust the time by one hour where and
when Daylight Saving Time is observed. During summer, residents of the U.S. Central Time Zone lag Green-
wich time by 5 hrs instead of 6 hrs. Hence, 0700 Central Daylight Time (CDT) = 0600 Central Standard Time
(CST) = 1200Z. Currently, Daylight Saving Time begins on the second Sunday of March (when time “springs
forward” one hour) and ends the first Sunday of November (when time “falls back” one hour).
Official U.S. me
1 .4
e pt h
Topic in D
By international agreement, surface weather observations are taken at least 4 times every 24 hrs at
0000Z, 0600Z, 1200Z, and 1800Z, with upper-air measurements via balloon-borne instruments (radiosondes)
made at 0000Z and 1200Z. In the United States, surface observations are taken hourly (at the top of the hour),
composite radar charts are also issued hourly at 35 minutes past the hour, and fronts are analyzed on weather
maps every 3 hrs beginning at 0000Z.
1.5 Weather Systems and Weather Maps
To make weather watching more meaningful and useful for this course, the remainder of this chapter is
devoted to a description of what to watch for, beginning with features plotted on the national weather map.
Temperature, dewpoint, wind, and air pressure are among the many atmospheric variables routinely
monitored by instruments at surface weather stations. These data are transmitted to a central facility where they
are assembled and plotted on surface weather maps. Special symbols are used on national weather maps to iden-
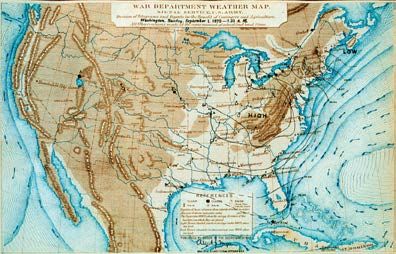
tify and locate the principal weather-makers, pressure systems and fronts (Figure 1.6). For an historical sketch
on the origins of weather maps, see For Further Exploration Essay 1.1 at the end of this chapter.H
L
L
H
FRONTS PRESSURE SYSTEMS PRECIPITATION
Cold air
Cold
Front Rain
Warm air
Drizzle
Cold air L H Rain shower
Warm Thunderstorm
Warm air
Front
Snow
Low High Snow shower
Cold air Pressure Pressure
Sta onary Fog
Warm air
Front
Figure 1.6
On a weather map, symbols represent the state of the atmosphere over a broad geographical area at a specific
time.
Pressure systems are of two main types, highs (or anticyclones) and lows (or cyclones). The high and
low designations refer to air pressure. We can think of air pressure as the weight per unit area of a column of
air that extends upward from Earth’s surface (or any altitude within the atmosphere) to the top of the atmo-
sphere. At any specified time, air pressure at Earth’s surface varies from one place to another. On a weather
map, H or High symbolizes the center of regions where the air pressure is high compared to surrounding areas.
Conversely, L or Low signifies the center of regions where the air pressure is low compared to surrounding
areas.Current pressure
system and fronts
1 .5
e pt h
Topic in D
As you examine weather maps, note the following about pressure systems:
● Highs (anticyclones) feature descending air and are usually accompanied by fair weather, hence they are
described as fair-weather systems. Highs that originate in northwestern Canada bring cold, dry weather
in winter and cool, dry weather in summer to much of the coterminous United States. Highs that develop
further south over land may bring hot, dry weather in summer and mild, dry weather in winter. Further-
more, summer winds around a warm high centered over the southeastern states transport warm, humid
air from the Gulf of Mexico over a broad swath of the eastern U.S. into southeastern Canada.
● Viewed from above in the Northern Hemisphere, surface winds in a high-pressure system blow in a
clockwise and outward spiral as shown in Figure 1.7A. Calm conditions or light winds are typical over a
broad area at the center of a high.
● Lows (cyclones) feature ascending air and typically produce cloudy, rainy, or snowy weather, hence they
are described as stormy-weather systems. An exception may be lows that develop over broad regions of
arid or semiarid terrain, such as the Desert Southwest, especially in summer. In such areas, intense solar
heating of the ground raises the air temperature and lowers the surface air pressure, producing a low that
remains stationary over the hot ground and is not accompanied by stormy weather.
● Viewed from above in the Northern Hemisphere, surface winds in a low-pressure system blow in a
counterclockwise and inward spiral as shown in Figure 1.7B.
● Both highs and lows move with the prevailing wind several kilometers above the surface, arcing gener-
ally eastward across middle latitude regions, such North America, and the weather changes at places in
their paths. Highs follow lows and lows follow highs causing the weather to shift from stormy to fair
and back again (which can be monitored as changes in air pressure). Chapter 10 has more to say about
the tracks of high and lows in the middle latitudes and Chapter 12 describes tropical low pressure sys-
tems.
● Lows that track across the northern United States or southern Canada are more distant from sources of
moisture and usually produce less rain or snowfall than lows that track further south (such as lows that
travel out of eastern Colorado and move along the Gulf Coast or up the Eastern Seaboard).
● Weather on the left side (west and north) of an extratropical cyclone’s track (path) tends to be relatively
cold, whereas weather on the right (east and south) of the cyclone’s track tends to be relatively warm.
For this reason, winter snows are more likely to the west and north of the path of a low-pressure system.A B
H L mb
992
4 mb mb
102 996
0 mb 0m
b
102 100
b
6m mb
101 1004
mb
1012 1008 m
b
Figure 1.7
Viewed from above in the Northern Hemisphere, winds near the Earth’s surface blow (A) clockwise and outward
from a high-pressure system, and (B) counterclockwise and inward into a low-pressure system. Blue lines are
isobars, passing through places with the same air pressure in millibars (mb). Isobars are drawn at intervals of 4
millibars.
Air masses and fronts are also important weather-makers. An air mass is a huge volume of air cover-
ing hundreds of thousands of square kilometers with relatively uniform temperature and humidity properties
horizontally. An air mass is typically associated with a large high pressure system and its specific characteristics
depend on the types of surfaces over which the air mass forms (its source region) and travels. Cold air masses
form at higher latitudes over surfaces that are often snow or ice covered, whereas warm air masses form in the
lower latitudes where Earth’s surface is relatively warm. Humid air masses form over moist maritime surfaces
(e.g., Pacific Ocean, Gulf of Mexico), whereas dry air masses develop over dry continental surfaces (e.g., Desert
Southwest, northwestern Canada). The four basic types of air masses are cold and dry, cold and humid, warm
and dry, and warm and humid.
A front is a transition zone between air masses that differ in temperature, humidity, or both. Fronts form
where contrasting air masses meet, and the associated air movements often give rise to cloudiness and precipita-
tion. The most common fronts are stationary, cold, and warm; weather map symbols for all three are shown in
Figure 1.6. As the name implies, a stationary front is just that, stationary (or nearly so). On both sides of a sta-
tionary front, winds blow roughly parallel to the front but in opposite directions. A shift in wind direction may
cause a portion of a stationary front to advance northward (becoming a warm front) or southward (becoming a
cold front).
At the same pressure, warm air is less dense than cold air so a warm air mass advances by gliding up and
over a retreating cold air mass. The cold air mass forms a wedge under the warm air mass. The leading edge of
warm air at the Earth’s surface is plotted on a weather map as a warm front (Figure 1.8A). On the other hand,
cold air advances by sliding under and pushing up the less dense warm air and the leading edge of cold air at the
Earth’s surface is plotted on a weather map as a cold front (Figure 1.8B). Consequently, the boundary between
warm and cold air associated with a warm front slopes more gently with altitude than does the boundary be-
tween warm and cold air associated with a cold front.A
Overriding
Warm Air
Warm Air Cool Air
B
Warm Air
Cold Air
Warm Air
Figure 1.8
The two most common types of fronts are (A) a warm front that marks the boundary between advancing relatively
warm (less dense) air and retreating cold (more dense) air, and (B) a cold front that marks the boundary between
advancing cold air and retreating warm air. In both diagrams the fronts are shown in vertical cross-section with the
vertical scale greatly exaggerated. The vertical scale in each diagram is approximately 10 km and the horizontal
scale on the order of 1000 km.Forecast maps
1 .6
e pt h
Topic in D
As you examine surface weather maps, note the following about air masses and fronts:
● In response to regular seasonal changes in the duration and intensity of sunlight, polar air masses are
much colder in winter and milder in summer. By contrast, in the tropics, sunlight is nearly uniform in
duration and intensity throughout the year so tropical air masses are warm and exhibit less seasonal
variation in temperature.
● An air mass modifies (becomes warmer, colder, more humid, drier) as it moves away from its source
region. The degree of modification depends on the properties of the surface over which the air mass
travels. For example, a cold air mass warms more if it travels over ground that is bare rather than snow-
covered.
● Fronts are three-dimensional and the map symbol for a front is plotted where the frontal surface inter-
sects Earth’s surface (as shown in Figure 1.6).
● Most cloudiness and precipitation associated with a warm front occur over a broad band, often hundreds
of kilometers wide, in advance of where the front intersects Earth’s surface. Widespread precipitation
ahead of a warm front generally is light to moderate in intensity and may persist at a particular location
for 12–24 hrs or longer.
● Most cloudiness and precipitation associated with a cold front occur as a narrow band along or just
ahead of where the front intersects Earth’s surface. Although precipitation often is showery and may last
from a few minutes to a few hours, it can be very intense.
● Wind direction (and at times wind speed) differs on opposite sides of a front.
● Some fronts are not accompanied by cloudiness or precipitation. A shift in wind direction, together with
changes in air pressure, temperature, and/or humidity typically accompany the passage of the front.
● In summer, air temperatures can be nearly the same ahead of and behind a cold front. In that case, the air
masses on opposite sides of the front differ primarily in humidity, the air mass ahead of the advancing
front is more humid (and therefore less dense) and the air mass behind the front is less humid (denser).
With passage of the front, refreshingly drier air replaces uncomfortably humid air.
● Cold and warm fronts are plotted on a weather map as heavy lines usually anchored at the center of a
low-pressure system. The counterclockwise and inward circulation about a low brings contrasting air
masses together to form fronts. By contrast, the outward flow of relatively homogeneous air from a high
precludes development of fronts.
● A low-pressure system may develop along a stationary front and travel rapidly like a large ripple from
west to east along the front.
● Thunderstorms and associated severe weather (e.g., tornadoes, hail) most often develop south and south-east of the center of a low-pressure system in the warm, humid air mass located between the cold front
and the warm front.
As you monitor national and regional weather maps, also watch for the following:
● Cool sea breezes or lake breezes may push inland perhaps 10–50 km (6–30 mi.), lowering summer
afternoon temperatures in coastal areas.
● Beginning in late fall and continuing through much of the winter, lake-effect snows fall in narrow bands
on the downwind (eastern and southern) shores of the Great Lakes and Utah’s Great Salt Lake. Such
snowfalls are highly localized and can be very heavy.
● Severe thunderstorms and tornadoes are most common in spring and early summer across the central
United States, especially from east Texas northward to Nebraska and from Iowa eastward to central
Indiana.
● Thunderstorms are most frequent in Florida, on the western High Plains and eastern slopes of the Rock-
ies, but are rare along the Pacific coast and on the Hawaiian Islands.
● Tropical storms and hurricanes occasionally impact the Atlantic and Gulf coasts, primarily from August
through October. However, these tropical weather systems are rare on the West Coast.
1.6 Describing the State of the Atmosphere
Devices, computers, television, and newspaper weather reports include statistical summaries of present
and past weather conditions compiled to form a climatology (description of the climate) of a locale. The mean-
ing of the most common weather parameters:
● Maximum temperature. The highest air temperature recorded over a 24-hr period, usually between mid-
night of one day and midnight of the next day. Typically, but not always, the day’s maximum tempera-
ture occurs in the early to mid-afternoon. In the United States, surface air temperatures are reported in
degrees Fahrenheit (°F) and other countries in degrees Celsius (°C).
● Minimum temperature. The lowest air temperature recorded over a 24-hr period, usually between mid-
night of one day and midnight of the next day. Typically, but not always, the minimum temperature
occurs around sunrise.
● Dewpoint (or frost point). The temperature to which air must be cooled at constant pressure to become
saturated with water vapor and for dew (or frost) to begin forming on relatively cold surfaces.
● Relative humidity. A measure of the actual concentration of the water vapor component of air compared
to the concentration the air would have if saturated with water vapor. Relative humidity is always ex-
pressed as a percentage. Because the saturation concentration varies with air temperature so too does the
relative humidity. On most days, the relative humidity is highest during the coldest time of day (around
sunrise) and lowest during the warmest time of day (early to mid-afternoon).
● Precipitation amount. Depth of rainfall or melted snowfall over a 24-hr period, usually from midnight of
one day to midnight of the next, measured to one-hundredth of an inch in the United States and in mil-
limeters elsewhere. On average, 10 inches of freshly fallen snow melt down to about 1 inch of water.
● Air pressure. The weight of a column of air over a unit area of Earth’s surface. With a mercury barom-
eter, the initial instrument for measuring air pressure, the pressure exerted by the atmosphere supports a
column of mercury to a certain height and the mercury column fluctuates up and down as the air pres-
sure rises and falls. This is the reason air pressure is commonly reported in inches or millimeters of
mercury. In the United States, meteorologists express air pressure in millibars (mb), a unit of pressure
equal to a hectopascal (hPa). The average air pressure at sea level is 1013.25 mb, corresponding to thepressure exerted by a 29.92 in. (760 mm) column of mercury. Falling air pressure over a span of several
hours often signals an approaching low-pressure system and a turn to stormy weather. Rising air pres-
sure, on the other hand, indicates an approaching high-pressure system, with clearing skies or continued
fair weather.
● Wind direction and wind speed. According to meteorological tradition, wind direction is the compass
direction from which the wind blows (Figure 1.9). For example, a southeast wind blows from the south-
east toward the northwest and a west wind blows from the west toward the east. As a general rule, at
middle latitudes a wind shift from east to northeast to north to northwest is accompanied by falling air
temperatures. On the other hand, a wind shift from east to southeast to south usually brings warmer
weather. Over a broad area about the center of a high-pressure system calm air or light winds prevail.
Wind speed increase as a cold front passes a location and winds are particularly strong and gusty in the
vicinity of thunderstorms.
● Sky cover. Based on the fraction of the sky that is cloud covered, the sky is described as clear (no
clouds), a few clouds (1/8 to 2/8 cloud cover), scattered clouds (3/8 to 4/8), broken clouds (5/8 to 7/8),
and overcast (completely cloud-covered). All other factors being equal, nights are coldest when the sky
is clear and the air is relatively dry. An overcast sky prevents the day’s minimum temperature from fall-
ing and the day’s maximum temperature from rising more than otherwise.
● Weather watch. Issued by the National Weather Service when hazardous weather (e.g., tornadoes, heavy
snowfall) is considered possible based on current or anticipated atmospheric conditions, but its occur-
rence, timing, or exact location is uncertain.
● Weather warning. Issued by the National Weather Service when hazardous weather is happening, immi-
nent, or has a very high probability of occurring.Figure 1.9
Wind vane atop the Smithsonian Institution Building in Washington, DC. The arrow of the wind vane points in the
direction from which the wind is blowing, as confirmed by the flags that are stretched out in the downwind direc-
tion. [Photo by R. S. Weinbeck]
1.7 Weather Satellite Imagery
Satellite images and video loops (composed of successive images) are routine components of many
televised and online weather reports. Some newspaper weather pages also feature satellite images. Sensors on
weather satellites orbiting Earth provide a unique and valuable perspective on the state of the atmosphere over
broad areas and enable meteorologists to remotely measure temperature and humidity as well as to locate and
track weather systems.
The weather satellite images most familiar are obtained by sensors onboard a Geostationary Op-
erational Environmental Satellite (GOES) orbiting Earth about 36,000 km (22,300 mi.) above the planet’s
equator. A GOES satellite revolves around Earth at the same rate and in the same direction as the planet rotates
so it is always positioned over the same spot on Earth’s surface and its sensors have a consistent field of view
(Figure 1.10). The sub-satellite point, the location on Earth’s surface directly below the satellite, is essentially
on the equator. Two geostationary satellites, one over South America (near 75°W longitude) and the other over
the eastern Pacific (approximately 135°W longitude), provide a complete view of much of North America and
adjacent portions of the Pacific and Atlantic Oceans. Images of the entire western hemisphere are also available
on a regular basis to latitudes of about 60°. In order to best observe the poles, polar-orbiting satellites are also
used to complement geostationary satellites in monitoring the planet.
N
r
ato
Equ
S
Subsatellite
point
36,000 km
(22,300 mi)
Orbit pathFigure 1.10
A Geostationary Operational Environmental Satellite (GOES) orbits Earth so that it is always positioned over the
same equatorial spot on Earth’s surface.
Weather satellites
in orbit
h 1.7
e pt
Topic in D
A Polar-orbiting Operational Environmental Satellite (POES) travels in a relatively low altitude
(800 to 1000 km or 500 to 600 mi.) nearly north-south orbit passing close to the poles (Figure 1.11). The satel-
lite’s orbit traces out a plane in space while the planet continually rotates on its axis through the plane of the
satellite’s orbit. With each orbit, points on Earth’s surface (except near the poles) move eastward so that onboard
sensors sweep out successive overlapping north/south strips. A polar-orbiting satellite that follows the Sun (sun-
synchronous) passes over the same area twice each 24-hr day. Other polar-orbiting satellites are positioned so
they require several days before passing over the same point on Earth’s surface.N
S
Figure 1.11
A Polar-orbiting Operational Environmental Satellite (POES) orbits Earth in a nearly north-south direction passing
near the poles.
Polar orbit principle
h 1.8
e pt
Topic in D
Satellite-borne sensors are either passive or active. Passive sensors measure radiation coming from the
Earth-atmosphere system, both visible solar radiation reflected by the planet and invisible infrared radiation
emitted by the planet. Sunlight reflected by Earth’s surface and atmosphere produces images that are essentiallyblack and white photographs of the planet. Sun-lit, highly reflective surfaces, such as cloud tops and
snow-covered ground, appear bright white whereas less reflective surfaces, such as evergreen forests
and the ocean, appear much darker. Cloud patterns on a visible satellite image are of particular interest
to atmospheric scientists (Figure 1.12). From analysis of cloud patterns displayed on the image, they
identify not only a specific type of weather system (such as a hurricane), but also the stage of its life
cycle and direction of movement once a sequence of images is animated.
Figure 1.12
A sample visible satellite image from sensors onboard GOES-16. The cloud swirl over the central U.S.
is a low pressure system that brought the first significant snowfall of 2019. [Courtesy of NOAA/NWS
National Centers for Environmental Prediction]
Current visible
satellite image loop
h 1.9
e pt
Topic in D
A second type of sensor onboard a weather satellite detects infrared (IR) radiation. IR radiationis an invisible form of radiation emitted by all objects continually, both day and night. Hence, an infra-
red satellite image of the planet can provide information at any time whereas visible satellite images
are available only during daylight hours. (Because of around-the-clock availability, IR satellite images
are usually shown on television weathercasts.) Infrared signals are routinely calibrated to give the tem-
perature of objects in the sensor’s field of view. This is possible because the intensity of IR radiation
emitted by an object depends on its surface temperature; relatively warm objects emit more intense IR
radiation than relatively cold objects. IR-derived temperatures are calibrated on a gray scale such that
the brightest white indicates the lowest temperature and dark gray indicates the highest temperature. A
color scale can also be used to enhance certain temperatures.
The temperature dependency of IR emission makes it possible, for example, to distinguish low
clouds from high clouds on an IR satellite image. In the part of the atmosphere where most clouds
occur (the lowest 10 km or 6 mi. or so), air temperature usually decreases with increasing altitude.
The tops of high clouds are colder than the tops of low clouds and emit less intense IR radiation. In
the sample IR satellite image in Figure 1.13, taken at the same time as Figure 1.12, high clouds ap-
pear bright white (with the highest clouds color enhanced with progressive blue, green, yellow, and red
shadings to depict colder temperatures) whereas low clouds are darker and warmer. IR sensors are also
tuned to detect those wavelength bands where, in cloud-free areas, some of the radiation emitted from
Earth’s surface passes directly out to space. In this way, scientists can determine the surface tempera-
ture of the ground, snow cover, fog, ocean, or lake where the sky is cloud-free.
Figure 1.13
An infrared satellite image from sensors onboard GOES-16, taken at the same time as Figure 1.12.
[Courtesy of NOAA/NWS National Centers for Environmental Prediction]Current infrared
satellite image loop
0
.1
h1
e pt
Topic in D
Water vapor satellite images enable meteorologists to identify and track the movement of
moisture plumes within the atmosphere over thousands of kilometers. Water vapor is invisible and
not detectable on visible or infrared satellite images. But water vapor efficiently absorbs and emits
certain wavelength bands of IR radiation so that sensors onboard weather satellites sensitive to these
wavelengths detect water vapor. Water vapor imagery displays the water vapor concentration at alti-
tudes between about 5000 and 12,000 m (16,000 and 40,000 ft.). This can be shown on a gray scale,
where at one extreme, dark gray indicates almost no water vapor whereas at the other extreme, milky
white signals a relatively high concentration of water vapor. Upper-atmospheric clouds appear milky
to bright white on water vapor images, masking water vapor concentrations in the image. As in Fig-
ure 1.14, a color scale can also be used for enhancement of certain water vapor concentrations. In this
figure, blues, whites, and greens progressively represent higher concentrations of water vapor, whereas
yellows, oranges, and reds progressively represent lower concentrations. Water vapor animations can
reveal the air circulation pattern in weather systems prior to widespread cloud formation.Figure 1.14
A sample water vapor satellite image from sensors onboard GOES-16, taken at the same time as Figure
1.12 and Figure 1.13. [Courtesy of NOAA/NWS National Centers for Environmental Prediction]
Current water
vapor image loop
1
.1
h1
e pt
Topic in D
In addition to monitoring the weather, satellites have countless applications crucial to today’s
society, including the Global Positioning System (GPS), which allows for precise location and naviga-
tion. Meteorologists use GPS to track instrumentation probing the atmosphere and slight variations
in GPS signals can provide insight into atmospheric variables such as water vapor. To learn how GPS
works, see For Further Exploration Essay 1.2.
1.8 Weather Radar
Weather radar complements satellite surveillance of the atmosphere by locating and track-
ing the movement of areas of precipitation and monitoring the circulation within small-scale weather
systems such as thunderstorms. Weather radar continually emits pulses of microwave energy reflected
by atmospheric targets such as raindrops, snowflakes, or hailstones. The reflected signal is displayed as
blotches (radar echoes) on computer displays with a superimposed map of the region surrounding the
radar. The heavier the precipitation, the more intense echo. Echo intensity is calibrated on a color scale
so light green indicates light rain whereas dark red signals heavy rain or hail.
Some radar images appearing on weather broadcasts or online are color coded according to pre-
cipitation type to help distinguish between snow, rain, and freezing rain. From analysis of radar echoes,
meteorologists can determine the intensity of thunderstorms, track the movement of areas of precipita-
tion, and predict when precipitation is likely to begin or end. Composite maps of radar echoes from a
number of weather radars around the nation are useful in following the progress of large-scale weather
systems (Figure 1.15). By overlaying radar echoes on satellite images, areas of precipitation and clouds
can be displayed simultaneously, thereby helping to locate the most active portion of a weather system
(Figure 1.16). These composites are often animated.Figure 1.15 A sample composite national radar image from about the same time as the satellite images in Figures 1.12–1.14. [Courtesy of NOAA/NWS National Centers for Environmental Prediction]
Figure 1.16
   A sample infrared satellite image of the eastern United States, overlaid with radar echoes. This type of image al-
   lows areas of precipitation and clouds to be displayed simultaneously.

                                              Latest radar
                                               image loop
                                                                                             2
                                                                                        .1
                                                                                pt   h1
                                                                            e
                                                                 Topic in D

         Weather radar also monitors the movement of raindrops, snowflakes, and hailstones within a storm
system. Using the same operating principle as the device that measures the speed of a pitched baseball (Doppler
effect), weather radar detects the motion of precipitation particles within the storm system and can indicate the
system’s circulation. Early identification of the circulation within a thunderstorm cloud that is a precursor of a
developing tornado is a potentially life-saving application of Doppler weather radar. With advance warning of
a tornadic circulation before a funnel cloud touches the ground, people have time to seek shelter or move out of
its path. Radar is discussed in greater detail in Chapter 7.
1.9 Sky Watching
At the beginning stage the atmosphere and weather, develop a habit of observing the sky for changes
in clouds and cloud cover. As generations before us knew, sky watching makes us more aware of the dynamic
nature of the atmosphere and reveals clues to future weather. Here are some things to watch for:
● Clouds are aggregates of tiny water droplets, ice crystals, or some combination of both. Ice-crystal
clouds, such as cirrus clouds, occur at high altitudes where air temperatures are relatively low and they
have a fibrous or wispy appearance (Figure 1.17). Water-droplet clouds, such as cumulus clouds, occur
at lower altitudes where temperatures are higher and their edges are more sharply defined (Figure 1.18).
Figure 1.17
These high thin cirrus clouds appear fibrous because they are composed of mostly tiny ice crystals. [Photo by
Captain Albert E. Theberge Jr., NOAA Corps (ret.), NOAA NWS Collection]Figure 1.18
These relatively low cumulus clouds are composed of tiny water droplets and have more sharply defined edges
than ice-crystal clouds. [Photo by Stephen Corfidi, NOAA/NWS/SPC/OB]
● A cloud that is very near or in contact with Earth’s surface is fog (Figure 1.19). By convention, fog is a
suspension of tiny water droplets or ice crystals in air that reduces horizontal visibility to less than 1000
m (0.621 mi.).
Figure 1.19
Fog reduces visibility along a highway. [NOAA]● Some clouds form in horizontal layers (stratiform clouds) whereas others appear puffy (cumuliform
clouds). Stratiform clouds develop where air ascends gently over a broad region whereas cumuliform
clouds are produced by vigorous ascent of air over a much smaller area. Often stratiform clouds develop
ahead of a warm front while cumuliform clouds, especially those having great vertical development,
form along or just ahead of a cold front.
● Arrival of high, thin clouds in the western sky at a middle latitude location is often the first sign of an
approaching warm front. In time, clouds gradually lower and thicken until they eventually block the Sun
during the day or the Moon at night.
● The day may begin with clear skies, but after several hours of bright sunshine, small white clouds ap-
pear, resembling puffs of cotton floating in the sky (Figure 1.20). These fair-weather cumulus clouds
usually vaporize rapidly near sunset.
Figure 1.20
Fair weather cumulus clouds in Hawaii. These clouds are most common during the warmest time of the day.
[NOAA NWS Collection]
● During certain atmospheric conditions, cumulus clouds build vertically and merge laterally, eventu-
ally forming a thunderstorm cloud, called a cumulonimbus cloud (Figure 1.21). All thunderstorms are
accompanied by lightning and thunder. Severe thunderstorms can produce torrential rains, large hail,
strong, gusty winds, and even tornadoes.Figure 1.21
Cumulonimbus clouds always produce lightning and sometimes heavy rain, hail, and gusty surface winds. This
hail-producing supercell thunderstorm was photographed over the Colorado high plains just east of the foothills of
the Rockies. [Photo Credit:Walt Lyons/WeatherVideoHD.TV]
● Clouds at different altitudes sometimes move horizontally in different directions and even at different
speeds (Figure 1.22). Because most clouds move with the wind, such motion indicates that the horizon-
tal wind shifts direction (and speed) with increasing altitude.
Figure 1.22
Clouds at different altitudes may move horizontally in different directions indicating a change in wind direction with
altitude. [Courtesy of NASA S’COOL Project]
Conclusions
There is much to be learned about the atmosphere and weather by keeping track of local, regional, andnational weather patterns via television, radio, newspapers or online. Weather maps, satellite images, and radar
displays are particularly valuable in obtaining the “big picture” when following the development and move-
ment of weather systems across a broad region. In addition, it is useful to develop the habit of watching the sky
for changing conditions locally and to monitor weather instruments if available. These practices make course
learning more meaningful and practical. The study of the atmosphere, weather, and climate continues in the next
chapter with an examination of the evolution, composition, and structure of the atmosphere.
Basic Understandings
● From the experiences of everyday life, everyone has acquired basic understandings of the workings of
the atmosphere, weather, and climate.
● Weather is the state of the atmosphere at a place and time, described quantitatively in terms of such vari-
ables as temperature, humidity, and wind speed. Climate, traditionally defined as the average of weather
and the extremes at a particular location over a period of time, has expanded to describe the state of the
climate system as a whole.
● Weather information can be accessed online as well as from television, newspapers, and radio, including
the NOAA Weather Radio.
● A weather map portrays graphically the state of the atmosphere over a broad geographical region at a
specified time. On a weather map, H or High symbolizes a locale where air pressure is relatively high
compared to the surrounding area. Viewed from above in the Northern Hemisphere, surface winds blow
clockwise and outward about the center of a high. A high (or anticyclone) features generally fair weath-
er.
● On a weather map, L or Low symbolizes a locale where air pressure is relatively low compared to the
surrounding area. Viewed from above in the Northern Hemisphere, surface winds blow counterclock-
wise and inward about the center of a low. A low (or cyclone) often features stormy weather.
● An air mass is a huge volume of air covering hundreds of thousands of square kilometers that is relative-
ly uniform horizontally in temperature and humidity. The temperature and humidity of an air mass de-
pend on the properties of its source region and the nature of the surface over which the air mass travels.
● A front is a narrow transition zone between air masses that contrast in temperature and/or humidity.
Fronts form where air masses meet and associated air movements often give rise to cloudiness and
precipitation depending on the type of front. The most common types of fronts are stationary, warm, and
cold.
● Sensors onboard weather satellites orbiting the planet provide a unique and valuable perspective on the
state of the atmosphere and enable meteorologists to remotely measure temperature and humidity and
track weather systems. These sensors measure two types of radiation: sunlight that is reflected or scat-
tered by Earth and infrared radiation that is emitted by Earth. Weather satellites are in either geostation-
ary or polar orbits and generate data processed into visible and infrared images.
● Weather radar continually emits pulses of microwave radiation reflected by raindrops, snowflakes, or
hailstones. The reflected signal appears as blotches, known as radar echoes, on a screen. From analysis
of radar echoes, meteorologists determine the intensity and track the movement of areas of precipitation.
Using the Doppler effect, weather radar can also monitor the circulation of air within a storm system and
provide advance warning of severe weather.
● Observing the development, type, and movement of clouds may provide clues as to future weather.
Enduring Ideas
● Weather is described in terms of variables of state, including temperature, dewpoint, wind, and air pres-You can also read