National Surveillance for Hepatitis B Indicators - Doherty Institute
←
→
Page content transcription
If your browser does not render page correctly, please read the page content below
National Surveillance for Hepatitis B Indicators

Measuring the progress towards the targets of the National Hepatitis B Strategy
                            Annual Report 2020

 WHO Collaborating Centre for Viral Hepatitis, Doherty Institute for Infection and Immunity
     Prepared by: Karen McCulloch, Nicole Romero, Jennifer MacLachlan and Benjamin Cowie
Contact Information
WHO Collaborating Centre for Viral Hepatitis
Victorian Infectious Diseases Reference Laboratory, Doherty Institute for Infection and Immunity
Contact: Jennifer MacLachlan
Level 5, 792 Elizabeth Street, Melbourne VIC 3000
Email: Jennifer.MacLachlan@vidrl.org.au

Funding
The Australian Government Department of Health
Whilst the Australian Department of Health provides financial support for this project, the material
contained or the views expressed in this resource should not be taken to represent the views of the
Australian Department of Health.

Acknowledgments

We would like to acknowledge the following national jurisdictional organisations for the provision of
the data used in preparing the statistics contained in this report:
    - Australian Bureau of Statistics
    - Australian Government Department of Health
    - Australian Government Department of Services Australia
    - Australian Government Department of Social Services

We would also like to acknowledge Kelly Hosking, Geoff Stuart and Jane Davies from the Hepatitis B
Sero-coding Project, Northern Territory Government and Menzies School of Health Research for
providing Aboriginal and Torres Strait Islander specific data and context. Additionally, we would like
to acknowledge the members of the WHO Collaborating Centre for Viral Hepatitis’ Epidemiology and
Public Health Research Advisory Group for their guidance.

Suggested Citation
McCulloch K, Romero N, MacLachlan JH, Cowie BC. National Surveillance for Hepatitis B Indicators:
Measuring the progress towards the targets of the National Hepatitis B Strategy – Annual Report
2020. Melbourne: WHO Collaborating Centre for Viral Hepatitis, The Doherty Institute; 2021.

National Surveillance for Hepatitis B Indicators                                                        2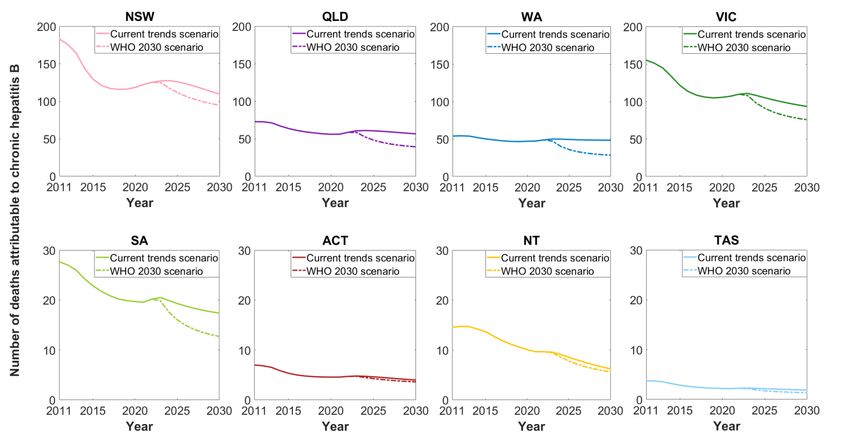
Abbreviations

 ABS                           Australian Bureau of Statistics
 ACT                           Australian Capital Territory
 CHB                           Chronic hepatitis B
 DC                            Decompensated cirrhosis
 DSS                           Department of Social Services
 FoI                           Force of infection
 GHSS                          Global Health Sector Strategy
 HCC                           Hepatocellular carcinoma
 LHS                           Latin-hypercube sampling
 MBS                           Medicare Benefits Schedule
 National Strategy             Australia’s 3rd National Hepatitis B Strategy 2018-2022
 NNDSS                         National Notifiable Diseases Surveillance
 NOM                           Net overseas migration
 NSW                           New South Wales
 NT                            Northern Territory
 PBS                           Pharmaceutical Benefits Scheme
 PR                            Plausible range
 QLD                           Queensland
 SA                            South Australia
 TAS                           Tasmania
 VIC                           Victoria
 WA                            Western Australia
 WHO                           World Health Organization
 COVID-19                      Coronavirus disease of 2019

National Surveillance for Hepatitis B Indicators                                         3
Contents

Contact Information and Acknowledgments .......................................................................... 2
Abbreviations ........................................................................................................................ 3
Executive Summary ................................................................................................................ 5
Introduction........................................................................................................................... 7
Report Background ................................................................................................................ 8
Report Updates ...................................................................................................................... 9
A.    National ....................................................................................................................... 10
A.1       Summary National Estimates ............................................................................................. 10
A.2       National Estimates for Hepatitis B Indicators .................................................................... 13
B.    State and Territories ..................................................................................................... 27
B.1       Summary State and Territory Estimates ............................................................................ 27
B.2       State and Territory Estimates for Hepatitis B Indicators ................................................... 27
C.    Methodological Notes .................................................................................................. 40
D.    Appendix ...................................................................................................................... 46
References ........................................................................................................................... 51

National Surveillance for Hepatitis B Indicators                                                                                            4
Executive Summary
Number of people living with chronic hepatitis B:
       •   In 2020 an estimated 222,559 people were living with chronic hepatitis B (CHB) in Australia,
           representing 0.87% of the population.
       •   For the first time since 1994, it was estimated that the number of people living with CHB in
           Australia declined, highlighting the demographic impacts of restrictions on migration in
           response to the COVID-19 pandemic.
       •   A decrease in prevalence can be seen from 1991 onwards in children aged under 5 years,
           highlighting the impact of hepatitis B vaccination.
       •   The estimates for the number of people living with CHB in Australia have been
           comprehensively revised using more granular and updated migration data, which has led to
           changes in estimates for treatment and care uptake and attributable mortality.
Chronic hepatitis B diagnosis:
An estimated 162,480 people living with CHB in Australia in 2020 had been diagnosed,
representing 73.0% of the total.
   • While the proportion diagnosed is increasing, it remains below the National Strategy target of
       80%, with 8,666i more people living with CHB requiring diagnosis to reach this target by 2022.
   • At the current rate of progress, Australia will not reach the National Strategy 2022 target of
       80% until 2023.
Chronic hepatitis B engagement in care:
       •   During 2020, an estimated 50,229 people were engaged in care for their CHB, receiving either
           antiviral treatment or monitoring, representing 22.6% of all people living with CHB.
       •   The proportion engaged in care in 2020 remains below the National Strategy target of 50%,
           with 56,737i more people required to be in care to reach this by 2022.
       •   At the current rate of progress, Australia will not reach the National Strategy 2022 target of
           50% until 2045.
Chronic hepatitis B treatment:
       •   In 2020, 23,787 people were dispensed drugs for the treatment of hepatitis B through the
           Pharmaceutical Benefits Scheme, which is an estimated 10.7% of all people living with CHB.
       •   The proportion on treatment in 2020 remains below the National Strategy target of 20% with
           19,000i more people requiring treatment to reach this target by 2022.
       •   The estimated proportion of people living with CHB in Australia who are eligible for treatment
           in 2020 was 29.5%.
       •   At the current rate of progress, Australia will not reach the National Strategy 2022 target of
           20% until 2034.
Deaths attributable to chronic hepatitis B:
       •   The modelled number of deaths attributable to CHB in 2020 was estimated to be 364. Three
           quarters of these estimated deaths (272) were attributable to hepatocellular carcinoma
           (HCC), while 92 estimated deaths were due to decompensated cirrhosis (DC).

i
    Based on the projected modelled estimate of 213,932 people living with CHB in 2022.

National Surveillance for Hepatitis B Indicators                                                          5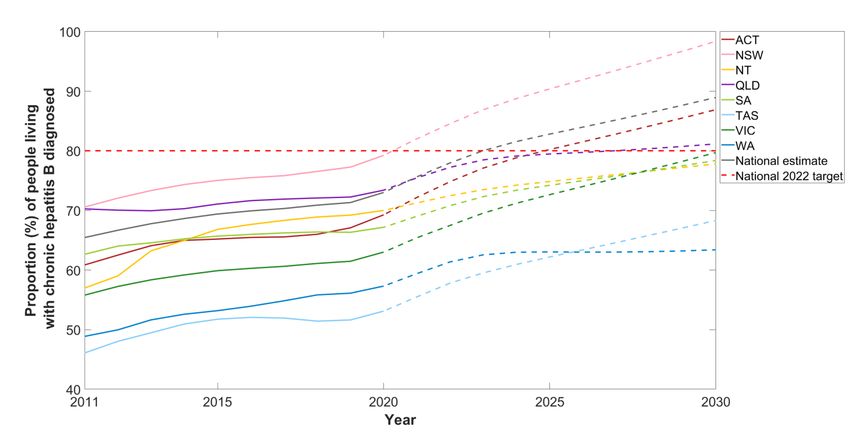
Jurisdictional disparities:
    •   Substantial differences in estimated prevalence, access to care and burden of disease in 2020
        were noted between states and territories:
           o Prevalence of CHB ranged from 0.28% (TAS) to 1.84% (NT).
           o The proportion diagnosed ranged from 53.1% (TAS) to 79.2% (NSW).
           o The proportion in care ranged from 10.2% (WA) to 27.0% (NSW), with the proportion
               of all those living with CHB receiving antiviral treatment ranging 6.9% (WA) to 12.9%
               (NSW).
           o With respect to trends over time, the estimated reduction in deaths due to CHB
               between 2011 and 2020 ranged from 13% (WA) to 43% (ACT) across jurisdictions –
               however, accurate estimation is difficult particularly in jurisdictions with relatively low
               numbers of people living with CHB.

Summary of trends against National Strategy 2022 targets:
In 2022 an estimated 213,932 people will be living with CHB in Australia. Australia is currently
projected to reach the National Strategy target for proportion diagnosed of 80% in 2023.
Furthermore, Australia is now projected to reach the WHO’s 2030 target of 90% of people living with
hepatitis B diagnosed one year later than the goal, in 2031. If current trends in engagement in care
and treatment uptake continue, an estimated 23.5% and 11.1% of people living with CHB will be
engaged in care and receiving treatment in 2022 respectively. Both of these estimates fall well short
of the National Strategy targets of 50% of people living with CHB engaged in care and 20% of people
living with CHB receiving treatment by 2022. The National Strategy target of a 30% reduction in
attributable deaths (when compared to the end of 2017) by 2022 is estimated to be achieved in 2030
under the WHO 2030 future treatment uptake scenario. However, this requires substantial increases
in future treatment uptake.

It is important to note that substantial changes to the number of people migrating into and out of
Australia has had a profound impact on future projections of the number of people living with CHB.
Given the unpredictability of future migration patterns and the long-term impacts of COVID-19 on
the health system and usual care, these modelled projection estimates will be updated as new
information becomes available.

National Surveillance for Hepatitis B Indicators                                                         6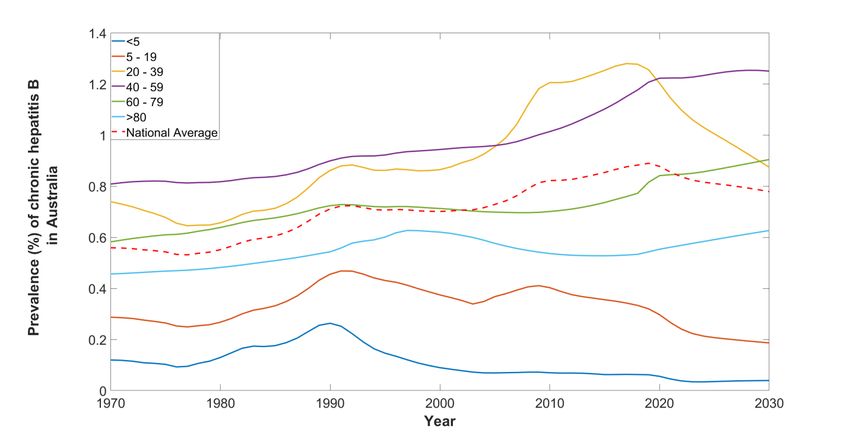
Introduction
In Australia approximately 1% of the population are living with chronic hepatitis B (CHB) 1-3, with
people born overseas and Aboriginal and Torres Strait Islander peoples representing three quarters
of those affected4. CHB is a significant public health burden and is now the most prevalent blood-
borne viral infection in Australia4, 5. CHB is a leading cause of liver cancer, the 6th most common cause
of cancer mortality in Australia6. Substantial improvements in access to appropriate care, monitoring
and treatment are required to address hepatitis B related mortality nationally.

Australia’s National Hepatitis B Strategies have been fundamental to guiding the response to
hepatitis B since 2010, with significant progress being achieved over this period. The 3rd National
Hepatitis B Strategy 2018-20227 (National Strategy), released in 2018 sets goals to make significant
progress towards eliminating hepatitis B as a public health threat, including reducing the burden of
disease and eliminating the negative impact of stigma, discrimination, and legal and human rights
issues on people’s health. The National Strategy highlights priority areas and populations, and
outlines targets to measure progress throughout the span of the strategy.

These targets are by the end of 2022 to:

    1. Achieve and maintain hepatitis B childhood vaccination coverage of 95 per cent at 12 and 24
       months
    2. Reduce the number of newly acquired hepatitis B infections across all age groups by 50 per
       cent, with a focus on priority populations
    3. Increase the proportion of people living with chronic hepatitis B who are diagnosed to 80
       per cent
    4. Increase the total proportion of people living with chronic hepatitis B receiving care to 50
       per cent
    5. For people living with chronic hepatitis B, increase the proportion receiving antiviral
       treatment to 20 per cent
    6. Reduce hepatitis B attributable mortality by 30 per cent (when compared to the end of
       2017)
    7. Minimise the reported experience of stigma among people living with hepatitis B, and the
       expression of stigma, in respect to hepatitis B status.

    Only bolded targets are reported in this report. For more information about other projects
    reporting on Strategy targets, see ‘Report Background’ section.

Measuring the progress towards the targets of the National Strategy will allow current gaps to be
identified, and priority areas to be highlighted to help shape the public health and policy response to
hepatitis B in Australia.

Australia has also endorsed the World Health Organization (WHO) Global Health Sector Strategy on
Viral Hepatitis 2016 – 20218, which calls for the elimination of hepatitis B as a public health threat by

National Surveillance for Hepatitis B Indicators                                                        7
2030. Global targets for 2030 include 90% of people living with hepatitis B diagnosed, 80% of eligible
persons with CHB treated and a 65% reduction in hepatitis B related deaths compared to 2015.

Report Background
This report summarises work undertaken by the WHO Collaborating Centre for Viral Hepatitis at the
Doherty Institute on the Surveillance for Hepatitis B Indicators Project funded by The Australian
Government Department of Health. The objective of this project is to develop disease burden
estimation and mathematical modelling approaches to inform the surveillance, monitoring and
evaluation of progress towards achieving the objectives of the 3rd National Hepatitis B Strategy 2018-
2022 and reporting against Hepatitis B Indicators in the National Blood-Borne Viruses and Sexually
Transmissible Infections Surveillance and Monitoring Plan 2018 - 2022. This report will not assess
vaccination, reduction in local transmission or stigma targets specifically. Further reporting against
these indicators can be found in the National Viral Hepatitis Mapping Reports4, the Kirby Institute’s
Annual Surveillance Reports9, and the Centre for Social Research in Health Stigma Indicators
Monitoring Project Reports10.

This report for the year 2020 is the fourth publicly available National Surveillance for Hepatitis B
Indicators Annual Report. All reports can be accessed at:
https://www.doherty.edu.au/whoccvh/centre-activities/research/blood-borne-viruses-and-sexually-
transmissible-infections-surveillance-and-research-programme

National Surveillance for Hepatitis B Indicators                                                         8
Report Updates
Indicator data estimates have been derived using a mathematical model for the natural history of
hepatitis B in Australia extending on previous work2, 3, 11, 12. The model accounts for diversity in
prevalence and impact of overseas migration, incorporating detailed disease phase dynamics, and
examining the impact of domestic and overseas vaccination programs, together with the impact of
antiviral treatment on mortality attributable to CHB at a population level. Further information
regarding the model can be found in the associated paper 2.

To ensure estimates most accurately reflect the current epidemiology and clinical pattern of CHB in
Australia, data inputs and assumptions are updated annually to incorporate new information. For
that reason historical indicator estimates provided in this report differ in some respects from
previous outputs reported in the Kirby Institute’s Annual Surveillance Reports, 9 the Doherty
Institute’s National Viral Hepatitis Mapping Project Reports4, 5, 13, and the National Surveillance for
Hepatitis B Indicators: 2019 Annual Report14-16.

Updates from previously reported 2019 estimates include:

    •   Data for total net overseas migration (NOM) by jurisdiction were updated from 1972 - 200317.
    •   More granular NOM data (including breakdown by jurisdiction, country of birth and 5-year
        age groups) were supplied by the Australian Bureau of Statistics (ABS) from 2004 onwards18.
        Previously publicly available ABS data was utilised for NOM by country of birth and combined
        with the estimated age distribution of migrants derived from Department of Social Services
        (DSS) Settlement Data19.
    •   Projected estimates of future NOM included in the model were updated to consider the
        impact of COVID-1920. However, given the recent changes in arrivals and departures due to
        the COVID-19 pandemic21 and likely ongoing shifts in migration patterns, future estimates will
        be profoundly affected by these changes.

Deriving specific modelled indicator estimates for Aboriginal and Torres Strait Islander populations
remains a priority of ongoing work and will be included in future reporting.

Due to previous methodological updates, estimates may differ from previous outputs reported in the
Kirby Institute’s Annual Surveillance Reports9, the Doherty Institute’s National Viral Hepatitis
Mapping Project Reports4, National Surveillance for Hepatitis B Indicators National Report16, and
publications.

National Surveillance for Hepatitis B Indicators                                                          9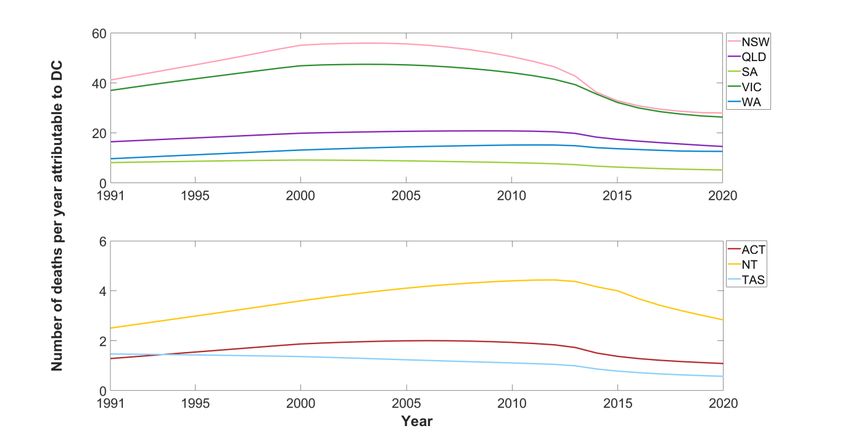
A. National
 A.1 Summary National Estimates
  Table 1. Australian summary for hepatitis B indicator estimates, 2020

                                                                    Point              Plausible range
                         Indicators
                                                                  estimate         Minimum       Maximum
1. People living with CHB                                         222,559          205,376        240,364
2. Proportion of people living with CHB in Australia who
                                                                    73.0%            65.6%             80.9%
   have been diagnosed
3. Proportion of people living with CHB in Australia who
                                                                    22.6%            20.9%             24.5%
   are receiving care
4. Proportion of people living with CHB who are
                                                                    10.7%             9.9%             11.6%
   dispensed drugs for the treatment of hepatitis B
5. Total number of attributable deaths due to CHB^                      364            312               424
           Number of deaths due to hepatocellular
                                                                        272            235               316
           carcinoma attributable to CHB
           Number of deaths due to decompensated
                                                                        92             77                108
           cirrhosis attributable to CHB
 ^ The sum of deaths due to HCC and deaths due to DC

 Figure 1. Chronic hepatitis B cascade of care, Australia, 2020

                         LIVING WITH CHRONIC HEPATITIS B INFECTION
                                         222,559

                             DIAGNOSED                                        UNDIAGNOSED
                           162,480 (73.0%)                                    60,079 (27.0%)

       ENGAGED
        IN CARE                                         NOT IN CARE
     50,229 (22.6%)                                    172,330 (77.4%)

                  TREATMENT
                    TARGET
                 44,512 (20.0%)

  RECEIVING
 TREATMENT                            NOT RECEIVING
      23,787                          TREATMENT                    Source: Viral Hepatitis Mapping Project
                                      20,725 (9.3%)                        National Report 2020 23
     (10.7%)

 National Surveillance for Hepatitis B Indicators: National Estimates                                          10
A.1.1 Progress Towards National Cascade of Care Targets
Despite the continued increase in the number of people diagnosed with chronic hepatitis B, and in
those receiving antiviral treatment, Australia did not reach the 2017 diagnosis and treatment
uptake targets set in the 2nd National Hepatitis B Strategy 2014-201722. Profound increases to
existing levels of diagnosis, treatment and care will be required to achieve the 2022 targets
contained in the current National Strategy.
Figure 2. Progress towards the 3rd National Hepatitis B Strategy 2018 – 2022 targets.
Table 2. Tracking the 3rd National Hepatitis B Strategy 2018-2022 targets.
2022
Indicator 2018 2019 2020
Target
Proportion of people living with CHB who have been diagnosed 70.9% 71.3% 73.0% 80.0%
Proportion of people living with CHB who are in care 22.8% 23.2% 22.6% 50.0%
Proportion of people living with CHB who have been treated 9.7% 10.2% 10.7% 20.0%
Reduction of hepatitis B attributable mortality (from end of 2017) 2.1% 2.7% 2.4% 30.0%
National Surveillance for Hepatitis B Indicators: National Estimates 11A.1.2 Progress Towards Global Health Sector Strategy Targets
We also measure progress towards the WHO’s 2030 targets outlined in the Global Health Sector
Strategy (GHSS) on Viral Hepatitis 2016 – 20218 targets, which are to:
• diagnose 90% of people living with hepatitis B by 2030,
• treat 80% of eligible persons with CHB and
• achieve a 65% reduction in hepatitis B related deaths when compared to 2015.
To achieve WHO’s 2030 targets outlined in the GHSS on Viral Hepatitis 2016 – 2021, and taking into
account future trends*, Australia must:
• Increase the number of people diagnosed from 162,480 in 2020 to 196,573^ by 2030
• Increase the number of people treated from 23,787 in 2020 to 55,774^ by 2030
• Decrease the number of deaths attributable to CHB from 364 in 2020 to 143 by 2030
*Estimates based on modelled future projections which assume that future migration numbers follow the
moderate impact scenario and our underlying assumptions about diagnosis trends, the composition of
migrants by country of birth and age distribution remain constant, which may not be the case due to the
impacts of COVID-19 (see section A.2.1.2 for details).
^ Based on the projected modelled estimate of 218,414 people living with CHB in 2030.
National Surveillance for Hepatitis B Indicators: National Estimates 12A.2 National Estimates for Hepatitis B Indicators A.2.1 Number of people living with chronic hepatitis B in Australia. During 2020, an estimated 222,559 (plausible range (PR) 205,376 to 240,364) people were living with CHB in Australia, representing 0.87% of the population. Modelled estimates show that the number of people living with CHB has increased over time in Australia, with an additional 88,524 people living with CHB in 2020 when compared to 2000 (Figure 3, Appendix Table A1). Following current trends (see section A.2.1.2 for details), including migration, treatment uptake and historical and current vaccination uptake both in Australia and overseas, an estimated 218,414 (PR 200,877 to 233,854) people will be living with CHB in Australia by 2030 (Figure 3). Figure 3. Estimated number of people living with chronic hepatitis B in Australia, 1970-2030. Shaded areas show plausible ranges of estimates determined by the 10th and 90th percentiles of simulations. The prevalence of CHB has increased substantially over time, from 0.59% in 1970 to 0.87% in 2020 (Figure 4). Changes in prevalence vary across age groups, with a decrease in prevalence observed from 1991 onwards in the under 5-year age group. The increase in prevalence of CHB in people aged 5 – 19 observed from 2004 – 2008 (Figure 4) is due to an increase in the numbers of migrants from countries with endemic CHB when compared to previous years. The decreasing trends observed (from 1991 onwards in the under 5-year age group, and from 2009 onwards in the 5 – 19 years age group) highlights the impact of childhood hepatitis B vaccination programs both domestically and internationally, with vaccination mediated reductions in CHB prevalence extending to older age groups over time. The majority of people living with CHB in Australia were born overseas and acquired hepatitis B in childhood prior to migration, and therefore changes in total numbers, countries of origin and age distributions of Australia’s migrant population will National Surveillance for Hepatitis B Indicators: National Estimates 13
affect the projections of hepatitis B in Australia, especially in light of the COVID-19 pandemic.
Further detailed information on the epidemiology of CHB in Australia according to priority groups
can be found in the Viral Hepatitis Mapping Project National Report4, 5, 23.

Figure 4. Estimated prevalence of chronic hepatitis B in Australia by age group, 1970-2030.

A.2.1.1 Phases of infection for people living with chronic hepatitis B

People living with CHB can transition in and out of different phases over time, so it is important to
estimate the distribution of phases at a population level. During 2020, the distribution of people
living with CHB in each disease phase (excluding those who had cirrhosis) was estimated to be
24.0% in immune tolerant, 5.7% in immune clearance, 46.1% in immune control and 17.6% in
immune escape phase. In addition, an estimated 5.8% of people living with CHB had cirrhosis and
0.8% had advanced liver disease (hepatocellular carcinoma or decompensated cirrhosis). The
proportion of people living with CHB in each disease phase varies by age group (Figure 5) with the
majority of people under 20 years old in the immune tolerant phase (49.9%). For all other age
groups, the majority of people living with CHB were in immune control, and this was generally
seen to increase with age. The proportion of people with CHB living with cirrhosis in 2020 also
increases with age from 1.3% in those under 20 years old to 12.9% in those aged above 80 years.
Similarly, the proportion of people living with advanced liver disease increases from 0.1% in those
under 20 years to 2.4% in those aged above 80. These estimates have implications for public
health messaging and policy around CHB management and treatment eligibility to prevent liver
disease and the importance of engaging particular populations, allowing prioritisation of those at
greatest risk of disease progression.

National Surveillance for Hepatitis B Indicators: National Estimates                               14
Figure 5. Estimated proportion of people living with chronic hepatitis B in each phase of infection by age
group, 2020.

A.2.1.2 Uncertainty in estimated future number of people living with CHB in Australia due to
    impacts of COVID-19 on migration

Changing patterns of migration to Australia, and the impact of infant hepatitis B vaccination
programs in countries with high prevalence of CHB have a significant impact on projections of the
number of people living with CHB in Australia. These future migration patterns are dependent on
various factors including local and international economic conditions, government policy, and of
particular relevance currently, the impact of restrictions in travel to Australia in response to the
COVID-19 pandemic. Substantial changes to the number of people migrating into Australia21 has
had a profound impact on future projections of the number of people living with CHB. In our
previously reported model-based estimates, the future migration projections of the Australian
Bureau of Statistics (ABS) were used for our model calculations24. However, these estimates were
generated prior to the COVID-19 pandemic and now do not accurately capture the current
migration trends.

New data sourced from the ABS highlights the huge impact of restrictions on international travel
in response to COVID-1918, as shown in Figure 6, with a severe decline in net overseas migration
(NOM), dropping from an estimate of 249,750 in 2019 to just 1,830 in 2020. Given the drastic

National Surveillance for Hepatitis B Indicators: National Estimates                                         15
changes in migration numbers due to international borders closing, limits on the number of international arrivals accepted into Australia every week and the ongoing nature of the pandemic, it is unknown if and when migration will return to pre-pandemic levels. We explored the effect this would have on the future projected number of people living with CHB by investigating different possible scenarios of future net overseas migration. Wilson and colleagues20 considered the impact of the COVID-19 pandemic on Australia’s future population by modelling future population increases based on available ABS data and using 2019 as the starting point for projecting estimates forward to 2041. They derived three scenarios including: (i) a short impact scenario where economic and demographic trends bounce back strongly over 2 – 3 years; (ii) a moderate impact scenario where the effects are felt for about 5 years; and (iii) a longer impact scenario with an extended economic depression of up to a decade (Figure 6). Figure 6: Historical and projected national net overseas migration (NOM) numbers 1991 – 2040. Within this report we have assumed that future net overseas migration would follow the moderate impact scenario for our future projections. The impact of varying the total number of people migrating into Australia as generated by Wilson et al.20 is substantial (Figure 7), with estimates of the number of people living with CHB in Australia in 2030 ranging between 206,894 and 227,758 when using the long impact and the short impact scenarios, respectively. National Surveillance for Hepatitis B Indicators: National Estimates 16
Figure 7: Impact of future migration numbers on estimated number of people living with CHB in Australia.

A.2.2 Proportion of people living with chronic hepatitis B in Australia who have been
   diagnosed

In 2020, an estimated 162,480 people living with CHB in Australia had been diagnosed,
representing 73.0% (PR 65.6% to 80.9%) of all Australians living with CHB. Historical trends show
modest improvements in this proportion, having increased from 65.4% diagnosed in 2011 (Figure
8, Appendix Table A2). Although thousands of individuals are diagnosed with CHB in Australia each
year, the population living with CHB also continued to increase until 2019. The year 2020
represented the first estimated decline in the number of people living with CHB in Australia since
1994 (Figure 3). This has resulted in a higher annual increase in the proportion diagnosed of 1.7%
from 2019 to 2020, compared with an average annual increase of 0.5% seen from 2016 to 2019
(Figure 8).

National Surveillance for Hepatitis B Indicators: National Estimates                                   17
Figure 8. Estimated proportion of people living with chronic hepatitis B in Australia who have been
diagnosed, 2011-2030.

Shaded areas show plausible ranges of estimates determined by the 10th and 90th percentiles of simulations.

The proportion diagnosed in 2020 remains below the National Strategy target of 80%, with 8,666ii
more people living with CHB requiring diagnosis to reach this target by 2022, which assumes the
number of people living with CHB in Australia continues to decline according to modelled future
projections (Figure 3). Since 2010 the annual number of national notifications has been
fluctuating, but followed a decreasing trend25. During the COVID-19 pandemic the number of total
viral hepatitis serology tests performed declined by 19.1% during April to December 2020
compared to the same period in 201926. This is likely due to the health system impacts of the
pandemic and the interruption to usual care observed for many aspects of health care. In parallel
with this decrease in serologic testing, a 14.8% decline in notifications of CHB was observed. By
combining this information with modelled outputs, we estimate the proportion diagnosed will
reach 88.9% diagnosed in 2030 (Figure 8), and Australia is projected to reach the National Strategy
target for proportion diagnosed of 80% in 2023. These projections assume that our underlying
assumptions about migration, diagnosis trends, the composition of migrants by country of birth
and age distribution remain constant, which is far from certain. Given the unpredictability of
future migration patterns and the long-term impacts of COVID-19 on the health system and usual
care, it will become increasingly important to understand disparities in the rates of diagnoses
among priority populations.

Taking into consideration notification and future migration trends (under the moderate impact

ii
  Based on the projected modelled estimate of 213,932 people living with CHB in 2022, to reach the 80% diagnosis
target we need to have diagnosed 171,146 people by 2022.

National Surveillance for Hepatitis B Indicators: National Estimates                                               18
scenario), Australia is now projected to reach the WHO’s 2030 target of 90% of people living
with hepatitis B diagnosed one year later than the goal, in 2031.

Considering the plausible range, the proportion diagnosed in 2020 could be as small as 65.6% and
as large as 80.9% - which in the latter case would mean that Australia has already reached the
2022 diagnosis target. However, the likelihood that the 2022 diagnosis target has been achieved
in 2020 is low, as the target was not achieved in 86.9% of model simulations. These estimates
may be considered optimistic and further analysis below highlights the impact of uncertainties in
source data on the proportion diagnosed.

A.2.2.1 Sensitivity Analysis for duplicate notifications

The number of people living with CHB who have been diagnosed is calculated by using the number
of notifications, which is sourced from the National Notifiable Diseases Surveillance (NNDSS)
system25. However, NNDSS data may contain duplicates if individuals have been diagnosed in
multiple jurisdictions, inflating the number of people diagnosed. Data linkage projects in New
South Wales and Victoria estimated that approximately 8% of notifications were duplicates,
occurring in both jurisdictions. While we do not yet know what the proportion of duplicate
notifications will be nationally, we conducted a sensitivity analysis to consider the impact this
could have on the estimated proportion diagnosed nationally (Figure 9). Assuming 8% of national
notifications are duplicates reduces the estimated proportion diagnosed in 2020 from 73.0% (PR
65.6% to 80.9%) to 67.2% (PR 60.3% to 74.4%).

Figure 9. Comparison of estimated proportion diagnosed when assuming none of the national notifications
are duplicates (Panel A) and when assuming 8% of national notifications are duplicates (Panel B), 2011-
2030, comparison with assuming 8% of notifications are duplicates.

Shaded areas show plausible ranges of estimates determined by the 10th and 90th percentiles of simulations.

National Surveillance for Hepatitis B Indicators: National Estimates                                    19
Furthermore, only 9% of model simulations estimated the 2022 diagnosis target could be reached
in 2022 when assuming 8% of notifications are duplicates, compared to 43.5% of simulations if we
assumed no duplicate notifications (Figure 10).

Figure 10: Distribution of estimated proportion diagnosed in 2022 and 2030 based on model output of
1,000 simulations. Panel A graphs assume no duplicate notifications, Panel B assumes 8% of national
notifications are duplicates.

This sensitivity analysis highlights the importance of estimating the proportion of duplicate
notifications for accurately estimating the true proportion of people diagnosed, particularly across
states and territories.

National Surveillance for Hepatitis B Indicators: National Estimates                                  20
A.2.3 Proportion of people living with chronic hepatitis B who are engaged into care,
   receiving either treatment or monitoring

During 2020, 50,229 people were engaged in care for their CHB, receiving either antiviral
treatment or monitoring (defined as receiving hepatitis B viral load testing according to clinical
guidelines) without antiviral treatment. As a result, total uptake of care is an estimated 22.6% (PR
20.9% to 24.5%) of all people living with CHB. Modelled trends show substantial improvement in
this proportion over time, increasing from 12.3% in 2011 (Figure 11, Appendix Table A3). Although
this increase was relatively rapid between 2011 to 2014, the rate of increase has been
substantially slower since 2015. Due to the COVID-19 pandemic a reduction in the proportion of
people engaged in care for their CHB was seen in 2020, with data showing an 8.7% decline in viral
load tests performed while not on treatment during April to December 2020 compared to April to
December 201926.

Figure 11. Estimated proportion of people living with chronic hepatitis B in Australia who were engaged in
care (receiving either treatment or monitoring), 2011-2030.

Shaded areas show plausible ranges of estimates determined by the 10th and 90th percentiles of simulations.

Clinical guidelines recommend that all people living with CHB should be engaged in care, and
Australia currently falls well short of meeting these clinical recommendations. The proportion
engaged in care also remains below the National Strategy target of 50%, with 56,737iii more
people required to be in care to reach this target by 2022. Assuming the number of people

iii
  Based on the projected modelled estimate of 213,932 people living with CHB in 2022, we estimate that 106,966
people living with CHB are required to be engaged in care to reach the target of 50%.

National Surveillance for Hepatitis B Indicators: National Estimates                                             21
engaged in care for their CHB remains stable in 2021 – 2022 and then increases based on trends
seen in 2016 – 2019, Australia will not reach the 50% target until 2045. Noting that these
projections incorporate our inherently uncertain underlying assumptions about future migration,
composition of migrants by country of birth and age distribution as detailed in section A.2.1.2.

A.2.4 Proportion of people living with chronic hepatitis B who are dispensed drugs for the
   treatment of hepatitis B through the Pharmaceutical Benefits Scheme

During 2020, 23,787 people were dispensed drugs for the treatment of hepatitis B through the
Pharmaceutical Benefits Scheme (PBS), which is an estimated 10.7% (PR 9.9% to 11.6%) of people
living with CHB. The number of hepatitis B treatment scripts dispensed during Apr-Dec 2020
increased by 3.6% compared to 2019, however this increase was substantially smaller than the
magnitude of increase in the previous year (9.7%), likely due to the impact of the COVID-19
pandemic on routine health care delivery26.

For Australia to achieve the National Strategy target of 20% of people receiving antiviral
treatment, rapid increases in treatment uptake need to be seen, with an additional 19,000iv
people living with CHB needing to receive antiviral treatment by 2022. Two treatment uptake
scenarios were modelled to consider the impact of future treatment uptake on future mortality: (i)
Current trends scenario: Assumes the number of people receiving treatment in 2021 & 2022
remain the same as in 2020, due to the impact of COVID-19. From 2023 onwards this scenario
assumes the average annual increase follows 2016 – 2019 trends; and (ii) WHO 2030 scenario:
Assumes the number of people receiving treatment in 2021 & 2022 remain the same as in 2020,
due to the impact of COVID-19. From 2023 onwards future treatment uptake was modelled at the
level of increase required to meet the WHO GHSS 2030 treatment target (80% of eligible people
receiving treatment). Based on estimates of the proportion of people who are eligible for antiviral
treatment developed through this modelling project (29.5% in 2021), the target of 80% of eligible
people (see section A.2.4.1 below) receiving treatment equates to approximately 25% of all people
living with CHB.

The National Strategy target of 20% receiving treatment by 2022 is not reached under the future
treatment uptake scenarios (due to the projected impact of the COVID-19 pandemic) (Figure 12).
Reaching this target would require an average annual treatment increase of 4.7% from 2020 to
2022, compared to the current increase of 0.49% from 2019 to 2020. Furthermore, to reach the
WHO target of 80% of eligible people living with CHB receiving treatment by 2030 would require a
significant average annual treatment increase of 1.7% from 2023 to 2030.

iv
 Based on the projected modelled estimate of 213,932 people living with CHB in 2022, we estimate that 42,787
people living with CHB require treatment to reach the target of 20%.

National Surveillance for Hepatitis B Indicators: National Estimates                                           22
Figure 12. Estimated proportion of people living with chronic hepatitis B in Australia who were dispensed
drugs for the treatment of hepatitis B through the Pharmaceutical Benefits Scheme, 2000-2030.

A.2.4.1 Treatment eligibility

Although the number of people dispensed drugs for treatment of CHB through the PBS is usually
reported as a proportion of the total number of people living with CHB, it is important to highlight
not all people living with CHB are eligible for treatment. This is because the dynamic natural
history of hepatitis B and the various phases of infection mean the minority of people living with
CHB require treatment. Current guidelines recommend antiviral therapy only for those in an
immune active phase of CHB (immune clearance, immune escape) or those living with cirrhosis
with detectable HBV replication irrespective of phase27. These guidelines emphasise the
importance of generating estimates of the proportion of people living with CHB by phase (refer to
section A.2.1.1 on page 13)2.

Estimates of the proportion of people living with CHB who are eligible for treatment range from
approximately 10% to 31% 2, 28-32. The true proportion of people living with CHB who require
treatment will vary by hepatitis B genotype, age group, sex, and other factors, and prior to this
project had not previously been estimated for Australia. The modelling undertaken for this
project, which incorporates the phase of CHB and the proportion of people living with cirrhosis,
enabled estimation of the number of people living with CHB eligible for antiviral treatment in
Australia for the first time. We are able to track this over time in response to population changes.

In 2020, an estimated 65,658 (PR 62,796 to 68,409) people living with CHB were eligible for
antiviral treatment, representing 29.5% (PR 28.2% to 30.7%) of the total. This suggests the
National Strategy target of 20% of people living with CHB receiving antiviral treatment by 2022

National Surveillance for Hepatitis B Indicators: National Estimates                                    23
remains conservative (Figure 12). Based on this modelling, Australia treated a third of those
estimated to require treatment in 2020 and would have needed to treat an additional 41, 871
people to reach everyone who was eligible.

To reach the WHO Global Health Sector Strategy of 80% of eligible people with CHB treated by
2030, the number of people receiving antiviral treatment in Australia will need to increase from
23,787 in 2020 to 55,774 in 2030. Since 2015, an average annual increase of 1.7% in treatment
uptake for eligible people was observed; if this trend were to remain stable, Australia will not
reach the WHO 2030 elimination target until 2046.

A.2.5 Burden of disease attributable to chronic hepatitis B in Australia

In 2020, an estimated 364 people (PR 312 to 424) died due to complications of CHB in Australia.
The total number of estimated attributable deaths has changed over time, increasing from 387 in
1991 to a peak of 535 deaths in 2007 followed by a gradual decline (Figure 13, Appendix Table A5).
This decrease in estimated deaths is due to the introduction and scaling up of effective antiviral
treatment in Australia during the last two decades, and the resulting reduction in CHB-associated
mortality in those at greatest risk of adverse outcomes. In recent years the number of deaths has
plateaued instead of continuing to decrease, in part due to an increasing aging population and
treatment uptake not increasing sufficiently.

Figure 13. Estimated number of deaths attributable to chronic hepatitis B in Australia over time, 1991-
2020.

Shaded areas show plausible ranges of estimates determined by the 10th and 90th percentiles of simulations.
Deaths due to CHB are caused by the development of decompensated cirrhosis (DC) and/or
hepatocellular carcinoma (HCC), the most common form of liver cancer. In Australia, 75% of

National Surveillance for Hepatitis B Indicators: National Estimates                                      24
estimated deaths due to CHB were attributable to HCC, which was responsible for 272 (PR 235 to
316) deaths in 2020, while 92 (PR 77 to 108) people were estimated to have died due to DC.
Deaths due to both causes have decreased over the last decade, however the decline has been
more pronounced for DC (40.3% reduction, from peak of 165 in 2006, Figure 13) than for HCC
(29.2% reduction, from the peak of 384 in 2007, Figure 13).

The impact of treatment in reducing the risk of death due to CHB may be more pronounced for DC
compared to HCC due to the underlying clinical factors in relation to treatment impact. While
antiviral treatment has been demonstrated to substantially reduce the risk of development of
HCC, this effect is not immediate and antiviral therapy has limited impact on survival once HCC has
already been diagnosed. In contrast, antiviral treatment not only prevents progression to cirrhosis
and then to DC, but additionally can be effective even when provided late in the disease course,
resulting in re-compensation of liver disease. In coming years, increasing the uptake of timely
treatment in people living with CHB (i.e. before the development of cirrhosis) can be expected to
accelerate the reduction in HCC attributable deaths.

The results of the modelling undertaken for this project suggest that without the availability of
antiviral treatment in Australia, the number of attributable deaths would have continued to
increase over time, to 834 CHB attributable deaths estimated in 2020 (Figure 14). Our assessment
estimates that in 2020, 470 lives were saved due to treatment, with a total of 3,601 lives saved
since the year 2000 following the introduction of antiviral treatment for CHB in Australia.

Figure 14. Estimated number of deaths attributable to chronic hepatitis B in Australia, current trends
treatment scenario vs no treatment, 1991 – 2030.

Dotted lines show estimated deaths per year without treatment for CHB

National Surveillance for Hepatitis B Indicators: National Estimates                                     25
A.2.5.1 Impact of treatment on mortality

The reduction in deaths attributable to CHB at the end of 2020 relative to the end of 2017 was
2.4%, with substantial progress still needed to reach the National Strategy target of a 30%
reduction in hepatitis B attributable mortality by 2022. To reach this target, the total number of
CHB attributable deaths must fall to 262 deaths. Although the reduction in deaths has been
pronounced since the introduction of antiviral treatment, future reductions depend on future
treatment uptake. In 2022, the estimated change in attributable deaths in Australia when
compared to 2017 under the current trends and WHO 2030 scenarios (Figure 12) will be a 1.9%
increase (Figure 15). However, in 2030, the estimated reduction in attributable deaths in Australia
when compared to 2017 is 9.8% and 30% under the current trends and WHO 2030 scenarios
respectively (Figure 15).

To reach the WHO Global Health Sector Strategy 2030 target of a 65% reduction in hepatitis B
related deaths compared to 2015, the total number of CHB attributable deaths must fall to 143
deaths by 2030.

Figure 15: Impact of future treatment uptake on estimated number of deaths attributable to chronic
hepatitis B in Australia, 2000 – 2030.

National Surveillance for Hepatitis B Indicators: National Estimates                                 26
B. State and Territories
B.1 Summary State and Territory Estimates
Table 3. Australian summary for hepatitis B indicator point estimates by jurisdiction, 2020
Total
HCC deaths DC deaths
State/ People living Diagnosed In care Treatment deaths
attributable attributable
Territory with CHB (%) (%) uptake (%) attributable
to CHB to CHB
to CHB
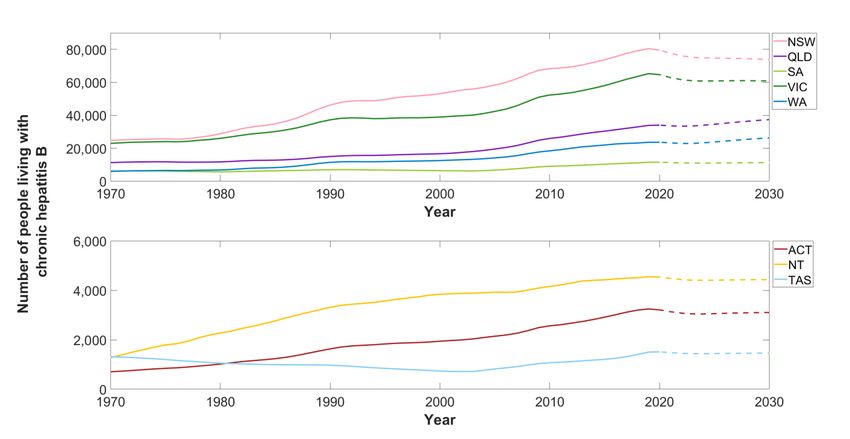
ACT 3,211 69.3% 25.7% 12.5%Figure 16. Estimated number of people living with chronic hepatitis B by jurisdiction, 1970-2030
Dotted lines represent modelled projection estimates.
Table 4. Estimated number of people living with chronic hepatitis B and prevalence by jurisdiction, 2020
Plausible range
State/Territory People living with CHB Prevalence (%)
Minimum Maximum
ACT 3,211 2,966 3,502 0.74%
NSW 79,522 73,348 86,002 0.97%
NT 4,538 4,327 4,739 1.84%
QLD 33,987 31,818 35,429 0.65%
SA 11,507 10,601 12,425 0.65%
TAS 1,513 1,370 1,655 0.28%
VIC 64,632 59,314 71,023 0.97%
WA 23,649 21,632 25,589 0.89%
Australia 222,559 205,376 240,364 0.87%
Note: Jurisdictional estimates were standardized to ensure the sum of indicator variables across the
jurisdictions aligns with the modelled national estimate.
B.2.2 Proportion of people living with chronic hepatitis B in Australia who have been
diagnosed
Since 2011 modest increases in the estimated proportion of people living with CHB who have been
diagnosed have been observed in all jurisdictions (Figure 17, Appendix Table A2). The estimated
National Surveillance for Hepatitis B Indicators: State and Territory Estimates 28proportion diagnosed varied greatly between jurisdictions, with NSW (79.2%) and QLD (73.4%) having the highest proportion diagnosed in 2020 (Table 5). Estimates for all other states and territories were below the national average of 73.0%, with NT (70.0%), ACT (69.3%), SA (67.2%), VIC (63.0%), WA (57.3%) and TAS (53.1%) exceeding 50%. No jurisdiction has yet reached the 2022 National Strategy target of 80% of people living with CHB being diagnosed. Following trends in notifications since 2016, the only jurisdiction due to reach the 80% diagnosed target by 2022 is NSW, which is estimated to reach the target in 2021 (Figure 17). The ACT and QLD are estimated to reach the target in 2025 and 2027 respectively, while all other jurisdictions would reach the target after 2030. Similar to the national model, it is important to note that these projections assume our underlying assumptions about migration, diagnosis trends, the composition of migrants by country of birth and age distribution remain constant, which may not be the case. A significantly increased rate of diagnosis is required in all these jurisdictions to reach the National Strategy target by 2022. As the proportion diagnosed is dependent on routinely collected surveillance data, disparities between states and territories will be impacted by variations in screening practices, underlying population differences in each jurisdiction and duplicate notifications. Please see section A.2.2.1 Sensitivity analysis for duplicate notifications for more information. Figure 17. Estimated proportion of people living with chronic hepatitis B who have been diagnosed by jurisdiction, 2011-2030. Dotted lines represent modelled projection estimates. National Surveillance for Hepatitis B Indicators: State and Territory Estimates 29
Table 5. Estimated proportion of people living with chronic hepatitis B who have been diagnosed by
jurisdiction, 2020
Plausible range
State/Territory Proportion diagnosed
Minimum Maximum
ACT 69.3% 63.4% 80.7%
NSW 79.2% 74.4% 90.8%
NT 70.0% 68.0% 77.4%
QLD 73.4% 71.6% 81.9%
SA 67.2% 61.5% 79.2%
TAS 53.1% 50.6% 60.6%
VIC 63.0% 57.5% 74.3%
WA 57.3% 53.4% 66.3%
Australia 73.0% 65.6% 80.9%
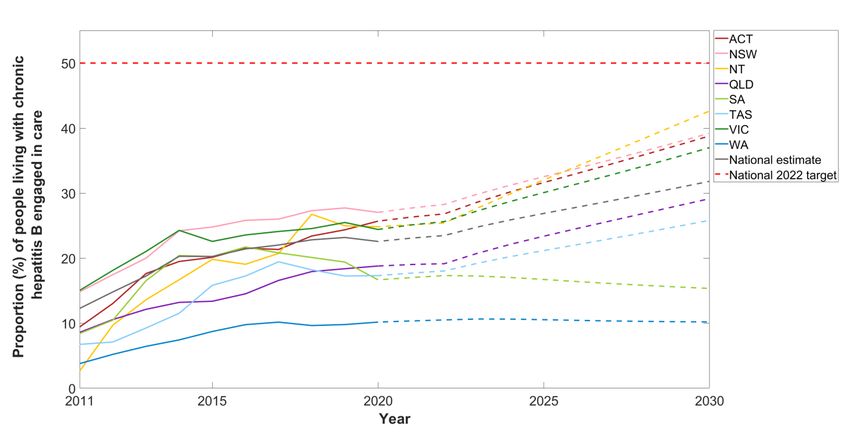
B.2.3 Proportion of people living with chronic hepatitis B who are engaged into care,
receiving either treatment or monitoring
Since 2011, the proportion of people living with CHB who are engaged in care varied greatly
between state and territories (Figure 18, Appendix Table A3). Despite some fluctuations, generally
the proportion of people living with CHB who are engaged into care increased in most states and
territories during 2011 - 2019.
However, since 2017 there has been a decreasing trend in the proportion receiving care in SA,
TAS, WA, NT, NSW and VIC (Figure 18). This may be partly attributable to data reporting, as
anomalies in the expected number of viral load tests performed in some jurisdictions have been
observed in the Viral Hepatitis Mapping Project National Report4, 5. In 2020, due to the impact of
COVID-19, the proportion of people living with CHB who are engaged into care declined or
remained stable, with the exception of the ACT which had a 1.3% increase from 2019 to 2020.
It can be observed that jurisdictions with a higher proportion of people living with CHB diagnosed
did not always have a higher proportion engaged in care, indicating that jurisdictions likely
encounter different challenges in improving the cascade of care for CHB. In 2020 NSW (27.0%),
ACT (25.7%), NT (24.8%) and VIC (24.4%) had the highest proportions of people living with CHB
engaged in care (Table 6). All other jurisdictions fell under the national average of 22.6%
engagement in care: QLD (18.8%), SA (16.7%), TAS (17.3%), WA (10.2%).
No jurisdiction has yet reached the 2022 National Strategy target of 50% of people living with CHB
engaged in care. Following current trends since 2016, NT, ACT, NSW and VIC will not reach this
target until 2034, 2037, 2037 and 2038 respectively. All other jurisdictions will reach the 2022
target after the national estimate, in 2045.
National Surveillance for Hepatitis B Indicators: State and Territory Estimates 30Although the National Strategy target is set to 50%, clinical guidelines recommend that all
people living with CHB should be engaged in care, so drastic improvements need to be made
across all jurisdictions to engage all people living with CHB.
Figure 18. Estimated proportion of people living with chronic hepatitis B who were engaged into care,
receiving either treatment or monitoring by jurisdiction, 2011-2030
Dotted lines represent modelled projection estimates.
Table 6. Estimated proportion of people living with chronic hepatitis B who were engaged in care by
jurisdiction, 2020
Plausible range
State/Territory Proportion in care
Minimum Maximum
ACT 25.7% 23.6% 27.8%
NSW 27.0% 25.0% 29.3%
NT 24.8% 23.8% 26.0%
QLD 18.8% 18.0% 20.1%
SA 16.7% 15.4% 18.1%
TAS 17.3% 15.8% 19.1%
VIC 24.4% 22.2% 26.6%
WA 10.2% 9.4% 11.1%
Australia 22.6% 20.9% 24.5%
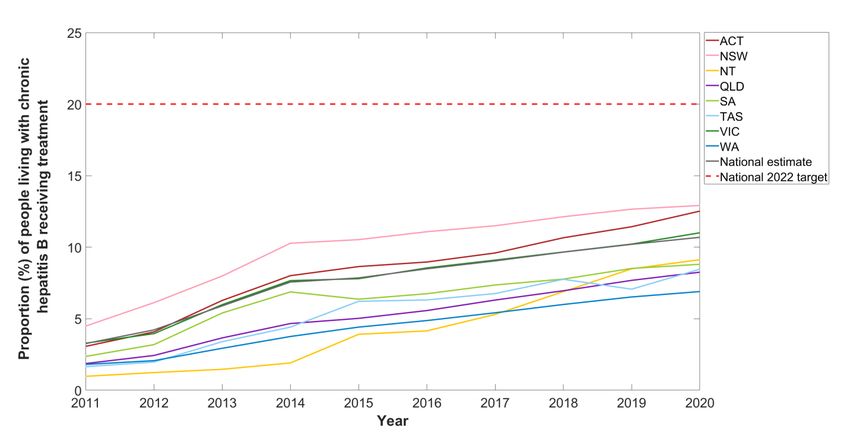
National Surveillance for Hepatitis B Indicators: State and Territory Estimates 31B.2.4 Proportion of people living with chronic hepatitis B who are dispensed drugs for the treatment of hepatitis B through the Pharmaceutical Benefits Scheme As previously described in the Viral Hepatitis Mapping Project National Report4, 5, the proportion of people living with CHB receiving antiviral treatment has increased over time in all states and territories (Figure 19, Appendix Table A4). Treatment uptake varied greatly between jurisdictions, with NSW (12.9%), ACT (12.5%) and VIC (11.0%) estimated to have the highest proportion of people with CHB receiving treatment in 2020 (Table 7). All other states and territories were below the national average (10.7%) for treatment uptake, including NT (9.1%), SA (8.8%), TAS (8.5%), QLD (8.3%) and WA (6.9%). A relatively rapid increase in treatment uptake was observed in most jurisdictions until 2014 to 2015, when the rate of increase slowed. Uniquely, NT has seen the opposite pattern over time, with substantial treatment uptake seen in more recent years compared to other jurisdictions. Due to the impact of COVID-19, most jurisdictions saw marginal increases in the proportion of people receiving treatment for their CHB, with the exception of TAS and ACT which saw a 1.1% and 1.4% increase in the proportion receiving treatment in 2020 when compared to 2019 respectively (Figure 19). In 2020, no jurisdiction had reached the 2022 National Strategy target of 20% treatment uptake. Figure 19. Estimated proportion of people living with chronic hepatitis B who were dispensed drugs for the treatment of hepatitis B through the PBS by jurisdiction, 2011-2020. National Surveillance for Hepatitis B Indicators: State and Territory Estimates 32
Table 7. Estimated proportion of people living with chronic hepatitis B who were dispensed drugs for the
treatment of hepatitis B through the PBS by jurisdiction, 2020
Plausible range
State/Territory Proportion receiving treatment
Minimum Maximum
ACT 12.5% 11.5% 13.6%
NSW 12.9% 11.9% 14.0%
NT 9.1% 8.7% 9.6%
QLD 8.3% 7.9% 8.8%
SA 8.8% 8.2% 9.6%
TAS 8.5% 7.7% 9.3%
VIC 11.0% 10.0% 12.0%
WA 6.9% 6.4% 7.5%
Australia 10.7% 9.9% 11.6%
To explore future treatment uptake, two scenarios were modelled for each jurisdiction:
i. Current trends scenario: Assumes the number of people receiving treatment in 2021 &
2022 remain the same as in 2020, due to the impact of COVID-19. From 2023 onwards this
scenario assumes the average annual increase follows 2016 – 2019 trends
ii. WHO 2030 scenario: Assumes the number of people receiving treatment in 2021 & 2022
remain the same as in 2020, due to the impact of COVID-19. From 2023 onwards future
treatment uptake was modelled to ensure the WHO GHSS 2030 treatment target (80% of
eligible people receiving treatment) was reached. From modelled estimates 80% of eligible
people (see section A.2.4.1) receiving treatment equates to approximately 25% of all
people living with CHB (Figure 20).
Under the current trends scenario, no jurisdiction reached the 2022 treatment target with ACT, NT
and NSW estimated to have the highest proportion of people living with CHB receiving treatment
in 2030, 21.4%, 21.2% and 20.5% respectively. Under the WHO 2030 scenario, jurisdictions only
reach the 2022 target of 20% treatment uptake between 2026 and 2028, however this requires a
substantial increase in uptake from 2023 onwards (Figure 20).
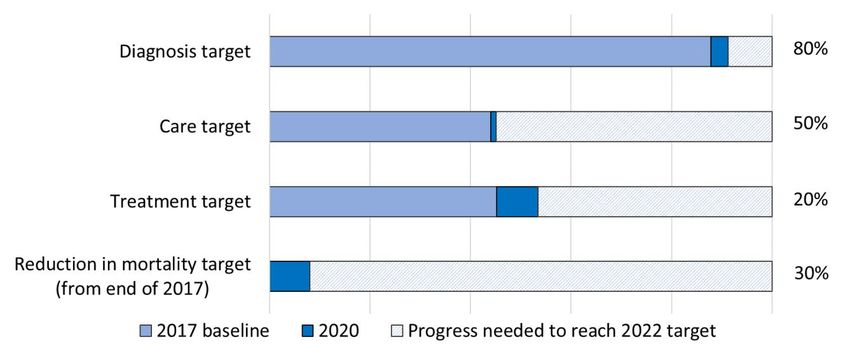
National Surveillance for Hepatitis B Indicators: State and Territory Estimates 33Figure 20: Estimated proportion of people living with chronic hepatitis B in Australia receiving treatment by jurisdictions, current trends vs WHO 2030 future treatment uptake scenarios B.2.4.1 Treatment eligibility As described in the National Estimates section of this report (section A.2.4.1), not all people living with CHB are eligible for treatment due to the dynamic natural history of hepatitis B. Estimates of the proportion of people living with CHB who are eligible for treatment range from approximately 10% to 31% 2, 28-32. The true proportion of people living with chronic hepatitis B who require treatment will vary by hepatitis B genotype or country of birth as a proxy, age group, sex, and other factors. This has been highlighted when comparing the proportion eligible for treatment in each state and territory. In 2020, NT (32.0%), NSW (29.8%) and VIC (29.7%) were estimated to have the highest proportion of people living with CHB who are eligible for treatment, followed by WA (29.2%), SA (29.1%), QLD (28.8%), ACT (28.3%) and TAS (26.5%). B.2.5 Burden of disease attributable to chronic hepatitis B in Australia While national estimates demonstrated a gradual decline in deaths attributable to CHB from 2006 to 2019, this was largely driven by those jurisdictions with the largest number of people living with CHB receiving treatment (NSW and VIC), with this trend not being observed in all states and territories (Figure 21, Appendix Table A5). National Surveillance for Hepatitis B Indicators: State and Territory Estimates 34
You can also read