New Challenges for the New Year - U.S.ECONOMIC OUTLOOK JANUARY 2022
←
→
Page content transcription
If your browser does not render page correctly, please read the page content below

U.S. ECONOMIC OUTLOOK

  New Challenges for
  the New Year

           JANUARY 2022

© 2022 Morning Consult, All Rights Reserved.
ABOUT THIS REPORT

Morning Consult’s monthly U.S Economic Outlook report provides an integrated
assessment of the strength of U.S. consumers, workers and households.

Businesses and investors rely on this report to understand emerging trends in
consumer demand, employment and personal finances.

The report draws on Morning Consult Economic Intelligence, a high-frequency,
global economic dataset, reflecting more than 11,000 daily economic surveys across
the 15 largest global economies.

                                                                                     2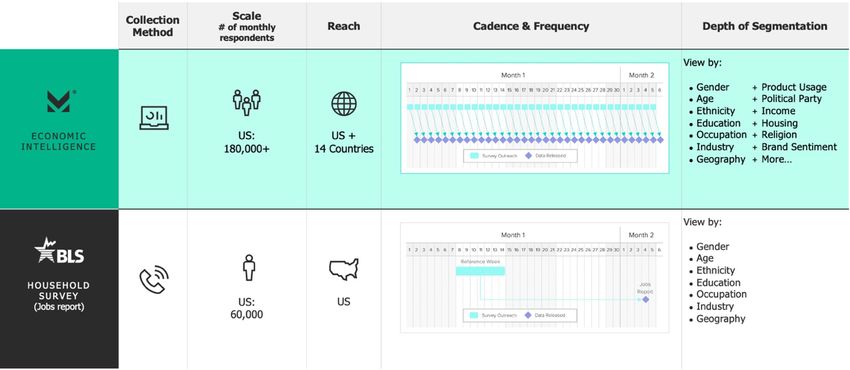
IN THIS REPORT

 4      U.S. Economic Outlook: January 2022

 7      Consumer Confidence

14      Employment

27      Spending

30      Price Expectations

35      Personal Finances, Consumer Credit and Housing

43      Methodology

                                                         3
SECTION 1

U.S. ECONOMIC OUTLOOK:
JANUARY 2022
SUMMARY

      Confidence                                          Employment                                        Personal finances
      Despite a rapid increase in cases, U.S.             Rising COVID-19 cases negatively affected         Financial vulnerability increased in
      consumer confidence fell moderately in              workers and job seekers in December. The          December, with 22.3% of American adults
      December. Morning Consult’s Index of                incidence rate of pay or income losses spiked     unable to pay their bills for a full month
      Consumer Sentiment has fallen 0.9% since            the week ending Dec. 18 before falling the last   using just their savings. Increases in the
      the onset of the omicron-driven surge in            full week of the month. This moderate but         costs of basic monthly necessities relative
      COVID-19 cases, significantly below the 7%          temporary increase in lost pay provides yet       to wages are eating into Americans’
      drop experienced during the delta-driven            another signal of the growing resilience of the   savings. If financially vulnerable adults were
      surge in cases. While U.S. consumers have           U.S. economy to the pandemic. Companies           to lose their sources of income, they would
      grown more resilient to COVID surges,               are holding onto workers even as cases rise       rapidly fall behind on their payments,
      they are not yet in the clear, particularly as      since they expect future demand to hold up.       setting off a series of negative economic
      the global economic recovery suffers due            Given ongoing worker shortages, it makes          and financial outcomes that the United
      to omicron.                                         more financial sense for companies to retain      States has thus far avoided.
                                                          workers instead of laying them off and then
                                                          trying to rehire them.

U.S. Economic Outlook | New Challenges for the New Year                                                                                                      5
ECONOMIC INDICATORS DASHBOARD

                                                                CURRENT PERIOD                    PRIOR PERIOD                      CHANGE                IMPACT
        Consumer Confidence
        ICS                                                               89.4                           89.9                       0.5 pts ▼             NEGATIVE

        Employment
        Lost pay/income                                                   12.6%                          11.6%                        1.0% ▲              NEGATIVE

        Unemployment rate                                                 13.6%                          13.7%                       -0.1% ▼              POSITIVE

        Labor force participation rate                                   55.0%                          55.3%                        -0.3% ▼              NEGATIVE

        Employment to population ratio                                   47.5%                          47.7%                        -0.2% ▼              NEGATIVE

        Personal Finances
        Expenses were more than income*                                   13.8%                          16.4%                       -2.6% ▼              POSITIVE

        Financial vulnerability (unable
        to pay basic expenses for a full                                 22.3%                           21.5%                       0.8% ▲               NEGATIVE
        month using just savings)

      *Current period for this series reflects survey data collected the first week of the month asking about personal finances during the prior month;
      all other series compare the most recent data from the current month to the prior month

U.S. Economic Outlook | New Challenges for the New Year                                                                                                              6
SECTION 2

CONSUMER CONFIDENCE
CONSUMER CONFIDENCE REMAINS LARGELY STABLE DESPITE CASE SURGE
Morning Consult Daily U.S. Index of Consumer Sentiment
120 July 2021:
March 11, 2020: Dec. 27, 2020: Jan. 20, 2021:
WHO declares COVID- Trump signs second President Consumer confidence
115 begins to fall amid
19 a pandemic coronavirus relief Joe Biden’s
package into law inauguration COVID surge
110 March 13, 2020:
March 9, December
White House declares national
105 2020: 2021:
emergency over coronavirus pandemic
Dow Jones Consumer
100 Industrial Nov. 3, 2020: confidence
Average March 27, 2020: Election Day unfazed by
95 drops more President Donald Trump signs omicron
than 2,000 CARES Act into law
90 points March 6, 2021:
Senate passes
October 2021:
85 $1.9 trillion Supply issues
economic relief bill
and rising prices
80 Sept. 15, 2020: undermine
Average daily COVID-19 confidence
75 cases begin rising again
70
1
0
20
21
1
1
21
20
0
0
1
0
21
21
1
20
1
1
20
0
20
0
0
21
-2
-2
-2
l -2
r-2
-2
-2
-2
-2
-2
l -2
r-2
-2
-2
b-
g-
n-
p-
n-
b-
g-
p-
ay
ar
n-
ct
ec
ov
n-
Ju
ay
ar
ct
ec
ov
Ap
Ju
Fe
Ja
Ju
Au
Ap
Se
O
Fe
Ja
Ju
Au
M
Se
M
N
O
D
M
M
N
D
U.S. Economic Outlook | New Challenges for the New Year 8
SPIKE IN CASES HARDLY DENTED CONFIDENCE IN DECEMBER

                                                 New cases, 7-day moving average                                      • Morning Consult’s Index of Consumer Sentiment (ICS) fell
      300,000                                                                                                           by 0.5 points in December, giving up some of the gains
      250,000                                                                                                           experienced in November.
      200,000
                                                                                                                      • Possibly the most remarkable aspect of the decline in the
       150,000                                                                                                          ICS last month was that it was not worse, given the nearly
       100,000                                                                                                          unprecedented spike in cases in many parts of the
        50,000                                                                                                          country. Overall, the 7-day moving average for new daily
                0                                                                                                       COVID-19 cases in the United States rose from 73,000
                                                                                                                        near the end of November to 237,000 as of Dec. 27.
                                                          ICS, 7-day average                                          • On the positive side — and likely a key factor in the
             130                                                                                                        limited impact on confidence — hospitalizations and
             120                                                                                                        deaths have been slower to rise compared to other
              110
                                                                                                                        waves. Vaccinated adults especially are feeling more
             100
                                                                                                                        protected, which is critical in supporting confidence as
              90
                                                                                                                        adults inclined to receive the vaccine are also typically
              80
              70                                                                                                        more likely to have their confidence disrupted by rising
                                                                                                                        case counts.
            Au 2 0

            Au 2 1
             Fe 2 1

            N 21
             O 21
            Fe 2 0

            M 20

            N 20

             Ju 2 1
            O 20
             Ju 0

            M 21

              Ju 1
             Ap 21

            D 21
                      1
            Ap 20

            D 20

             Ja 0

             M 21

             Se 21
            M 20

            Se 20

                     2

                  -2
                 -2
                 -2

                b-

                g-
                 l-
                n-

                   -
                p-
                   -
                 r-

                n-
                  -

                  -
                l-
               b-

               g-

               ay
               ar
               n-

                r-

                 -

               ct
               p-

               ec
               ov
                 -

                 -
              ay
              ar

              ct

              ec
              ov
            Ja

      Source: Morning Consult Economic Intelligence, Our World in Data, Johns Hopkins University CSSE COVID-19 Data

U.S. Economic Outlook | New Challenges for the New Year                                                                                                                              9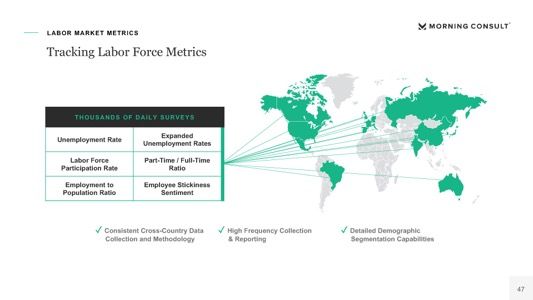
OMICRON TESTING NEWFOUND RESILIENCE

                      Morning Consult U.S. Index of Consumer Sentiment, by annual household income                                               • As previously reported, the U.S. economy
                                                  Rolling 30-day % change                                                                          has becoming increasingly resilient to
                                                                                                                                                   COVID-19 surges over the course of the
                        Adults              Less than $50,000             $50,000-$99,999                  $100,000 or more                        pandemic, with each major COVID-19
        15%
                                                                                                                                                   wave having a less severe impact on
       10%                                                                                                                                         consumer confidence.
         5%                                                                                                                                      • While the current wave of COVID-19 has yet
        0%                                                                                                                                         to peak, its impact on confidence has been
                                                                                                                                                   the most limited yet, with the 30-day rolling
        -5%                                                                                                                         -0.9%
                                                                                                                                                   % change in the ICS reaching only -0.9% as
                                                                                                                                Omicron-driven
       -10%                                                                                                  -7.0%               COVID surge       of Dec. 28.
       -15%                                                      -7.6%                                     Delta-driven
                                                                                                                                                 • Despite increasing resilience, the U.S.
                                                                                                           COVID surge
                                                                 Second
      -20%                                                     widespread                                                                          economic recovery is looking increasingly
                                                             COVID outbreak                                                                        fragile amid the rapid increase in new
      -25%                  -27.6%                                                                                                                 COVID-19 cases. Historical data suggests
                             Initial U.S.
      -30%                  COVID wave
                                                                                                                                                   that confidence could fall further as offices
                                                                                                                                                   shutter, airlines cancel flights and plans are
      -35%
              0 20 0 0 20 0 20 0 0 0 20 20 2 1 21 21 2 1 2 1 21 2 1 -21 2 1 2 1 21 21                                                              widely disrupted, with the pandemic
         eb -2 ar- p r-2 ay-2 un- Jul -2 ug - e p-2 c t-2 c t-2 ov- ec- Jan- Feb - Mar- Ap r- ay- Jun- Jul - Aug Se p- Oc t- Nov- Dec-             remaining the primary risk to economic
        F     M A M J                  A S         O O N D                                   M
                                                                                                                                                   activity moving into 2022.
      Source: Morning Consult Economic Intelligence

U.S. Economic Outlook | New Challenges for the New Year                                                                                                                                             10
WORRYING DECLINE IN PERCEPTIONS OF PERSONAL FINANCES
• Like November, an improving outlook for business Change in ICS and each of its components (Nov. 30 to Dec. 28)
conditions in the near term helped buoy the overall index,
with 12-month expectations rising 1 point in December.
Business Business Personal Personal
• However, the overall ICS declined 0.5 points in Conditions: Current Conditions: Finances: Finances: ICS
December, while the four remaining components of the 12-month Buying 5-year Current 12-month (Consumer
expectations Conditions expectations conditions expectations Sentiment)
index fell into the red, including expectations for longer-
term business conditions.
• Most alarming is the continued decline in perceptions of
1.0
current and future personal finances. Rising prices and
the omicron surge are having a real impact on
pocketbooks. As households begin to feel less certain
about their own finances, consumers may begin to pull -0.5
-0.2
back on spending, undermining the engine of the current -0.8
economic recovery. -1.0
-1.6
Source: Morning Consult Economic Intelligence
U.S. Economic Outlook | New Challenges for the New Year 11OLDER CONSUMERS SLOWER TO REGAIN CONFIDENCE
• Older adults face much higher health risks Morning Consult Daily Index of Consumer Sentiment
from COVID-19, so it is no surprise that (% change from Jan. 1, 2020)
consumer confidence among baby boomers
Baby boomers Gen Xers Millennials Gen Zers
and Gen Xers fell further and has remained 5%
lower over the course of the pandemic.
0%
• In addition to public health risks, disparate
concerns over rising prices have also -5%
helped to widen the gap in recent months. -10%
Retired adults on fixed incomes face the
prospect of having their purchasing power -15%
eroded by inflation. Additionally, older -20%
Americans lived through the high inflation
period of the 1970s and 1980s and -25%
experienced the economic troubles that -30%
came with it.
-35%
-40%
c- 1
9
b -20 pr-20 n-2
0
g-2
0
t -2
0
c- 2
0
b -21 p r-2
1
n -21 g-21 c t -2
1
c -21
De F e A J u u Oc e Fe A Ju A u O De
A D
Source: Morning Consult Economic Intelligence
U.S. Economic Outlook | New Challenges for the New Year 12DETERIORATION IN GLOBAL CONFIDENCE POSES RISK TO U.S. ECONOMIC RECOVERY
• The rebound in global consumer confidence Morning Consult Index of Consumer Sentiment
continued to languish in December. For the (monthly averages, % change from beginning of pandemic)
third time in the last five months, the average 20%
change in Morning Consult’s ICS across all 12
major economies fell in December. From May
10% Japan
2020 to July 2021, average global consumer
France
confidence increased each month. Australia
• Even though U.S. consumer confidence appears 0% China
Mexico
stable in the face of the omicron variant, India
Russia
ongoing deterioration in global confidence acts -10% Canada
as a headwind to the U.S. economic recovery. U.K.
Germany
• China poses one of the largest risks to the U.S. Brazil
-20%
economy: While Chinese consumers remain U.S.
more optimistic about the economy relative to
October 2019, confidence has declined in -30%
recent weeks amid COVID-19 outbreaks and
growing housing market weaknesses. -40%
Prolonged lockdowns or business closures in
p-1
9
c- 1
9
r- 2
0
n-2
0
p-2
0
c- 2
0
ar- 2
1
n -21 p-2
1
c -21
China will likely exacerbate ongoing supply Se De M a J u Se De M Ju Se De
chain disruptions in the United States.
Source: Morning Consult Economic Intelligence. Index period is January 2020
for all countries except China, which is indexed to October 2019.
U.S. Economic Outlook | New Challenges for the New Year 13SECTION 3 EMPLOYMENT
DECEMBER’S SPIKE IN PAY LOSSES HIGHLIGHTS ECONOMY’S RESILIENCE
Share of U.S. adults who lost pay or income in the previous week, and • THE BAD: Morning Consult’s weekly lost pay or income
unemployment insurance initial claims tracker jumped in mid-December to reach its highest level
since June before easing in the week ending Dec. 25. The
Lost pay or income Initial claims, NSA Initial claims, SA spike was driven by the omicron variant as well as
seasonal factors, with companies laying off temporary
26% 3,000,000 hires brought on to accommodate the seasonal demand
July 31, July 31,
24% for workers.
2020: 2020:
2,500,000
$600 Sept. 4, $600 • THE GOOD: Based on Morning Consult’s data, rising
22% Sept. 4,
enhanced 2021: enhanced cases in mid-December produced a short and relatively
2,000,000 2021:
20% benefits $300 benefits
$300 mild increase in the incidence of lost pay. Given the
expire enhanced expire
enhanced stability of consumer confidence in the face of rising case
18% benefits 1,500,000
benefits
expire counts, businesses so far appear more concerned with
16% expire
1,000,000 retaining workers as a buffer against labor shortages than
14% with downsizing operations in case of potential demand
500,000 softening from omicron.
12%
• UNEMPLOYMENT CLAIMS MISS THE STORY: Morning
10% 0
Consult’s data provides novel insight into the omicron
Ja 0
M 1
21
No 0
0
No 1
1
Se 0
Se 1
M 1
Ja 0
M 21
21
No 0
0
No 1
1
Se 0
Se 1
M 1
l -2
2
-2
2
-2
l -2
2
l -2
2
2
-2
2
-2
variant’s true impact on employment since — unlike
l -2
2
2
-2
n-
v-
p-
n-
-
v-
p-
v-
p-
ar
ay
v-
Ju
p-
ar
ay
ay
Ju
Ju
ay
Ju
M
M
weekly unemployment insurance claims — the share of
adults experiencing pay or income losses is not
Source: Morning Consult Economic Intelligence, weekly surveys of a representative sample
influenced by changes in unemployment benefit eligibility.
of 20,000 U.S. adults on average
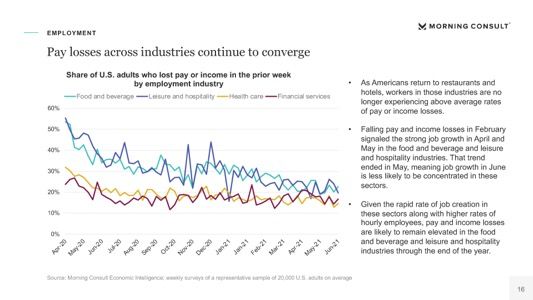
U.S. Economic Outlook | New Challenges for the New Year 15PAY LOSSES ACROSS DIFFERENT INDUSTRIES CONTINUE TO CONVERGE
• Pandemic-affected sectors are once again showing Share of U.S. adults who lost pay or income in the prior week, by employment industry
improved resilience to rising cases as consumers and (4-week moving average)
businesses adapt to living and working during the
pandemic with fewer disruptions to economic activity. Construction Financial services Food & beverage
• As of the week ending Dec. 25, 19.1% of workers in the Leisure & hospitality Manufacturing Technology
food and beverage industry reported a loss of pay or 60%
income. While the incidence rate remains higher than in
other industries, the food and beverage industry is no 50%
longer the outlier it once was.
• The relatively limited uptick in lost pay or income among 40%
food & beverage and leisure & hospitality workers during
the omicron surge provides an additional signal to out-of- 30%
work adults considering applying for jobs.
20%
• Looking ahead, the temporary and mild employment
impact of omicron on pandemic-affected industries will 10%
likely drive additional adults back into the labor force, as
was the case following the limited impact of the delta 0%
variant on pay losses.
Au 2 1
Au 2 0
Fe 1
M 21
O 1
N 21
O 1
O 0
N 20
Ju 1
O 0
Ju 0
Ju 1
Ap 1
Ju 0
D 21
1
Se 20
D 20
Ja 0
M 1
Se 21
2
-2
-2
2
2
-2
2
-2
2
-2
-2
2
-2
l-
b-
g-
n-
r-
-
p-
n-
-
g-
l-
ay
ar
-
ct
ct
p-
ec
ov
n-
-
ay
ct
ct
ec
ov
M
Source: Morning Consult Economic Intelligence; weekly surveys of a
representative sample of 20,000 U.S. adults on average
U.S. Economic Outlook | New Challenges for the New Year 16JOBS GROWTH SUFFERED A SETBACK IN LATE DECEMBER
U.S. (4-week moving average)
Note differences in scales
Unemployment Rate Employment to Population Ratio Labor Force Participation Rate
18% 50% 58%
16% 48% 56%
14% 46% 54%
12% 44% 52%
/ 21
/ 21
/20
/20
/21
/21
/21
/21
/21
/21
/21
/21
/21
/20
/20
/21
/ 21
/21
/21
/21
/20
/20
/21
/21
1/ 12
1/ 12
7/ 12
5/ 12
9/ 12
5/ 12
9/ 12
11/ 12
11/ 12
7/ 12
3/12
3/12
5/ 12
9/ 12
11/ 12
1/ 12
7/ 12
3/12
9/ 12
11/ 12
9/ 12
11/ 12
9/ 12
11/ 12
• Unemployment rate holds steady. Despite the rapid spread of the omicron • After peaking at 55.5% in early December, labor force participation
variant, unemployment held relatively steady over the month of December. dropped to 55.0% over the second half of the month. Seasonal factors and
Relative to prior surges, businesses appear to be responding with fewer the spread of the omicron variant likely contributed to the shrinking
layoffs this time, signaling that employers’ concerns about ongoing labor workforce. More than half of those leaving the labor force in December
shortages may be outweighing their desire to pre-empt possible pandemic moved from into the “Other” category, meaning that they did not identify as
impacts on business activity. homemakers, students, retirees or disabled.
Source: Morning Consult Economic Intelligence
U.S. Economic Outlook | New Challenges for the New Year 17DECLINE IN LABOR FORCE PARTICIPATION MOSTLY DRIVEN BY VACCINATED ADULTS
U.S. labor force participation rate by vaccination status (4-week moving average) • Vaccinated adults drove the recent decrease in labor force
participation. As cases began to surge in December, vaccinated
Vaccinated Not vaccinated, and not planning to get it adults — who tend to be more concerned about contracting
57% COVID-19 — stopped looking for work and dropped out of the
labor force.
56%
• Labor force participation changed little for unvaccinated adults,
55%
suggesting that those who are not vaccinated and do not plan
54% to get a COVID-19 vaccine are less likely to opt out of working
53% due to health concerns associated with the pandemic, despite
the higher mortality rate among the unvaccinated.
52%
• Looking ahead, higher vaccination rates are unlikely to directly
51%
lead to higher labor force participation rates, but vaccinations
50% do play a critical, albeit indirect role in supporting job search
49% activity. The indirect impact of vaccinations on labor force
participation can already be felt: Vaccinations allowed the U.S.
/ 21
/ 21
1
1
1
21
/ 21
/ 21
3/21
/21
1/21
5/21
8/21
5/21
/21
/21
7/21
6/ 2
0/ 2
0/2
9/ 4/
economy to remain open during the delta and omicron case
9/ 18
12/ 4
11/ 13
11/ 6
9/ 11
10/ 9
10/ 2
12/ 1
11/ 2
10/ 2
9/ 2
12/ 1
12/ 2
10/ 1
11/ 2
10/ 3
surges, supporting the demand for workers despite rising cases
and encouraging out-of-work adults — vaccinated and
unvaccinated — to look for jobs.
Source: Morning Consult Economic Intelligence
U.S. Economic Outlook | New Challenges for the New Year 18LABOR FORCE PARTICIPATION CONTRACTED SHARPLY FOR MIDDLE-INCOME ADULTS
U.S. unemployment rate by annual household income (4-week moving average) • In mid-December, joblessness for those with under $50,000
Note differences in scales in annual household income fell to nearly its lowest level
since the start of the series before flattening out over the
Under $50,000 $50,000-$99,999 $100,000 or more second half of the month. This group is the only one that has
26% 12% 8% not reached a new series low in terms of unemployment
within the past month. The lowest income group reported the
24% 10% 6%
least fluctuation in workforce membership recently, with the
22% 8% 4%
participation rate ranging between 48.4% to 48.6% over the
20% 6% 2% past six weeks.
/2 1
/2 1
/2 1
/2 1
11 /12 0
/2 0
/2 0
/2 0
/2 1
11 /12 1
/2 1
/2 1
/2 1
/2 1
3 /12 1
/21
/2 1
/2 1
/2 1
/2 1
/2 0
/2 0
/2 1
/21
/2
/2
/2
• The share of adults earning $50,000-$99,999 who said they
7/1 2
7/1 2
1/1 2
1/1 2
3 /12
11 /12
5/12
9/12
5/12
9/12
7/1 2
1/1 2
3 /12
5/12
9/12
11 /12
9/12
9/12
11 /12
9/12
11 /12
are currently working or looking for work declined sharply
over the second half of the month, falling from a series high
U.S. labor force participation rate by annual household income (4-week moving average)
Note differences in scales of 61.8% on Dec. 11 to 61.0% on Dec. 25.
• For those earning $100,000 or more, unemployment
50% 64% 74%
increased slightly over the second half of December. Adults
48% 62% 72% with higher incomes may have felt more able to separate
46% 60% 70% from jobs for seasonal reasons or to avoid exposure to the
omicron variant.
44% 58% 68%
/2 1
/2 1
/2 1
/2 0
/2 1
/2 1
11 /12 1
/2 1
11 /12 0
11 /12 0
/2 0
/2 1
11 /12 1
3 /12 1
/2 1
3 /12 1
/2 1
/2 0
/2 1
11 /12 1
/2 1
11 /12 0
/2 1
3 /12 1
/2
/2
/2
/2
/2
/2
/2
/2
/2
7/1 2
1/1 2
7/1 2
1/1 2
5/12
5/12
9/12
9/12
7/1 2
1/1 2
5/12
9/12
9/12
9/12
9/12
Source: Morning Consult Economic Intelligence
U.S. Economic Outlook | New Challenges for the New Year 19GOVERNMENT DATA LIKELY TO REPORT FALLING UNEMPLOYMENT IN DECEMBER
Morning Consult high-income earners’ unemployment rate (4-week moving average) • Morning Consult’s unemployment rate for those in
vs. BLS unemployment rate (NSA) households earning $100,000 or more per year is strongly
positively correlated (.93) with the Bureau of Labor Statistics’
Morning Consult Bureau of Labor Statistics Forecast
headline unemployment rate. Midway through the month of
9%
December, high earners reported lower rates of joblessness
8% compared with a month prior.
7% • The BLS reference week falls in the first half of the month;
December’s unemployment number is therefore likely to
6%
stay flat around 3.9%.
5%
• Over the second half of December, Morning Consult found
4% that unemployment ticked slightly higher, but this occurred
after the period during which the BLS collects data for
3%
December and will likely not be reflected in government
2% data until the subsequent jobs report.
1%
0%
- 21
21
- 21
- 21
- 21
- 20
- 21
- 21
- 21
- 20
-20
-21
-21
-21
-21
-20
Jul-
Au g
Apr
Sep
May
Mar
Dec
Jan
Oct
F eb
Jun
Nov
Sep
Dec
Oct
Nov
Source: Morning Consult Economic Intelligence, Bureau of Labor Statistics
U.S. Economic Outlook | New Challenges for the New Year 20‘MORE MONEY’ TRUMPS OTHER MOTIVATORS FOR ACTIVE JOB SEEKERS
• Prior to the onset of omicron, more and more Share of active job seekers (both with and without jobs) who cited the following as what
workers in the United States were coming in off prompted them to look for work:
the sidelines and re-entering the labor force. At
the same time, a growing share of employed I wanted to earn more money 59%
workers are looking for a move.
• The reason for the uptick in active applicants is I ran out of savings 15%
clear: more money. In December, 59% of active
I wanted intellectual stimulation
applicants cited a desire to earn more money as or felt bored at my job 13%
a reason that prompted them to look for work,
dwarfing the next highest response. None of the above 9%
• While the prospect of a pay bump in a tight
My unemployment benefits ran out 8%
labor market is the primary driver, job seekers
also cited a lack of savings and a desire for
Other (please specify) 8%
intellectual stimulation as key motivators. If
savings continue to fall, more adults may begin Health concerns no longer
prevented me from working 8%
looking for work.
My home responsibilities no longer
prevented my ability to work 7%
Source: Morning Consult Economic Intelligence, survey conducted My investments or retirement fund
Dec. 14-18, 2021, among a representative sample of 2,191 U.S. adults. were not producing enough income 7%
Chart shows a subsample of 500 U.S. adults that were looking for
work in the past 4 weeks, with a margin of error of +/-4%.
U.S. Economic Outlook | New Challenges for the New Year 21GROWING SHARE OF PART-TIME WORKERS SEEK FULL-TIME WORK
• In December, the share of U.S. adults Would you like to work more than 35 hours per week? Of those who responded “No”, why?
who worked fewer than 35 hours per
week and said they would like to work
more hours inched higher to 48% from Yes Don't know No
Other family/
100%
personal
47% the month prior, continuing the
90% Other obligations
upward trend that began in August. 15%
80%
Child care
• The share of respondents who said 70% obligations
6% 37%
they did not want to work more than 60%
Health/
part-time also declined compared 50% medical 9%
limitations
to November. 40%
30% 16%
• Family or personal obligations other Retired/Social 17%
20%
than child care remained the most Security limit
10% on earnings School/
prominent reason for not wanting to training
0%
work more hours, but the share citing
0
1
20
20
0
0
1
21
21
1
1
0
20
21
1
21
20
20
21
21
21
Jun- 2
Jul -2
Jan-2
Ap r-2
Oc t-2
Jun- 2
Jul -2
Ap r-2
Oc t-2
health or medical limitations increased
Feb -
Aug -
May-
Se p-
Dec-
Mar-
Nov-
Aug -
May-
Se p-
Dec-
Nov-
from 13% to 16% between November
and December as concerns over the
omicron variant intensified.
Source: Morning Consult Economic Intelligence; monthly surveys of an average of 542 U.S. adults that worked
fewer than 35 hours per week, and 240 who did not want to work more than 35 hours per week in November.
U.S. Economic Outlook | New Challenges for the New Year 22OMICRON HAS YET TO RATTLE WORKERS
Share of employed U.S. adults who expect to experience a loss of • Workers who held onto their jobs
employment income in the next 4 weeks
in December largely expected to
avoid future pay losses, even in
the face of rising cases.
• Expectations for future
24.6%
23.2% employment income loss declined
22.4% 22.3% 22.3%
20.7% in December after nudging higher
19.8%
18.8% 19.1% the previous month. In December,
17.0% 16.7% 14.1% of employed U.S. adults said
14.6% 14.4% 14.1% they expected to lose income over
13.0% 13.3% 12.8% 13.5% 13.4%
the next 4 weeks after labor
metrics showed steady
improvement through the first half
of the month.
• Surveys are conducted mid-month,
meaning that December’s results
reflect workers’ level of concern
21
1
21
0
20
20
20
1
21
21
21
20
1
21
1
21
0
20
1
-2
l- 2
r-2
-2
-2
l- 2
-2
n-
p-
n-
c-
b-
g-
v-
p-
n-
v-
c-
ar
ct
g-
ay
even after news of omicron
Ju
ct
Ap
Ju
De
Ja
Ju
No
Fe
Au
Se
O
No
De
Ju
Au
M
Se
M
O
dominated the U.S. media.
Source: Morning Consult Economic Intelligence, monthly surveys conducted among an average sample of roughly 1,000 employed U.S. adults
U.S. Economic Outlook | New Challenges for the New Year 23ACTIVE APPLICANTS DECLINED, THOUGH MORE THAN HALF OF WORKERS ARE STILL
OPEN TO JOB-SWITCHING
• While omicron did not elevate workers’ job-loss Share of U.S. workers actively applying for new positions (4-week moving average)
concerns, a smaller share of the total workforce
actively applied for new positions last month. In 20%
late December, 18.1% of employed workers
were actively applying for new positions, down
from 18.6% in late November.
• Despite the decrease in active applicants, 18%
employers worried about retaining their workers
are not yet out of the woods: While active
applicants fell, the share of workers open to
new positions climbed to a series high of 33.4%.
16%
In other words, a record-high share of workers
remain open to taking a new position.
• When new cases decrease, workers who are
open to new positions are likely to return to 14%
actively applying for them, driving quits higher
/2 1
/2 0
/2 1
/2 1
/2 1
/2 0
/2 1
/2 1
/2 1
/2 1
/2 1
/2 0
21
/21
/20
21 /
/
7/1 2
2
1/1 2
2
3 /12
4 /12
11 /12
2/12
5/12
6/12
8/12
9/12
2
2
11 /12
throughout 2022.
9/12
12/1
10 /1
12/1
10 /1
Source: Morning Consult Economic Intelligence
U.S. Economic Outlook | New Challenges for the New Year 24LARGE SHARE OF WORKERS LOOKING TO RENEGOTIATE
Share of employed adults who have done the following in the past 12 months: • With job openings exceeding
job seekers, the average U.S.
worker is feeling emboldened to
Adults Men Women
use newfound leverage to ask
28% for increases in compensation
Asked for a raise 30%
and benefits.
25%
• In the last 12 months, 28% of U.S.
21% workers have asked for a raise,
Asked for a bonus 24%
16% 21% have asked for a bonus and
20% have asked for a promotion.
20%
Asked for a promotion 27% • Male workers were far more likely
13% to have negotiated than their
female colleagues. For example,
16%
Renegotiated your starting while 27% of male workers asked
21%
salary or benefit package
11% for a promotion this past year,
only 13% of female workers had
16%
Asked for an increase in the done so.
20%
number of paid vacation days
11%
Source: Morning Consult Economic Intelligence, survey conducted Dec. 14-18, 2021, among a representative sample of 1122 employed U.S. adults, with a margin of error of +/-3%.
U.S. Economic Outlook | New Challenges for the New Year 25MORE SOUTHERN WORKERS SATISFIED WITH BENEFITS, PAY
Share of employed adults who said they were “very satisfied” with each of the following • Workers in the South are more
aspects of their job: likely to express satisfaction with
their compensation and benefits,
South Midwest Northeast West
with the region ranking highest in
four of the five categories tracked
by Morning Consult — benefits,
51%
compensation, parental leave and
45% 45% paid time off.
42%
40% 40%
38% 38% • The West ranked highest among
36%
34% 33% the four regions in the share who
32%
31% 31% 30% said they were very satisfied with
29% 29% 29%
27% 27%
flexibility in work hours.
• Among the categories surveyed by
Morning Consult, U.S. workers
were overall more likely to say
they were very satisfied with
flexibility and vacation policies,
Benefits Compensation Flexibility in Maternity/ Paid time off/
work hours paternity leave Vacation policy while pay, overall benefits and
maternity/paternity leave lagged.
Source: Morning Consult Economic Intelligence, survey conducted Dec. 14-18, 2021, among a representative sample of 1122 employed U.S. adults, with a margin of error of +/-3%.
U.S. Economic Outlook | New Challenges for the New Year 26SECTION 4 SPENDING
U.S. ADULTS ALLOCATED ABOUT 34% OF MONTHLY HOUSEHOLD EXPENDITURES TO
HOUSING IN NOVEMBER, AND ABOUT 14% WENT TOWARD GROCERY PURCHASES
• Consumers continued to shift spending Reported average monthly spending in November by category, U.S. adults
toward discretionary categories as
incomes increased and lower spending $1,069
on staple goods and services freed up
space in monthly budgets.
• Soaring prices are discouraging Total = $3,105
▼ $11 from October
spending on housing, cars and food.
Spending at grocery stores and
restaurants was muted as higher $424
ingredient costs and worker wages
drove up prices in supermarket aisles $194
$142 $142 $135 $122 $113
and on menus. $101 $98 $95 $87 $78 $73
$65 $57 $44 $35
$32
• As expenditures declined on staple
categories like housing, cars and food,
Re tion
E d re l
m
e
Ap e
g
re
o n re p h o l
su s
ns as
Fu nt
y
p o re
s
T e rs
es
se ts
n
ea ure
el
ie
er
t io
nc
c
in
c
co
Ca
ra
fa
ca
G
ic
an
pa
consumers were left with more space
ilit
ot
ca odu
s
co
c
it
ra
a
rta
tra Air
au
rv
ou
le
ro
rn
H
ur
lth
uc
Ut
Al
st
G
r
H
in household budgets for discretionary in
re
ns
ri
H
lth
Ca
a
categories like travel, personal care
lc
ea
al
ic
a
H
bl
on
and apparel.
rs
Pu
rs
Pe
Pe
Source: Morning Consult Economic Intelligence
U.S. Economic Outlook | New Challenges for the New Year 28TRANSPORTATION CATEGORIES AND DISCRETIONARY GOODS SAW A BOOST IN
SPENDING IN NOVEMBER
Percentage change in spending among U.S. adults from October to November 2021 • Total average spending changed little
from October to November, but
10% consumers continued to reallocate
7% purchases away from staple goods
6%
4% 4% 4% and toward transportation and other
3%
2% 2% 1% discretionary categories.
0% 0%
• Households spent less on housing,
0% -1% health care and food — though they
-1%
-2% -3%
also cut back on alcohol and
-5%
restaurant spending.
-11% • Housing and food prices continue
to climb amid ongoing shortages,
potentially discouraging spending
Ap n
Te e l
ce
ce
au g
H re
l
s
uc s
m
ea ery
es
rs
Al s
se e
ns cts
n
Fu els
re
ho
a
nt
re ilitie
io
io
Re usin
re rfar
r
Ca
co
itu
ca
ic
G
an
an
pa
u
at
ot
ra
lth tat
co
c
rv
Ca rod
le
ro
rn
in these categories.
i
ur
ur
H
lth
t
A
o
ea por
U
G
s
Ed
st
p
in
ns
ri
H
ca
• Transportation spending increased as
ca
tra
al
al
lic
H
on
the holiday season began, while goods
on
b
rs
Pu
rs
Pe
Pe
categories like apparel and furniture
also saw rising outlays.
Source: Morning Consult Economic Intelligence
U.S. Economic Outlook | New Challenges for the New Year 29SECTION 5 PRICE EXPECTATIONS
INFLATION EXPECTATIONS DECLINED SLIGHTLY IN LATE DECEMBER DESPITE RISING CPI

                  Average inflation expectations for the next 12 months and historical inflation        • U.S. adults said they expect prices to rise 5.3% on
                                      growth over the previous 12 months                                  average over the next 12 months (excluding outliers),
                                                                                                          implying a slightly softer pace of price growth than that
                                    Inflation expectations              Year-on-year change in CPI
                                                                                                          seen over the past 12 months according to the Bureau of
      8.0%                                                                                                Labor Statistics’ consumer price index, which stood at a
                                                                                             November     near 40-year high of 6.8% in November.
      7.0%
                                                                                  October
                                                                                                        • Unlike the highly volatile first half of the year, inflation
      6.0%                                            June                                                expectations have essentially stabilized since peaking at
                                                             July   August September
                                          May                                                             5.6% in mid-October.
      5.0%
                               April                                                                    • Observed inflation is likely to remain elevated through the
      4.0%                                                                                                first quarter of 2022 as supply chain disruptions persist
                                                                                                          and prices continue to come in above those from early
      3.0%                                                                                                2021. While inflation is likely to ease later in the year,
                            March
                                                                                                          surging COVID-19 cases across the globe threaten to
      2.0%
                     February                                                                             derail progress with border closures and factory
       1.0%                                                                                               shutdowns, which could limit the supply of goods
                                                                                                          throughout next year.
         3/ /21

         7/ /21
          5/ 21

         12 /21
        8/ /21

          /2 1
        5/ /21

          7/ 21
         2/ /21

         4/ /21

         8/ /21

        12 /21
         4/ /21

          6/ 21

          9/ 21

                  1
          11/ 21
         6/ /21

        9/ 1/21

        11/ /21
           7/ 1
         3/ /21

         10 /21
       10 9/2

                /2
               /2
                /

                /

              3/
               /

              3/
              8

            14
           22

           28

           20

           /18
            17
            27

              5

              6
            19
            13

           25

            /4
            13

            10
           24
           27

            31

             1

            /
         2/

                                                                                                        Source: Morning Consult Economic Intelligence, Bureau of Labor Statistics

U.S. Economic Outlook | New Challenges for the New Year                                                                                                                             31
THE SHARE OF ADULTS WHO ARE EXPECTING HIGHER PRICES DECLINED ACROSS MOST
CATEGORIES
Percentage-point change from October to November in the share of consumers who • Inflation has risen sharply across many categories as
said they expect prices to rise over the next 12 months in the following categories:
supply chain disruptions and strong consumer demand
drive up prices for cars, homes, grocery items and gas.
Food and groceries -4.1% • The share of consumers expecting further price increases
Electronics, computers or cellphones -2.8% decreased in nearly every category in November as
supply chain disruptions began to ease.
Energy and utility bills -2.1%
• Grocery prices — which spiked 6.4% year-on-year as of
A used car, pickup, van or sport utility vehicle -2.0%
November — had the biggest drop in the share of
A house or apartment -1.8% consumers expecting price increases. The pace of
A new car, pickup, van or sport utility vehicle -1.5% monthly price increases for this category peaked at 1.2%
in September and slowed in each subsequent month as
Motorcycles -1.5% supply chain disruptions began to ease.
Furniture -1.1%
Home appliances -1.0%
Home repairs, improvements or renovations -0.5%
Trips and vacations 0.2%
Source: Morning Consult Economic Intelligence, monthly surveys conducted among a representative sample of 1,000 U.S. adults each
U.S. Economic Outlook | New Challenges for the New Year 32PRICE EXPECTATIONS FOR HOUSING OVER THE NEXT 12 MONTHS FELL IN NOVEMBER
Share of U.S. adults who expect housing prices to increase in the next 12 months, • The share of U.S. adults expecting price increases for
by community type housing over the next 12 months declined across all
community types, consistent with the recent slowdown in
the pace of annual price growth implied by the Case-
Rural Suburban Urban All U.S. adults
Shiller home price index.
• The latest shift in price expectations extended a roughly
The share of urban adults expecting price increases dropped,
70% flat trend over the past five months; while a slight majority
reversing a 3-month upward trend
continue to expect further price growth, the relative
60% stability of responses suggests people anticipate steadier
50% price gains, if not an actual slowdown.
• As monthly payment amounts fell for suburbanites, price
40%
expectations climbed; the recent fall in housing expenses
30% for those areas may be extending the runway for price
growth. Urban adults, meanwhile, reported a drop in price
20% expectations as payment amounts remained stable.
10%
0%
21
1
21
1
1
21
1
21
1
1
1
l- 2
-2
-2
r-2
-2
-2
-2
n-
n-
b-
g-
p
ay
ar
ct
v
Ju
Ap
Ju
No
Fe
Ja
Au
Se
O
M
M
Source: Morning Consult Economic Intelligence
U.S. Economic Outlook | New Challenges for the New Year 33EXPECTATIONS FOR RISING FOOD PRICES DECLINED IN NOVEMBER
• 80% of adults ages 65 and older expect food prices to rise Share of U.S. adults expecting food prices to increase in the next 12 months,
over the next 12 months, up from 66% in February. People by age
in this age group, many of whom are retired and living off
fixed incomes, tend to worry more about inflation than 18-34 35-44 45-64 65 and over Adults
90%
working adults who can expect wages to rise in accordance
with prices. 80%
70%
• Those under age 35 — who tend to worry less about
inflation since rising wages might be expected to keep 60%
pace with price growth — were least likely to expect price
50%
increases. The gap between the oldest and youngest
adults expecting price growth widened to 36 percentage 40%
points from 27 points the prior month. 30%
• Overall, the share of adults expecting further price 20%
increases for food and groceries declined as supply chain 10%
congestion showed signs of easing in November compared
with the prior month, potentially alleviating some of the 0%
21
1
1
21
21
1
1
1
shortages that had driven up food costs.
1
1
-2
l- 2
-2
-2
-2
r-2
-2
n-
b-
g-
p
ar
ct
ay
v
Ju
Ap
Ju
No
Fe
Au
Se
O
M
M
Source: Morning Consult Economic Intelligence
U.S. Economic Outlook | New Challenges for the New Year 34SECTION 6 PERSONAL FINANCES, CONSUMER CREDIT AND HOUSING
THE SHARE OF HOUSEHOLDS WHERE EXPENSES EXCEEDED MONTHLY INCOME
      DECREASED TO ITS LOWEST LEVEL SINCE JUNE

                 After you paid your recurring expenses last month, did you have any money left                         Of those who said their expenses were more than their
                                 over that you could save or add to your savings?                                           income, 75% earned less than $50,000 per year

                             No, our expenses were more than our income
                             No, our expenses roughly equaled our income with nothing left over
                                                                                                                                       $100,000 or more
                             Yes, we had some money left over                                                                                5%

              16%        14%        13%        12%        14%      14%      16%         15%    17%     16%     14%

                         25%       26%        25%         26%     25%                                          27%                  $50,000-
              28%                                                           26%         26%    26%     25%
                                                                                                                                    $99,999
                                                                                                                                      20%

                                                                                                                                                       Under
              56%        61%        61%       63%         60%      61%      57%         58%    58%     59%     59%                                    $50,000
                                                                                                                                                        75%
                                                                  21
                                                          21

                                                                               1
                        21

                                     1

                                                                                                                1
                                                                                       21
                                               1
             21

                                                                                                        1
                                                                                                1
                                                                           l- 2
                                   -2

                                                                                                              -2
                                            r-2

                                                                                                      -2
                                                                                              -2
           n-

                                                                  n-
                                                        -
                     b-

                                                                                    g-

                                                                                               p
                                                     ay
                                ar

                                                                                                      ct

                                                                                                               v
                                                                         Ju
                                          Ap

                                                                Ju

                                                                                                            No
                   Fe
         Ja

                                                                                   Au

                                                                                            Se

                                                                                                     O
                              M

                                                   M

      Source: Morning Consult Economic Intelligence, monthly surveys conducted among a representative sample of 2,200 U.S. adults

U.S. Economic Outlook | New Challenges for the New Year                                                                                                                         36
FINANCIAL VULNERABILITY INCREASED IN DECEMBER
Share of adults lacking savings to pay basic expenses for a full month • The share of Americans who lack
savings to cover their basic expenses
Sept. 4, 2021:
June 2021: for a full month rose to 22.3% in
July 31, 2020: Federal
$600 per week States begin terminating unemployment December as inflation continued to
federal unemployment expanded federal unemployment benefits expire drive up costs for food, gas and other
benefits expire benefits (26 states total by Aug)
staple goods.
24.5%
22.8% 22.6% 23.1% 22.9% 22.6% • Financial vulnerability declined
21.9% 21.4% 22.3%
21.5% 21.0% 21.1% 21.5%
20.5% 20.7% gradually from June through
19.7%
18.7% 18.7% September, despite concerns over
17.4%
the delta variant and persistently low
workforce participation that limited
the share of adults earning paychecks.
• With the omicron variant driving up
case counts, employment may face a
setback, hurting wage incomes even
as costs are rising. Unlike earlier in the
pandemic, this lost income isn’t
expected to be replaced by
21
1
1
20
21
0
1
20
20
21
21
1
21
21
20
0
21
20
1
r- 2
-2
l-2
-2
-2
l-2
-2
n-
b-
g-
v-
p-
n-
c-
n-
v-
g-
p-
ay
ar
ct
c-
Ju
government transfers.
Ap
ct
Ju
De
No
Fe
Ja
Ju
Au
Se
O
No
De
Ju
Au
M
Se
M
O
Source: Morning Consult Economic Intelligence, monthly surveys conducted among a representative sample of 2,200 U.S. adults
U.S. Economic Outlook | New Challenges for the New Year 37FEWER BOOMERS HAVE STUDENT LOANS, BUT THEY HAVE LARGER OUTSTANDING DEBTS
• In late December, the Department of Education extended the student loan • The policy will impact adults of all ages: While younger adults are more
payment pause until May. Payments had previously been set to resume on likely to say they have educational debt, baby boomers tend to report the
Feb. 1, 2022. largest total balances, possibly due to parents who assisted with loans for
their children.
Share of adults with educational debt, by generation
Average estimated total outstanding student loan balances, by generation
Gen Zers Millennials Gen Xers Baby boomers
18% Gen Zers Millennials Gen Xers Baby boomers
16%
14%
12%
10%
8% $23,084 $32,934 $31,875 $40,413
6%
4%
2%
0%
1
1
21
21
21
21
1
1
21
1
1
l- 2
-2
-2
r-2
-2
-2
n-
n-
-
b-
g-
p
ar
ct
ay
v
Ju
Ap
Ja
Ju
No
Fe
Au
Se
O
M
M
Correction: A previous version of this slide misidentified the generations associated with each average estimated total outstanding student loan balance.
Source: Morning Consult Economic Intelligence, monthly surveys conducted among roughly 2,200 U.S. adults each. Average estimated outstanding loan balances are the average
estimated outstanding loan amount over the last 3 months, derived from monthly surveys of roughly 200 U.S. adults each over the past 3 months.
U.S. Economic Outlook | New Challenges for the New Year 38WHILE EVICTIONS DECLINED IN NOVEMBER, MISSED PAYMENTS SUGGEST THEY’LL
INCREASE AGAIN IN THE FUTURE
• The share of adults who reported receiving an eviction Share of adults that reported receiving an eviction notice
notice from their landlord decreased slightly in
November, ending a 2-month upward trend.
• However, the share of homeowners with mortgage or
rent payments who missed their monthly housing 7.7%
payments increased from 5.6% in August to 7.8% in 6.9%
6.4%
November, signaling that evictions are likely to increase 6.1%
in December. 5.5% 5.4% 5.4%
5.0% 5.1% 5.0%
• Looking further into 2022, the expiration of the federal 4.5%
eviction moratorium in August 2021 increases the
likelihood that missed housing payments will translate
into eviction notices. Like the expiration of federal
unemployment benefits, this policy change increases the
downside risk of future economic shocks caused by the
pandemic. If workers lose their jobs en masse in 2022,
the impact on the housing market will be more severe
21
1
1
21
21
21
1
1
21
1
1
l- 2
-2
-2
r-2
-2
-2
than anything experienced over the past two years.
n-
-
n-
b-
g-
p
ay
ar
ct
v
Ju
Ap
Ja
Ju
No
Fe
Au
Se
O
M
M
Source: Source: Morning Consult Economic Intelligence, monthly surveys conducted among an average monthly sample of 1,439 homeowners with mortgage and rent payments
U.S. Economic Outlook | New Challenges for the New Year 39REPORT AUTHORS
JOHN LEER
Chief Economist
@JohnCLeer
LEARN MORE
MorningConsult.com
KAYLA BRUUN FOLLOW US
@MorningConsult
Economic Analyst
@KaylaBruun
MEDIA & SPEAKING
INQUIRIES
press@morningconsult.com
JESSE WHEELER
Economic Analyst
@JesseSprWheeler
40ABOUT MORNING CONSULT
Morning Consult is a global enterprise technology company delivering
intelligent data to power leaders’ decisions. The company’s proprietary AI
technology, including both machine-learning and natural language processing
solutions, pairs with leading, high-frequency datasets and access to more than
100 million people globally in order to optimize decision-making. Morning
Consult’s proven approach gives users a leading advantage for more effective
decision-making at an unparalleled speed and scale.
41GET THE LATEST ECONOMIC ANALYSIS CLICK HERE TO SIGN UP
SECTION 7

METHODOLOGY
ECONOMIC                                                                   MC E I D A T A I N T E L L I GE N C E C A P A B I L I T I E S

                                             INTELLIGENCE                                                               Economic Intelligence collects over 15,000 daily responses on
                                                                                                                        key global macro economic indicators including:

                                             Data Intelligence                                                           § Personal
                                                                                                                           Finances
                                                                                                                                                § Employment
                                                                                                                                                  Type
                                                                                                                                                                       § Pricing Effect
                                                                                                                                                                       § Supply
                                             On Key Economic Indicators                                                  § Buying               § Labor Market           Expectations
                                                                                                                           Conditions             Sizing               § Demand
                                             Morning Consult’s SaaS platform tracks key economic                         § Business             § Future Price           Expectations
                                                                                                                           Conditions             Increases            § Ability to Pay
                                             indicators, including consumer sentiment, spending,
                                                                                                                         § Employment           § GDP
                                             labor conditions, and more.                                                   Status                 expectations

Key Use Cases

T R A C K GL OB A L                       MON I T OR L A B OR &                            T R A C K I N F L A T I ON                         U N D E R S T A N D HOU S I N G
C ON S U ME R C ON F I D E N C E          E MP L OY ME N T C ON D I T I ON S               E X P E C T A T I ON S                             MA R K E T
Track global consumer confidence to       Compare labor market conditions across           Tracking consumer inflation expectations           Tracking supply and demand of housing,
better understand and forecast consumer   and within countries to identify job             and the impact that has on consumer                including buying and renting and ability to
spending.                                 seekers with appropriate skill sets.             spending and buying habits.                        make payments.

Available in 15 countries

 USA       CHINA      JAPAN        GERMANY       UK       FRANCE        INDIA      ITALY       BRAZIL       CANADA       S KOREA         RUSSIA       AUSTRALIA          SPAIN          MEXICO
WE USE RESPONSES TO FIVE DAILY SURVEY QUESTIONS TO MEASURE
CONSUMER SENTIMENT
Index of Cons. Index of Cons. Index of Current
Sentiment Expectations Conditions
(ICS) (ICE) (ICC)
❏ Better Now + % Pos. + % Pos.
Current Conditions: Would you say that you (and your family living
❏ Same - % Neg. - % Neg.
there) are better off or worse off financially than you were a year
❏ Worse
ago? + 100 + 100
❏ Don’t Know/No Opinion
Personal
Finances ❏ Will Be Better Off
12-Month Expectations: Now looking ahead — do you think that a + % Pos. + % Pos.
❏ Same - % Neg. - % Neg.
year from now you (and your family living there) will be better off
❏ Will Be Worse Off
financially, or worse off, or just about the same as now? + 100 + 100
❏ Don’t Know/No Opinion
❏ Good Times + % Pos. + % Pos.
12-Month Expectations: Now turning to business conditions in the
❏ Neither Good/Bad - % Neg. - % Neg.
country as a whole — do you think that during the next twelve
❏ Bad Times
months we’ll have good times financially, or bad times, or what? + 100 + 100
Business ❏ Don’t Know/No Opinion
Conditions 5-Year Expectations: Looking ahead, which would you say is more
❏ Good Times + % Pos. + % Pos.
likely — that in the country as a whole we’ll have continuous good - % Neg. - % Neg.
❏ Unem./Depression
times during the next 5 years or so, or that we will have periods of
❏ Don’t Know/No Opinion + 100 + 100
widespread unemployment or depression, or what?
Current Buying Conditions: Thinking about the big things people buy ❏ Good Time + % Pos. + % Pos.
Buying for their homes — such as furniture, a refrigerator, stove, television, ❏ Neither Good/Bad - % Neg. - % Neg.
Conditions and things like that. Generally speaking, do you think now is a good ❏ Bad Time
or bad time for people to buy major household items? ❏ Don’t Know/No Opinion + 100 + 100
avg. avg. avg.
ICS ICE ICC
U.S. Economic Outlook | New Challenges for the New Year 45WE USE RESPONSES TO FIVE DAILY SURVEY QUESTIONS TO MEASURE
CONSUMER SENTIMENT
THOUSANDS OF DAILY SURVEYS
Expanded
Unemployment Rate
Unemployment Rates
Labor Force Part-Time / Full-Time
Participation Rate Ratio
Employment to Employee Stickiness
Population Ratio Sentiment
✓ Consistent Cross-Country Data ✓ High Frequency Collection ✓ Detailed Demographic
Collection and Methodology & Reporting Segmentation Capabilities
U.S. Economic Outlook | New Challenges for the New Year 46LABOR MARKET METRICS
Morning Consult’s labor force calculations are simplified and standardized versions of those used by the Bureau of
Labor Statistics, the OECD and the International Labour Organization.
E MP LOY E D Working
U N E MP LOY E D Not working, but looking for work and not disabled
IN T HE LA B OR F OR C E Employed + Unemployed
Has a job, but is open to leaving current job or is actively
WILLIN G T O S WIT C H J OB S
applying for new jobs
U.S. Economic Outlook | New Challenges for the New Year 47SURVEY COMPARISON
Morning Consult’s labor market data provides enhanced scale, frequency, and depth not captured in BLS data.
U.S. Economic Outlook | New Challenges for the New Year 48UNEMPLOYMENT RATE METHODOLOGY
Morning Consult’s unemployment rate calculation is a simplified version of the calculation used by the Bureau of Labor
Statistics.
Q3. Do you have a Q4. How would you describe
Q1. In the past week, did Q2. Did you actively look
disability that prevents
you do any work for pay for work in the past 4 your present employment
you from doing any kind
or profit? weeks? situation?
of work?
Job in the private sector
Job in government
No No No Self-employed
Homemaker
Yes Yes Yes Student
Retired
Unemployed
Other
Unemployed
( Actively
Searching & Able to Work ) Working in Private or Public Sector
(but answered Q1 “no”)
Unemployment
Rate = Labor Force
=
Worked in past
week
Working in Private or Public Sector
(but answered Q1 “no”) ( Actively
Searching & Able to Work )
U.S. Economic Outlook | New Challenges for the New Year 49© 2022 Morning Consult, All Rights Reserved.
You can also read