NHS Scotland reduces the postcode lottery for hip arthroplasty: an ecological study of the impact of waiting time initiatives
←
→
Page content transcription
If your browser does not render page correctly, please read the page content below

Research
                                                                                                                      Journal of the Royal Society of Medicine; 2014, Vol. 107(6) 237–245
                                                                                                                                                        DOI: 10.1177/0141076814523950

NHS Scotland reduces the postcode lottery for hip
arthroplasty: an ecological study of the impact of
waiting time initiatives

Graham Kirkwood1, Allyson M Pollock1, Colin Howie2 and Sarah Wild3
1
 Centre for Primary Care and Public Health, Queen Mary, University of London, London E1 2AB, UK
2
 Lothian University Hospitals NHS Trust, Royal Infirmary of Edinburgh, Edinburgh EH16 4SA, UK
3
 Centre for Population Health Sciences, University of Edinburgh, Medical School, Edinburgh EH8 9AG, UK
Corresponding author: Allyson Pollock. Email: a.pollock@qmul.ac.uk

    Abstract
                                                                                             Introduction
    Objectives: Following the election of the Labour govern-
    ment in 1997, policies were developed in England to                                      Hip arthroplasty is one of the most frequently per-
    reduce waiting times for NHS treatment with commit-                                      formed operations in the UK.1,2 It is cost-effective
    ments to reduce health inequalities. Similar policies were                               even among elderly patients and on average leads to
    adopted in Scotland but with less emphasis on the use of                                 an additional 6.5 quality-adjusted life years per
    the private sector to deliver NHS treatments than in                                     patient.3 Despite its effectiveness and the increasing
    England. This study uses routinely collected NHS
                                                                                             needs of an ageing population, there is considerable
    Scotland data to analyse geographical and socioeconomic
    inequalities in elective hip arthroplasty treatment before
                                                                                             pressure in England with commissioners limiting
    and after the introduction of the waiting time initiatives                               access to planned hip surgery.4,5
    in Scotland in 2003.                                                                         Reducing health inequalities is a priority of both
    Design: Ecological study design.                                                         UK and Scottish governments. Research has shown
    Setting: Scotland.                                                                       that patients living in areas of high socioeconomic
    Participants: NHS-funded patients receiving elective hip                                 deprivation are less likely to receive hip arthroplasty
    arthroplasty delivered by the NHS and private hospitals                                  in both England and Scotland, even after adjusting
    between 1 April 1998 and 31 March 2008.                                                  for age- and sex-related differences and despite rela-
    Main outcome measures: Directly standardised treatment                                   tively high levels of need compared with patients
    rates and incidence rate ratios calculated using Poisson                                 from less deprived areas.6–10 Patients living in areas
    regression.
                                                                                             of high socioeconomic deprivation also undergo sur-
    Results: There was a 42% increase in NHS-funded hip
    arthroplasties carried out in Scotland from 4095 in 2002–
                                                                                             gery younger, have more co-morbidities, more severe
    2003 (1 April 2002–31 March 2003) to 5829 in 2007–2008.                                  symptoms at presentation and are not as satisfied
    There is evidence of a statistically significant reduction in geo-                       with the outcome of surgery compared with patients
    graphical inequality (likelihood ratio test p < 0.001) but no                            from less deprived areas.11
    evidence of any statistically significant change in socioeco-                                Geographical inequalities also exist with patients
    nomic inequality (p ¼ 0.108), comparing the 5 years after 1                              in urban areas of England having lower rates of hip
    April 2003 with the 5 years before 1 April 2003. The number                              replacement than patients elsewhere as do patients
    of NHS-funded hip arthroplasties undertaken privately rose                               living in the North of England compared with the
    from 1.1% in 2002–2003 to 2.9% in 2007–2008, whereas the                                 South when adjusted for age differences.6–8,12 A
    NHS Golden Jubilee National Hospital increased its share                                 study of patients treated in hospitals in the West of
    from 3.3% to 10.6% over the same period.
                                                                                             Scotland found higher age and sex standardised rates
    Conclusions: The reduction in geographical inequality, or
    ‘postcode lottery’, in hip arthroplasty treatment in Scotland
                                                                                             of primary total hip replacement among rural com-
    may be due to increased NHS capacity, in particular the                                  pared with urban communities.13 The ‘postcode lot-
    development of the NHS Golden Jubilee National Hospital                                  tery’ in treatment access, where patients in need
    in Clydebank, Greater Glasgow as a dedicated centre to                                   receive differing levels of treatment depending on
    reduce surgery waiting times.                                                            where they live is known to exist for other treatments,
                                                                                             for example, varicose vein and postbariatric sur-
    Keywords                                                                                 gery.14,15 Recent research by Dr Foster Intelligence
    surgery, orthopaedics, epidemiology, inequality, socioeco-                               Ltd16 has found huge variation across clinical com-
    nomic deprivation, geography                                                             missioning groups (CCGs) in England in hip

! The Royal Society of Medicine 2014
Reprints and permissions: sagepub.co.uk/journalsPermissions.nav
                                                       Downloaded from jrs.sagepub.com by guest on November 4, 2015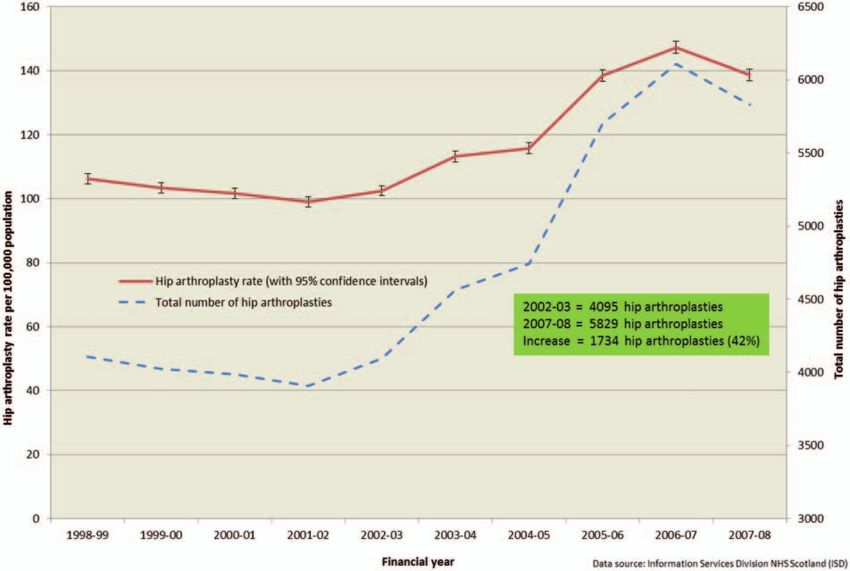
238                                                                                            Journal of the Royal Society of Medicine 107(6)

arthroplasties commissioned between financial year                           the development of an ISTC programme until
2010–2011 and 2012–2013, from a decrease of 29%                             December 2006 when it opened an experimental
in National Health Service (NHS) Hammersmith and                            ISTC, the Scottish Regional Treatment Centre
Fulham CCG to an increase of 57% in NHS Leeds                               (SRTC) in Tayside.24 The contract to run the
South and East CCG, leading to media speculation of                         SRTC in the building of Stracathro NHS hospital
a postcode lottery in these treatments.                                     was awarded to South African private healthcare
                                                                            company Netcare, which had already been awarded
                                                                            ISTC wave one contracts in England for mobile cata-
The war on waiting in England                                               ract surgery, a surgical centre in Manchester and a
Following the election of the Labour government in                          walk-in centre in Leeds worth £137.1 million (E162.7
1997, the English Department of Health (DoH) intro-                         million and $223.9 million). The SRTC closed its
duced policies to reduce waiting times for patients to                      doors in January 2010 when the Scottish government
a maximum of 18 weeks from referral to treatment.                           decided against renewing the contract following an
Phase two of the ‘war on waiting’ between 2000 and                          analysis showing poor value for money.25
2004 saw the introduction of ‘Diagnostic and                                   In this study, we use primary elective hip arthro-
Treatment Centres’, for elective patients only, with                        plasty treatment rates, a commonly used proxy to
the intention of avoiding the cancellation and resche-                      detect change in healthcare access inequalities,6,8,10
duling of appointments often encountered by patients                        to assess if there were any changes in geographical
in NHS general hospitals.17 In 2002, the DoH con-                           and socioeconomic inequalities in access to treatment
cluded that the private sector would be needed to                           after the introduction of waiting time initiatives in
deliver the additional capacity on behalf of the                            Scotland.
NHS.18 Consequently, £5.6 billion (E6.6 billion
and $9.1 billion) was set aside to establish the
Independent Sector Treatment Centre (ISTC) pro-
                                                                            Methods
gramme to pump-prime the for profit private                                  We analysed an extract of secondary care admissions
sector.19 From 1 January 2006, patients in England                          Scottish Morbidity Record (SMR01) data provided
were given a choice of at least four hospitals, or what                     by the Information Services Division (ISD) of NHS
were termed suitable alternative providers, in which                        National Services Scotland of NHS funded elective
to have their NHS-funded treatments, including                              primary hip arthroplasties (including hip resurfacing
ISTC      and     non-ISTC       private   hospitals.20                     and hybrid hip replacements) from 1 April 1998 to
Accompanying these waiting time policies was a com-                         the 31 March 2008 for patients over 15 years of age
mitment by the Labour government to reduce health                           identified using OPCS-4.4 codes as used by the
inequalities.21                                                             Scottish Arthroplasty Project.26
                                                                               We calculated age and sex directly standardised
                                                                            hip arthroplasty rates by year of treatment for all of
Scotland
                                                                            Scotland and by period of treatment defined as the 5
The responsibility for health is devolved from the UK                       years before (1 April 1998 to 31 March 2003) and
government to the Scottish government and the                               after (1 April 2003 to 31 March 2008) the introduc-
response to the drive to reduce waiting times in                            tion of the waiting time initiatives by health board of
Scotland was different. In February 2003, the                                residence and Scottish Index of Multiple Deprivation
‘Partnership for Care’ NHS Scotland White Paper                             (SIMD) quintile further adjusted by SIMD and
set out a clear strategy to ensure prompt access to                         health board, respectively.
services within a patient’s local NHS backed up by                             We tested for an interaction between period of
the right to be treated ‘elsewhere in the NHS, in the                       treatment and health board and separately, period
private sector, or in exceptional circumstances else-                       of treatment and SIMD. We calculated age, sex and
where in Europe’.22 As in England, these waiting                            SIMD adjusted incidence rate ratios by health board
time guarantees, reiterated in the Patient Rights                           and age, sex and health board adjusted incidence rate
(Scotland) Act 2011, were accompanied with a com-                           ratios by SIMD using Greater Glasgow and Clyde
mitment to reduce health inequalities.23 A key elem-                        (the largest and most socioeconomically deprived of
ent of this strategy was the purchase of the Golden                         Scotland’s 14 geographical health boards) and SIMD
Jubilee National Hospital in Clydebank, Greater                             quintile five (the most socioeconomically deprived
Glasgow as a specialist centre for elective NHS sur-                        fifth of Scotland) as reference categories, respectively,
gery from private healthcare company Health Care                            by period of treatment.
International after its failure to develop it as a health                      Finally, using a separate updated data-set from
tourism venture. Scotland did not follow England in                         ISD which contained data on provider type

                                           Downloaded from jrs.sagepub.com by guest on November 4, 2015
Kirkwood et al. 239
(NHS or private), we analysed the change in distri- rate ratios were estimated using Poisson regression in
bution of NHS-funded patients treated in public and the statistical package Stata version 12.1.
private hospitals by calculating the proportion of
NHS-funded elective hip arthroplasties carried out
Results
in the private sector in the year prior to the
waiting time initiatives, financial year 2002–2003 There were 47,069 NHS-funded elective primary hip
(1 April 2002 to 31 March 2003) and 5 years later arthroplasties carried out in Scotland for the 10-year
in 2007–2008. period 1 April 1998 to 31 March 2008 identified from
Our denominators were age- and sex-specific popu- data returned to ISD. The age and sex adjusted treat-
lations over 15 years of age from mid-year Scottish ment rate fell from 106.3 (95% confidence interval
population estimates from the General Register 103.0, 109.5) per 100,000 Scottish population in
Office for Scotland. Scottish population data by 1998–1999 to 99.0 (95.9, 102.1) per 100,000 in 2001–
SIMD and health board were provided by ISD. 2002, rose to 147.3 (143.6, 151.0) per 100,000 in 2006–
Socioeconomic deprivation was measured using the 2007 before falling to 138.7 (135.1, 142.2) per 100,000
SIMD scores for 2006 supplied by ISD where quintile in 2007–2008 (see Figure 1). There was a 42% increase
one represents the least deprived fifth and quintile five in NHS hip arthroplasties carried out in Scotland
the most deprived fifth of the Scottish population. To from 4095 in 2002–2003 to 5829 in 2007–2008.
ease analysis and interpretation we combined the The health board with the lowest age, sex and
island health boards, Orkney, Shetland and Western SIMD adjusted elective hip arthroplasty rate was
Isles; for simplicity this is referred to throughout as Lanarkshire, 78.1 (74.0, 82.2) treatments per 100,000
one health board although actually comprising three residents for the 5 years before 1 April 2003 and
health boards. All rates were directly standardised to Ayrshire and Arran, 102.8 (97.9, 107.7) per 100,000
the 1997 Scottish mid-year population. All incidence for the 5 years after 1 April 2003 (see Table 1).
Figure 1. Elective primary hip arthroplasties in NHS-funded patients in Scotland (aged over 15 years). Total arthroplasties and
arthroplasty rates directly standardised by age and sex, 1 April 1998 to 31 March 2008.
Downloaded from jrs.sagepub.com by guest on November 4, 2015240
Table 1. Scotland health board populations (over 15 years), elective primary hip arthroplasty rates and incidence rate ratios (relative to Greater Glasgow and Clyde), before (1 April
1998–31 March 2003) and after (1 April 2003–31 March 2008) the introduction of waiting time initiatives.
Before (1 April 1998–31 March 2003) After (1 April 2003–31 March 2008)
Annual hip Annual hip Incidence rate
arthroplasty Incidence rate Average arthroplasty rate ratio
Average annual rate per 100,000 ratio (with 95% annual per 100,000 (with 95%
population (with 95% confidence population (with 95% confidence confidence
Health board of residence (over 15 years) confidence intervals)a intervals)b (over 15 years) intervals)a intervals)b
Greater Glasgow and Clyde 966,590 78.7 (75.9, 81.5) 1 976,941 107.4 (104.1, 110.6) 1
Ayrshire and Arran 296,968 87.8 (83.1, 92.5) 1.15 (1.08, 1.22) 299,765 102.8 (97.9, 107.7) 0.97 (0.92, 1.03)
Borders 86,345 117.2 (103.3, 131.1) 1.56 (1.43, 1.70) 89,580 149.8 (132.7, 166.9) 1.38 (1.28, 1.49)
Dumfries and Galloway 119,768 92.4 (83.8, 101.0) 1.25 (1.15, 1.36) 121,910 106.6 (97.3, 115.8) 1.06 (0.98, 1.14)
Fife 279,644 113.1 (107.6, 118.5) 1.48 (1.40, 1.57) 290,527 134.4 (128.5, 140.2) 1.28 (1.21, 1.35)
Forth Valley 223,706 80.5 (75.2, 85.9) 1.06 (0.99, 1.14) 230,072 105.6 (99.6, 111.6) 1.00 (0.94, 1.07)
Grampian 425,570 120.5 (114.8, 126.2) 1.55 (1.47, 1.63) 432,049 143.7 (137.6, 149.8) 1.37 (1.31, 1.43)
Highland 241,651 124.4 (117.1, 131.6) 1.61 (1.51, 1.70) 249,037 157.6 (149.6, 165.6) 1.44 (1.37, 1.52)
Downloaded from jrs.sagepub.com by guest on November 4, 2015
Lanarkshire 441,174 78.1 (74.0, 82.2) 1.00 (0.94, 1.06) 448,533 110.4 (105.9, 115.0) 1.04 (0.99, 1.09)
Lothian 630,861 96.1 (92.3, 99.9) 1.23 (1.17, 1.29) 654,926 121.5 (117.3, 125.7) 1.13 (1.08, 1.18)
Orkney, Shetland and Western Isles 54,509 141.0 (120.4, 161.6) 2.01 (1.82, 2.22) 54,935 167.1 (147.3, 186.9) 1.93 (1.77, 2.09)
Tayside 317,741 106.7 (101.7, 111.6) 1.42 (1.35, 1.51) 320,769 136.8 (131.3, 142.4) 1.32 (1.26, 1.39)
Source: General Register Office for Scotland mid-year Scottish population estimates. SMR01 data (over 15 years) from Information Services Division NHS Scotland.
SIMD: Scottish Index of Multiple Deprivation.
a
Directly standardised by age, sex and SIMD to Scotland 1997 mid-year population.
b
Adjusted by age, sex and SIMD.
Journal of the Royal Society of Medicine 107(6)Kirkwood et al. 241
Orkney, Shetland and Western Isles had the highest seven health boards had significantly higher treat-
treatment rate both for the 5 years before 1 April ment rates than Greater Glasgow and Clyde,
2003, 141.0 (120.4, 161.6) per 100,000 and in the 5 with Ayrshire and Arran, Dumfries and Galloway,
years after 1 April 2003, 167.1 (147.3, 186.9) per Forth Valley and Lanarkshire not significantly
100,000. different.
Hip arthroplasty rates were statistically signifi- In four health boards, Ayrshire and Arran,
cantly lower among the most socioeconomically Dumfries and Galloway, Fife and Grampian the inci-
deprived quintile of the Scottish population (SIMD dence rate ratio relative to Greater Glasgow and
quintile five) than among the other quintiles both in Clyde decreased significantly for the 5 years after 1
the 5 years before and after the 1 April 2003, 82.8 April 2003 compared with the 5 years before 1 April
(79.2, 86.3) per 100,000 and 107.9 (103.8, 112.0) per 2003 (Table 1, Figure 2).
100,000, respectively. We found weak evidence of an interaction between
There was a significant interaction between SIMD and period of treatment (likelihood ratio test
health board and period of treatment (likelihood p ¼ 0.108) but no evidence that the incidence rate
ratio test p < 0.001) indicating that treatment rates ratios for SIMDs one to four relative to SIMD five
in other health boards were significantly higher than in the 5 years after 1 April 2003 were significantly
Greater Glasgow and Clyde in the 5 years before different to those calculated for the 5 years before 1
the 1 April 2003 compared with the 5 years after April 2003 (Table 2, Figure 3).
the 1 April 2003. In the 5 years before 1 April 2003 According to the separate updated data-set from
there were nine health boards (Table 1, Figure 2) ISD, the proportion of NHS-funded elective primary
with significantly higher treatment rates than hip arthroplasties conducted in the private sector
Greater Glasgow and Clyde, only Forth Valley increased from 1.1% in 2002–2003 to 2.9% in
and Lanarkshire were not significantly different, 2007–2008. The NHS Golden Jubilee National
whereas in the 5 years after 1 April 2003 only Hospital in Clydebank (NHS National Waiting
Figure 2. Elective primary hip arthroplasties in NHS-funded patients in Scotland (aged over 15 years). Incidence rate ratios
adjusted by age, sex and Scottish index of multiple deprivation with 95% confidence intervals compared with greater Glasgow and
Clyde health board.
Downloaded from jrs.sagepub.com by guest on November 4, 2015242
Table 2. Scotland socioeconomic deprivation (SIMD) quintile populations (over 15 years), elective hip arthroplasty rates and incidence rate ratios (relative to SIMD five), before
(1 April 1998–31 March 2003) and after (1 April 2003–31 March 2008) the introduction of waiting time initiatives.
Before (1 April 1998–31 March 2003) After (1 April 2003–31 March 2008)
Annual hip Annual hip
arthroplasty rate Incidence arthroplasty Incidence rate
Average annual per 100,000 (with rate ratio (with Average annual rate per 100,000 ratio (with
population 95% confidence 95% confidence population (with 95% 95% confidence
SIMD quintile (over 15 years) intervals)a intervals)b (over 15 years) confidence intervals)a intervals)b
1 (least deprived) 802,103 95.3 (91.5, 99.0) 1.11 (1.06, 1.17) 831,087 120.8 (116.9, 124.7) 1.09 (1.04, 1.13)
2 796,013 105.0 (101.6, 108.3) 1.24 (1.18, 1.30) 839,645 131.4 (127.8, 135.0) 1.20 (1.15, 1.25)
3 819,382 104.6 (101.4, 107.8) 1.24 (1.18, 1.30) 842,224 133.2 (129.6, 136.8) 1.21 (1.16, 1.26)
4 836,077 95.2 (92.2, 98.2) 1.13 (1.07, 1.18) 841,105 121.2 (117.8, 124.6) 1.10 (1.06, 1.15)
5 (most deprived) 830,950 82.8 (79.2, 86.3) 1 814,984 107.9 (103.8, 112.0) 1
Source: General Register Office for Scotland mid-year Scottish population estimates. SMR01 data (over 15 years) from Information Services Division NHS Scotland.
SIMD: Scottish Index of Multiple Deprivation.
Downloaded from jrs.sagepub.com by guest on November 4, 2015
a
Directly standardised by age, sex and health board of residence to Scotland 1997 mid-year population.
b
Adjusted by age, sex and health board of residence.
Journal of the Royal Society of Medicine 107(6)Kirkwood et al. 243
Figure 3. Elective primary hip arthroplasties in NHS-funded patients in Scotland (aged over 15 years). Incidence rate ratios
adjusted by age, sex and health board of residence with 95% confidence intervals compared with the 20% most socioeconomically
deprived population (SIMD 5).
Times Centre Board) increased its share from 3.3% to problematic in England due to frequent changes in
10.6% over the same period. NHS organisation and boundaries. Moreover, in
England, there has been a deterioration in data quality
and completeness because the private sector does not
Discussion
return complete, timely and accurate data. In contrast,
We have found evidence of a statistically significant health board boundaries in Scotland are more stable
reduction in geographical inequality in elective pri- which facilitates geographical comparisons over time.
mary hip arthroplasty treatment rates between health The reduction in geographical inequality we found
boards in Scotland in the 5 years after the introduction in Scotland has taken place without any major expan-
of waiting time initiatives in 2003 compared with 5 sion in the use of the private sector to deliver NHS
years before. We did not find any significant reduction treatments and may be as a result of increased NHS
in inequality by socioeconomic deprivation. activity, in particular the major investment at the
Research into access to NHS treatment in England NHS Golden Jubilee National Hospital in
between 2001 and 2008 has also found no reduction in Clydebank. The model chosen in Scotland to increase
socioeconomic inequality in hip arthroplasty treatment capacity within the NHS was very different from that
during this period of waiting time initiatives and NHS followed in England where a major ISTC programme
reforms.10 Earlier research in one health board in and extension of patient choice took place such that
Scotland has suggested that waiting time initiatives by 2010–2011, around 20% of all NHS-funded hip
introduced there have not discriminated against arthroplasties were being carried out in private hos-
patients from lower socioeconomic groups.27 There pitals.28 In Scotland, in 2010–2011 only 0.8% of
has been no research into possible changes in geo- NHS-funded hip arthroplasties were performed pri-
graphical inequalities in either England or Scotland vately down from a peak of 8.3% in 2008–2009 when
following the waiting time initiatives, although this is the SRTC was most active. There is a need for an
Downloaded from jrs.sagepub.com by guest on November 4, 2015244 Journal of the Royal Society of Medicine 107(6)
analysis in England to assess any change in geograph- 3. Jenkins PJ, Clement ND, Hamilton DF, et al.
ical inequality which would make a useful compari- Predicting the cost-effectiveness of total hip and knee
son with the experience in Scotland although this is replacement: a health economic analysis. Bone Joint J
difficult for the reasons outlined above. 2013; 95-B: 115–121.
4. Campbell D. NHS Rationing is Putting Health at Risk,
There are few studies of employment and risk of
Says Doctors’ Leader. The Guardian. 31 August 2012.
hip osteoarthritis, the main reason for a hip arthro- See www.theguardian.com/society/2012/aug/31/nhs-
plasty, but farming and agricultural labourers have rationing-risking-lives-doctors-leader (last checked 20
an increased risk which may explain some of the Dec 2013).
rural/urban differences pattern.29,30 We were unable 5. Birrell F, Johnell O and Silman A. Projecting the need
in this study to adjust for need for treatment or to for hip replacement over the next three decades: influ-
adjust for any measure of co-morbidity. Factors con- ence of changing demography and threshold for sur-
tributing to the observed differences in treatment gery. Ann Rheum Dis 1999; 58: 569–572.
rates between health boards in Scotland might 6. Judge A, Welton NJ, Sandhu J, et al. Equity in access
include competing priorities on limited budgets but to total joint replacement of the hip and knee in
might also include differing levels of need within geo- England: cross sectional study. BMJ 2010; 341: c4092.
7. Goldacre M, Yeates D, Gill L, et al. Elective Hip
graphical populations. The reduction we found in
Arthroplasty in England 2009–2011. A Geographical
geographical inequality suggests that previously
Profile of Hospital Admissions. Unit of Health-Care
unmet need is being met as a result of increased capa- Epidemiology: University of Oxford, 2013. http://
city but more research is needed to understand why www.uhce.ox.ac.uk/Atlases/Linked/2009-2011/
there has been no impact on socioeconomic Operations/Elective%20hip%20arthroplasty_Final.pdf
inequality. (last checked 20 December 2013).
8. Judge A, Welton NJ, Sandhu J, et al. Geographical
Declarations variation in the provision of elective primary hip and
Competing interests: None declared knee replacement: the role of socio-demographic, hos-
pital and distance variables. J Public Health (Oxf)
Funding: This work was supported by the Chief Scientist Office, 2009; 31: 413–422.
Scotland [CZG/2/367]. 9. Scottish Arthroplasty Project. Annual Report 2006. See
Guarantor: GK http://www.arthro.scot.nhs.uk/Reports/Arthro_
Report_2006.pdf (last checked 20 December 2013).
Ethical approval: The data extract was authorised by the ISD 10. Cookson R, Laudicella M and Donni PL. Measuring
Privacy Advisory Committee.
change in health care equity using small-area adminis-
Contributorship: AP conceived the study and obtained funding. trative data – evidence from the English NHS 2001-
AP and GK designed the study and had full access to all of the 2008. Soc Sci Med 2012; 75: 1514–1522.
data in the study. GK analysed the data and takes responsibility 11. Clement ND, Muzammil A, Macdonald D, et al.
for the accuracy of the data analysis. AP, GK, CH and SW moni- Socioeconomic status affects the early outcome
tored the study through to completion. GK and AP drafted the of total hip replacement. Bone Joint J 2011; 93:
manuscript. GK, AP, CH and SW critically revised the manuscript 464–469.
and approved the final version for publication.
12. Steel N, Melzer D, Gardener E, et al. Need for and
Acknowledgements: We thank the analysts at the Scottish receipt of hip and knee replacement–a national popu-
Arthroplasty Project and Information Services Division (NHS) lation survey. Rheumatology (Oxford) 2006; 45:
Scotland for providing the data extracts, information and figures. 1437–1441.
We also thank the members of the Scottish Arthroplasty Steering 13. Dunsmuir RA, Allan DB and Davidson LA. Increased
Committee for their advice on the project and Dr Stephen incidence of primary total hip replacement in rural
Bremner, Queen Mary University of London for advice on the communities. BMJ 1996; 313: 1370.
statistical analysis.
14. Nasr MK, Budd JS and Horrocks M. Uncomplicated
Provenance: Not commissioned; peer-reviewed by Andrew Judge varicose vein surgery in the UK – a postcode lottery?
Ann R Coll Surg Engl 2008; 90: 474–476.
15. Highton L, Ekwobi C and Rose V. Post-bariatric sur-
References gery body contouring in the NHS: a survey of UK
1. Information Services Division NHS Scotland. Inpatient bariatric surgeons. J Plast Reconstruct Aesthet Surg
and Day Case Surgical Procedures and Operations – All 2012; 65: 426–432.
Ages. See www.isdscotland.org/Health-Topics/Hospital- 16. Dr Foster Intelligence Ltd. HG2013 Commissioning
Care/Operations-and-Procedures/ (last checked 20 Metrics from DATA: Download ZIP 2013. See http://
December 2013). myhospitalguide.drfosterintelligence.co.uk/#/the-report
2. Hospital Episode Statistics. Admitted Patient Care – (last checked 20 December 2013).
England, 2011–12. See www.hscic.gov.uk/article/1823/ 17. Lewis R and Appleby J. Can the English NHS meet the
What-HES-data-is-available (last checked 20 December 18-week waiting list target? J R Soc Med 2006; 99:
2013). 10–13.
Downloaded from jrs.sagepub.com by guest on November 4, 2015Kirkwood et al. 245
18. Naylor C and Gregory S. Independent Sector Treatment 24. Macdonald R and Evans J. The Scottish Regional
Centres. Briefing. 2009. See www.kingsfund.org.uk/ Treatment Centre (SRTC) Pilot Project at Stracathro
sites/files/kf/field/field_publication_file/briefing- Hospital by Brechin, Angus. 2008. See www.keepournh-
independent-sector-treatment-centres-istc-chris- spublic.com/pdf/SRTCfinallong.pdf (last checked 20
naylor-sarah-gregory-kings-fund-october-2009.pdf December 2013).
(last checked 20 December 2013). 25. Pollock AM and Kirkwood G. Independent sector
19. House of Commons Health Committee. Independent treatment centres: learning from a Scottish case
Sector Treatment Centres. Fourth report of session study. BMJ 2009; 338: b1421.
2005–06. Volume 1. See www.publications.parliament. 26. Information Services Division NHS Scotland.
uk/pa/cm200506/cmselect/cmhealth/934/934i.pdf (last Summary of OPCS Codes Used by Scottish
checked 20 December 2013). Arthroplasty Project. See www.arthro.scot.nhs.uk/
20. NHS England. Extended and Free Choice Network. OPCS_codes_summary_150710.pdf (last checked 20
See www.nhsidentity.nhs.uk/all-guidelines/guidelines/ December 2013).
extended-and-free-choice-network/introduction (last 27. Wood GC and Howie C. Do waiting list initiatives
checked 20 December 2013). discriminate in favour of those in a higher socioeco-
21. Speech by Hazel Blears MP. 18 February 2003 at the nomic group? Scott Med J 2011; 56: 76–79.
North East Health Summit. See http://webarchive. 28. National Joint Registry for England and Wales. 8th and
nationalarchives.gov.uk/þ/www.dh.gov.uk/en/ 9th Annual Reports. 2011 and 2012. See http://
MediaCentre/Speeches/Speecheslist/DH_4064768 (last www.njrcentre.org.uk/njrcentre (last checked 20
checked 20 December 2013). December 2013).
22. NHS Scotland. Partnership for Care. Scotland’s Health 29. Cooper C, Campbell L, Byng P, et al. Occupational
White Paper 2003. See www.sehd.scot.nhs.uk/publica- activity and the risk of hip osteoarthritis. Ann Rheum
tions/PartnershipforCareHWP.pdf (last checked 20 Dis 1996; 55: 680–682.
December 2013). 30. Croft P, Cooper C, Wickham C, et al. Osteoarthritis of
23. The Scottish Government. Patient Rights (Scotland) the hip and occupational activity. Scand J Work
Act 2011. www.legislation.gov.uk/asp/2011/5/contents Environ Health 1992; 18: 59–63.
(last checked 20 December 2013).
Downloaded from jrs.sagepub.com by guest on November 4, 2015You can also read