NTG Morning Comments www.nesvick.com - Wednesday, January 13, 2021
←
→
Page content transcription
If your browser does not render page correctly, please read the page content below
Wednesday, January 13, 2021
NTG Morning Comments
www.nesvick.com
Weather
Rainfall in northern Brazil over the next two weeks
should average near normal. Rainfall in Week One
will be biggest while rainfall totals in Week Two will
probably be below normal. Temps near normal this
week but as conditions dry out we should see a return
of above normal temps. Southern Brazil will see near
to above normal rainfall over the next two weeks.
Limited rainfall over the next few days but rainfall will
increase starting this weekend and this should kick off
a stretch of active precipitation in the area.
Precipitation will diminish a bit towards the end of the
6-10 day period, but it won’t turn completely dry
either. No major heat is expected.
Rainfall in Argentina over the next two weeks will
average near to below normal. Dry weather today
and tomorrow with rains returning on Saturday. The
best amounts and coverage will favor northern
portions of the region. We should see dry weather
return next week and stick around for about a week
before the next chance for rainfall returns in the 11-
15 day period. We will probably see some heat pop
up at times during the dry stretch, but for now
nothing extreme is in the cards.
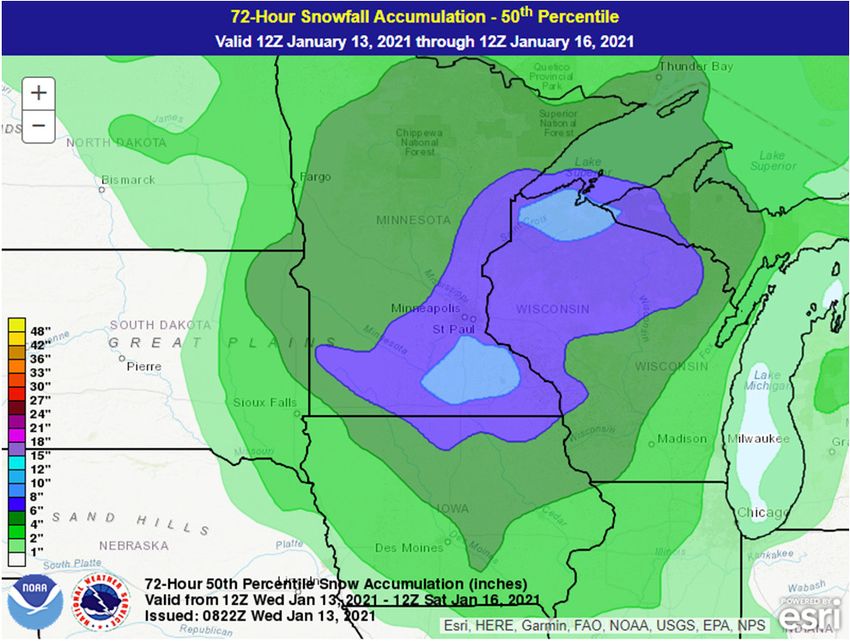
Some snow coming for portions of the Northern Plains
over the next few days. While snowfall totals aren’t
huge in all areas, it is expected to be windy and thus
there will likely be blizzard conditions in a lot of areas.
No significant precipitation in the Southern Plains for
the next week.
Crops
After yesterday’s report, the one big debate that everyone is having right now is - what is fair value for corn
now? The obvious answer is – who knows? But it is my job to try and pretend like I have answers, so here
goes…
I’ll present two very simple scatter charts this morning. This first one simply looks at the value of CH futures at
the end of January compared to the January stocks/use estimate from WASDE. The 2021 highlight takes the
price of CH at the time of writing and yesterday’s WASDE stocks/use. I think one could make the argument that
the level of CH is getting a little stretched here, though certainly isn’t extreme.
1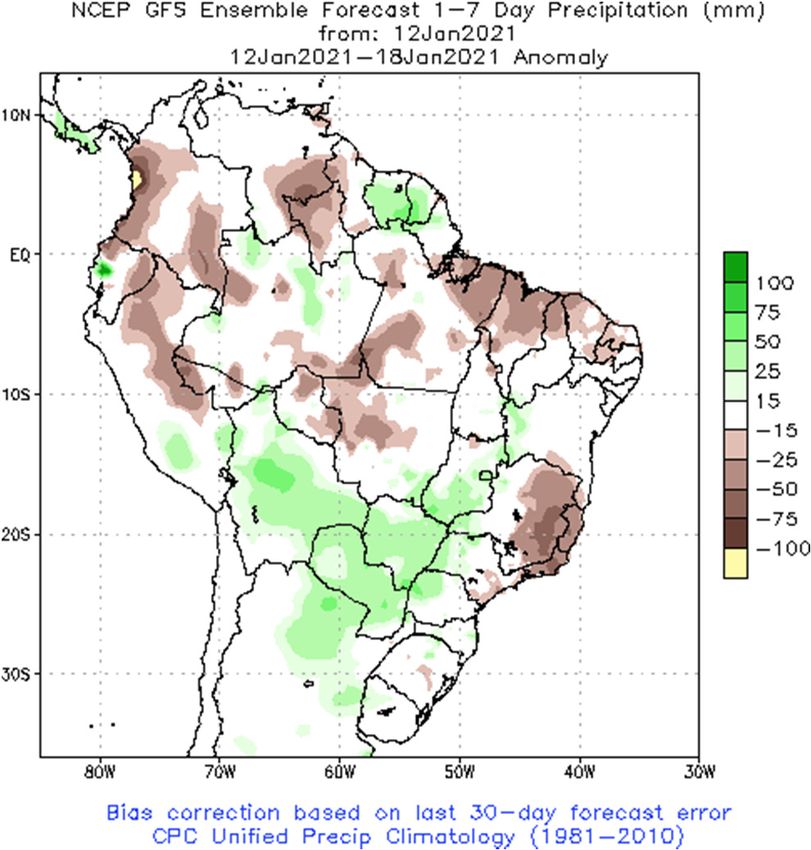
Wednesday, January 13, 2021
                                                                                                NTG Morning Comments
                                                                                                     www.nesvick.com

                                          End-Jan March Corn Close vs. January WASDE Stocks/Use
                            800
                                         2013
                            750

                            700           2011
                                                     2012
                            650

                            600
         CH Price

                                                                           2021
                            550
                                                                             2008
                            500
                                                                                     2014
                            450                  2007
                                                                                2019         2020
                                                                                               2015 2009 2017 2018
                                                                                            2016
                            400                                                              2010
                            350
                                                                                                           R² = 0.681
                            300
                                  4%            6%            8%      10%           12%         14%            16%            18%
                                                                    Jan WASDE Stocks/Use

This second chart turns our attention to calendar spreads. CN-CZ has blown out to 70+ cents. This chart
compares the January WASDE stocks/use ratio vs the percentage of full-storage of the N/Z spread. We have to
use a percentage of full-storage due to the CME’s adjustment to the storage rate a few years ago. You can see
N/Z is currently sharply inverted, and one could make the argument that the spread is a bit over-valued at the
current inverse.
                                  End-Jan Jul-Dec Spread % of Full Storage vs. January WASDE Stocks/Use (ex-2013)
                            150%
                                                                                   2009
                            100%
                                                                                            2001
                                                                                            2005
                                                                                         2018                    2006
                                                                               2015
                                                                             2016 2002
                                                                              2010    2017
                                                                           2014
                             50%                                    2003 2019 2020
                              0%                                    20042008
        % of Full Storage

                            -50%
                                                             2007
                            -100%
                            -150%                                      2021
                            -200%
                            -250%
                                                           2012
                            -300%                       2011
                            -350%
                            -400%                                                                               R² = 0.7341
                                    0%                  5%           10%              15%                20%                  25%
                                                                       WASDE Stocks/Use

                                                                            2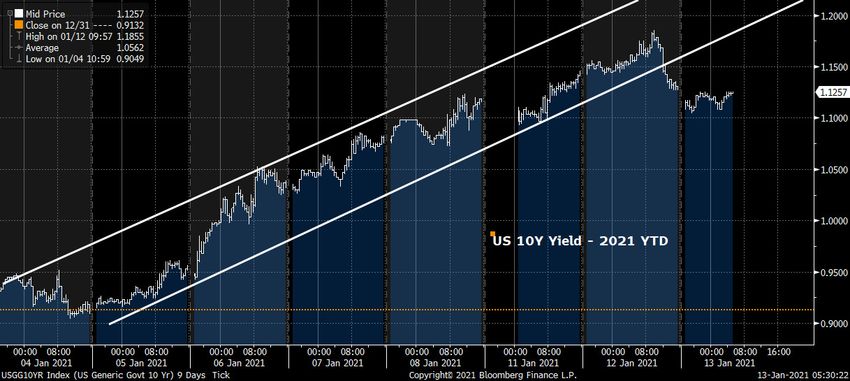
Wednesday, January 13, 2021
                                                                                                          NTG Morning Comments
                                                                                                               www.nesvick.com

Bottom line – despite the excitement of yesterday’s reports and the limit up move, I think one can argue that
current corn prices are about as high as we need to move at present. Taking it a step further, I think we can also
argue that the calendar spreads are a bit rich. I don’t know if I’d be in any rush to take a short positon in spot
corn here at the moment, but I’m also not sure I’d be especially eager to chase this rally further.

Livestock
Basis charts presented with little commentary this morning. Not much to say, they pretty much speak for
themselves. Exceptionally weak basis is obviously not supportive to the board here. The sharp rally in corn isn’t
helping cattle bulls’ cause either.
                                                   April Live Cattle Basis History
         $30.00
         $25.00
         $20.00
         $15.00
         $10.00
          $5.00
          $0.00
         -$5.00
        -$10.00
        -$15.00
        -$20.00
                   59         54      49       44          39         34         29          24     19       14          9          4
                                                                     Weeks To Expiration

                       2014          2015           2016          2017                2018          2019          2020              2021

                                                   June Live Cattle Basis History
       $30.00
       $25.00
       $20.00
       $15.00
       $10.00
        $5.00
        $0.00
       ($5.00)
      ($10.00)
      ($15.00)
                  52          47        42          37          32             27        22          17       12              7            2
                                                                     Weeks Til Expiration

                              2015          2016           2017                2018          2019          2020              2021

                                                                           3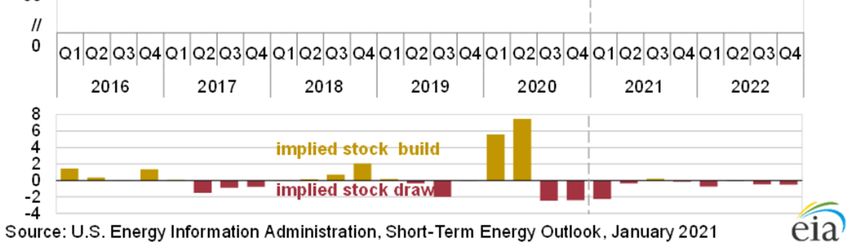
Wednesday, January 13, 2021
                                                                              NTG Morning Comments
                                                                                   www.nesvick.com

Financials
Not sure if it means anything, but I found it interesting to see a reversal in Treasuries yesterday with the 10Y
yield breaking the seemingly relentless uptrend in place since the start of the year. Note the chart below.
Admittedly, this might mean nothing. Yields are relatively steady at the time of writing this morning, and
breaking a line drawn on a chart doesn’t necessarily mean anything. Still, the smackdown in Bitcoin and now
some modest signs of life from Treasuries are possibly indicating to me that the rally in “risk” we’ve seen since
late last year might be starting to get stretched. Equity futures are only modestly lower so far this morning and
we’re still very close to the ATHs, so maybe I’m making something out of nothing. Thoughts appreciated.
FWIW, I think these recent articles suggesting the Fed is considering how to taper bond purchases are absolute
BS. They have no stomach for what it will take to taper – namely, a massive drawdown in equities.

On tap today we will get the CPI release. Inflation numbers will be in focus for the next several months, and
given the rally in commodity prices and the strong ISM readings, it is likely that CPI numbers will be strong. That
will once again bring up the idea of the Fed backing off from this support, but I expect the Fed to note the strong
CPI readings are “transitory” and I expect them to note the weak YOY base effects of the readings.

Also on tap today – another impeachment vote for President Trump. Trump is almost certain to become the
first US president to be impeached twice. Remember from our first discussion on this that the Senate will
actually hold the vote on whether to remove him, and with the old Republican-led Senate still in place that
seems highly unlikely.

Energy
The EIA released their monthly Short Term Energy Outlook yesterday afternoon. Here are a few highlights:

                                                        4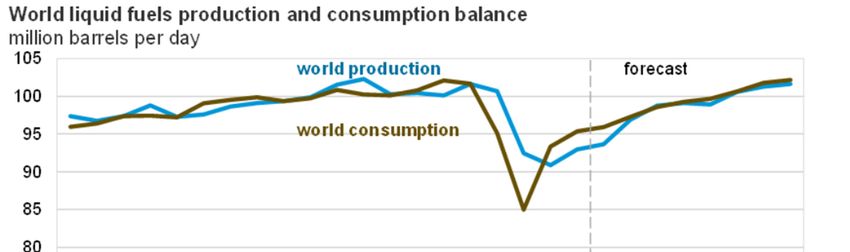
Wednesday, January 13, 2021
                                                                               NTG Morning Comments
                                                                                    www.nesvick.com

   •   EIA forecast crude oil production from OPEC will average 27.2 million b/d in 2021, up from an estimated
       25.6 million b/d in 2020. Forecast growth in output reflects OPEC’s announced increases to production
       targets and continuing rise in Libya’s production.
   •   EIA estimates global liquid fuels inventories rose at a rate of 6.5 million b/d in the first half of 2020
       before declining at a rate of 2.4 million b/d in the second half of 2020. EIA forecasts global inventories
       will continue to fall in the forecast, declining at a rate of 0.6 million b/d in 2021 and 0.5 million b/d in
       2022.
   •   EIA estimates that US crude oil production fell from the 2019 record level of 12.2 million b/d to 11.3
       million b/d in 2020. EIA expects that annual average production will fall to 11.1 million b/d in 2021
       before rising to 11.5 million b/d in 2022.
   •   US liquid fuels consumption in 2020 averaged 18.1 million b/d, down 2.5 million b/d (12%) from 2019
       consumption. EIA forecast US liquid fuels consumption will rise to 19.5 million b/d in 2021 and then to
       20.5 million b/d in 2022 (almost equal to the 2019 level).

Today’s Calendar (all times Central)
   • CPI – 7:30am
   • EIA Petroleum Inventories – 9:30am
   • Treasury Monthly Budget Statement – 1:00pm

Thanks for reading.
David Zelinski
dzelinski@nesvick.com
901-766-4684
Trillian IM: dzelinski@nesvick.com

                                                        5
Wednesday, January 13, 2021
                                                                               NTG Morning Comments
                                                                                    www.nesvick.com

DISCLAIMER:
This communication is a solicitation for entering into derivatives transactions. It is for clients, affiliates, and
associates of Nesvick Trading Group, LLC only. The information contained herein has been taken from trade and
statistical services and other sources we believe are reliable. Opinions expressed reflect judgments at this date
and are subject to change without notice. These materials represent the opinions and viewpoints of the
author and do not necessarily reflect the opinions or trading strategies of Nesvick Trading Group LLC and its
subsidiaries. Nesvick Trading Group, LLC does not guarantee that such information is accurate or complete and it
should not be relied upon as such.

Officers, employees, and affiliates of Nesvick Trading Group, LLC may or may not, from time to time, have long
or short positions in, and buy or sell, the securities and derivatives (for their own account or others), if any,
referred to in this commentary.

There is risk of loss in trading futures and options and it is not suitable for all investors. PAST RESULTS ARE NOT
NECESSARILY INDICATIVE OF FUTURE RETURNS. Nesvick Trading Group LLC is not responsible for any
redistribution of this material by third parties or any trading decision taken by persons not intended to view this
material.

                                                         6
You can also read