Observing Presenters' Use of Visual Aids to Inform the Design of Classroom Presentation Software
←
→
Page content transcription
If your browser does not render page correctly, please read the page content below
CHI 2008 Proceedings · Tools for Education                                                                  April 5-10, 2008 · Florence, Italy

         Observing Presenters’ Use of Visual Aids
 to Inform the Design of Classroom Presentation Software
                                        Joel Lanir, Kellogg S. Booth, Leah Findlater
                                                Department of Computer Science
                                       University of British Columbia, Vancouver, Canada
                                                 {yoel, ksbooth, lkf}@cs.ubc.ca
ABSTRACT
Large classrooms have traditionally provided multiple
blackboards on which an entire lecture could be visible. In
recent decades, classrooms were augmented with a data
projector and screen, allowing computer-generated slides to
replace hand-written blackboard presentations and overhead
transparencies as the medium of choice. Many lecture halls
and conference rooms will soon be equipped with multiple
projectors that provide large, high-resolution displays of                               Figure 1: Presentation hall and conference room with
comparable size to an old fashioned array of blackboards.                                                  multiple screens
The predominant presentation software, however, is still
designed for a single medium-resolution projector. With the                          Apple’s Keynote are used. While these tools enable the
ultimate goal of designing rich presentation tools that take                         presenter to easily build sophisticated presentations that use
full advantage of increased screen resolution and real estate,                       animation and other multimedia capabilities, many critics
we conducted an observational study to examine current                               claim that they are speaker-oriented and not content- or
practice with both traditional whiteboards and blackboards,                          audience-oriented [27]. With electronic slides, presenters
and computer-generated slides. We identify several                                   are forced to use a rapid, thin, sequential information style
categories of observed usage, and highlight differences                              that is primarily targeted for business presentations and is
between traditional media and computer slides. We then                               not well suited to contexts where non-linear explanations
present design guidelines for presentation software that                             and complex reasoning are needed [12,21,27]. These
capture the advantages of the old and the new and describe                           presentation tools may not adequately support classroom
a working prototype based on those guidelines that more                              lectures: lecturers often resort, sometimes exclusively, to
fully utilizes the capabilities of multiple displays.                                traditional blackboards or newer whiteboards.
                                                                                     Current presentation software is tied to a paradigm of a
Author Keywords
                                                                                     single, static slide projected onto one display screen,
High resolution displays, Multi-screen displays, visual aids.
                                                                                     changing sequentially over time. Yet, with increasing large
                                                                                     display resolution and computer power to support multiple
ACM Classification Keywords
                                                                                     displays, and decreasing projector prices, presentation
H5.m. Information interfaces and presentation (e.g., HCI):
                                                                                     software need not be constrained to this paradigm. Many
Miscellaneous.
                                                                                     lecture halls are equipped with two or more projectors
                                                                                     (Figure 1), and future lecture halls will likely have high-
INTRODUCTION
It is almost inconceivable today for a salesperson or a                              resolution, wall-size displays. Current presentation software
presenter at a conference to appear without a computer-                              provides minimal support for the use of multiple projectors,
generated slide deck. In business settings, conferences, and                         beyond the common practice of displaying the same slide
many classrooms, presenters use computer slides as the                               on many projectors at once. Our work is aimed at designing
main visual aid to support their talks. To create these slide                        next-generation presentation software that will capitalize on
decks, presentation tools such as Microsoft’s PowerPoint or                          larger and higher-resolution displays to support existing
                                                                                     practices, while capturing more of the advantages of
                                                                                     traditional blackboard presentations so lecturers have a full
                                                                                     range of options. We believe many techniques easily used
Permission to make digital or hard copies of all or part of this work for
personal or classroom use is granted without fee provided that copies are
                                                                                     with blackboards have been lost with the move to
not made or distributed for profit or commercial advantage and that copies           computer-generated presentations. Our goal is to combine
bear this notice and the full citation on the first page. To copy otherwise,         the best of both traditional and electronic media techniques.
or republish, to post on servers or to redistribute to lists, requires prior         In contrast to electronic slides, instructors have been using
specific permission and/or a fee.
CHI 2008, April 5–10, 2008, Florence, Italy.
                                                                                     blackboards and whiteboards in classrooms for over two
Copyright 2008 ACM 978-1-60558-011-1/08/04…$5.00.

                                                                               695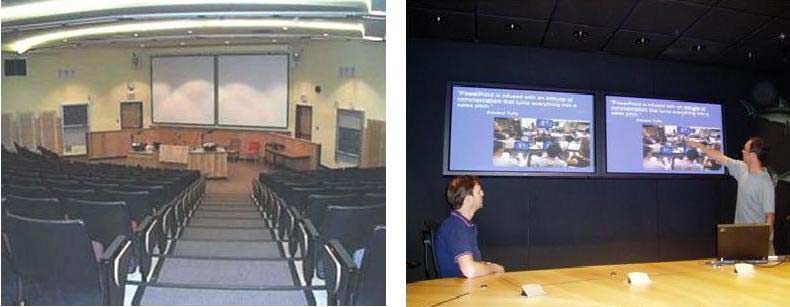
CHI 2008 Proceedings · Tools for Education                                                   April 5-10, 2008 · Florence, Italy

centuries [3] to present and explain complex ideas. We                incorporating flexible pen-based interaction with slides
believe there is much to learn by looking at how older                include Classroom Presenter [2], which integrates pen-
technology worked.                                                    based writings with prepared computer slides on a tablet
                                                                      PC, and E-Chalk [7], which uses electronic whiteboards
As a first step, we conducted an observational field study to
                                                                      that allow recording classroom whiteboard activities.
examine current practice with both electronic slides and
                                                                      Focusing on the audience, Livenotes [11] supports students’
more traditional visual aids, comparing presentations in
                                                                      cooperative note-taking overlaid on top of the instructors’
both conference and classroom settings to identify problems
                                                                      slides. Other projects [4,23] support multiple projectors to
with existing presentation software and to understand how
                                                                      enable information to persist longer, but require
best to utilize multiple high-resolution screens to support
                                                                      sophisticated infrastructure and are limited to showing
both presenter and viewers. A blackboard (this refers
                                                                      previous slides on separate projectors, each slide filling an
equally to whiteboards unless otherwise noted) allows
                                                                      entire screen. Other classroom systems concentrated on
instructors to visually present ideas using a large surface
                                                                      capturing the lecture for later viewing. Classroom 2000 [1]
that they dynamically control. Lecturers decide what
                                                                      incorporated technology in the classroom to facilitate
information to erase and what to leave for future reference.
                                                                      capturing, archiving, retrieving and presenting of classroom
Multiple or sliding blackboards allow a large amount of
                                                                      activities. Classtalk [5] and ActiveClass [22] focused on
information to be simultaneously visible to viewers, while
                                                                      facilitating active learning in classrooms by using
newer computer slide systems seldom do. Our field study
                                                                      technology to encourage student participation.
formalizes these intuitions by providing a catalog of usage
patterns, including a taxonomy of event types, distinctions           These systems address some limitations of existing
between content types and their respective roles, and                 presentation tools or introduce technology to the classroom
analysis of temporal phasing of material.                             to promote learning, yet none fully investigate the design
                                                                      space of slide presentations or make comparisons with
Based on our findings, we developed design guidelines for
                                                                      older, non-computer presentation technology. Our approach
electronic presentation tools and have implemented a
                                                                      is to first observe existing practice, identifying limitations
prototype system that enables lecturers to present computer-
                                                                      and possibilities to inform new solutions.
based visual aids using multiple displays. The system
blends the advantages of traditional blackboards with
                                                                      Computer Slide Use in Education
modern computer-based tools to support learning, and                  Theories of cognitive and educational psychology
serves to validate the design guidelines and illustrate the           acknowledge the advantage of using visual aids to assist
principles gained from the observational field study.                 learning. Meyer [15,16] theorized that we process
                                                                      information through two separate channels, visual and
PREVIOUS WORK
                                                                      auditory, and that learning can be enhanced using both
Electronic Slides                                                     channels together so that working memory can organize and
The most prominent presentation tool is Microsoft                     unify the two channels for long-term memory. Channels are
PowerPoint, which is estimated to be used for about 95% of            limited in their processing abilities. We risk cognitive
presentations world-wide [21]. As the market leader                   overload if we overwhelm them.
PowerPoint has garnered much criticism, but similar
critiques can be applied to almost all other presentation             Although computer slides are prevalent in classrooms, the
tools, such as Apple’s Keynote or OpenOffice’s Impress.               pedagogical implications of using them remain unclear.
Perhaps the best known critic is Tufte, who claims                    Most studies focusing on whether or not electronic slides
PowerPoint degrades communication by forcing users to                 are preferable have found that students responded positively
separate content and analysis, reduces concepts to                    to the use of computer slides in the classroom in
meaningless bullets, and enforces strict, unneeded                    comparison to blackboards and overhead transparencies
hierarchies [27]. Of particular relevance to our work, Tufte          [6,14,26]. Students indicate that slides help them improve
also claims that PowerPoint slides have low data resolution,          organization of course material, help them learn material
and that visual reasoning is impaired because information is          more effectively, and make classes more interesting and
stacked over time instead of adjacently over space. Others            entertaining [14]. In many schools instructors are expected
criticize PowerPoint for fragmenting thoughts and editing             to use presentation software. Those who do not are
ideas by dictating how information should look and be                 considered by students to be unprofessional. In sharp
organized [12,21], while defenders argue that PowerPoint is           contrast, most studies examining the effect computer slides
only a tool sometimes used poorly [20].                               have on learning outcomes have found no significant
                                                                      improvement in student performance with slides compared
Presentation Systems Research
                                                                      to other visual aids [14,26]. Two surveys of the literature on
Some research systems provide alternatives for linear                 the effect of interactive whiteboards in classrooms [8,24]
presentation style using “mindmaps” [10] or zoomable user             include mostly small-scale studies on the impact of
interfaces [9]. Others add support for delivering the                 interactive whiteboards on pedagogy and classroom
presentation [18,19]. In classroom settings, systems                  atmosphere. They report positive feedback from both

                                                                696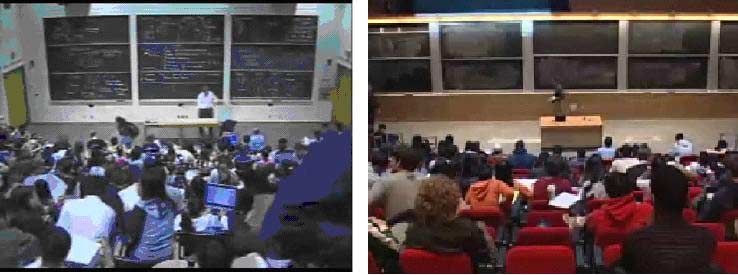
CHI 2008 Proceedings · Tools for Education                                                     April 5-10, 2008 · Florence, Italy

                                                                        a problem writing one line beneath another, each line
                                                                        derived from previous lines until a conclusion is reached.
                                                                        An example is an instructor writing a proof for a
                                                                        mathematical theorem (Figure 2a).
                                                                        Immediate Aid (IA) acts as a “just-in-time” visual aid. It
                                                                        only exists in the context of explaining something specific,
                                                                        and loses meaning without the context of the instructor’s
                                                                        speech. It may be a collection of disconnected sketches,
                                                                        equations, numbers or words as anchors, tangible objects
                                                                        concurrent with the instructor’s words (Figure 2b). Looking
                                                                        at it afterward usually will not have much meaning.
                                                                        Text occurs when the instructor writes text to emphasize an
  Figure 2. Examples of different types of board usage: (a)             important point, to provide a heading, to write down a
 Logical progression, (b) immediate aid, (c) text, (d) diagram.         bullet-point list, or just to spell out a word (Figure 2c).
students and teachers: teachers report having more                      Diagram is when the instructor draws a sketch, usually to
flexibility and versatility in their presentations, while               convey an abstract concept: in a lecture on physics the
students report being more motivated.                                   concept of electric fields might be illustrated by drawing
                                                                        particles and arrows to represent the field (Figure 2d).
While the education community is still unsure of the
pedagogical implications of introducing computer slides                 Table occurs when the instructor draws a tabular
into classrooms, and they debate if and how slides should               arrangement and Graph occurs when the instructor draws a
be used, everyone agrees that computer slides are already in            chart. Both are special cases of Diagram, or hybrids of
widespread use [14]. Seldom, however, does the literature               Diagram and Text.
address questions of how presentation systems should be                 For instructors using computer slides, we categorized slide
designed to aid students’ learning. In our field study, we              content similarly. Slides can contain LP, text, diagrams,
address these questions by observing usage of traditional               graphs or tables. Slides may also include images, but not
and computer-based visual aids and examining how they                   IA because that requires the presenter to dynamically
are used to promote learning.                                           change visual content.
METHODOLOGY                                                             Structured Observations
We first observed use of general visual aids in classrooms              Based on our initial observations and categories of usage,
at our university. From these initial observations we                   we developed a two-level coding scheme for the main field
developed a coding scheme for presentations, which we                   study. We coded use of visual aids during presentations
then applied in a larger, structured observational field study          from three different corpora: (1) conference presentations
of both classroom and conference presentations.                         that used computer slides, (2) university lectures in which
                                                                        the majority of the lecture was given using computer slides,
Initial Observations                                                    and (3) online lectures in which the majority of the lecture
We attended 60 hours of undergraduate classroom lectures                was given using a blackboard or a whiteboard. We chose
to develop a general understanding of how instructors use               these corpora to compare usage of computer slides in two
visual aids in the classroom, and to identify categories of             different settings (conference and classroom), and to
usage that could be used to build a coding scheme for                   compare slides with multiple blackboards, which are more
subsequent structured observations. We observed many                    dynamic and utilize more real estate.
different lecturers on a variety of subjects including
chemistry, mathematics, political science and psychology.               Conference Slide Presentations
We purposely attended lectures in classrooms of various                 We attended 21 presentations at the ED-Media conference
sizes and with different visual aids: whiteboards,                      in June 2007. These were research presentations in the field
blackboards, overhead transparencies, computer-generated                of educational multimedia held in small rooms (up to 50
projected slides and combinations of these. We did not                  seats) using a standard data projector and a free-standing
record detailed interactions or content, but instead gathered           screen with an approximate size of 1.5m x 1.5m. The screen
general observations concerning visual aid usage. Further               was situated at the front of the room with the top of the
details can be found in [13]. Usage categories identified for           screen at a height of approximately 2.5 meters so the
whiteboards and blackboards in classrooms: were logical                 presenter could gesture at a slide. Average presentation
progression, immediate aid, text, diagram, table and graph.             time was 17.8 min (SD = 4.4).
The first four are shown in Figure 2.
Logical Progression (LP) is common in science,
engineering and mathematics classes. The instructor solves

                                                                  697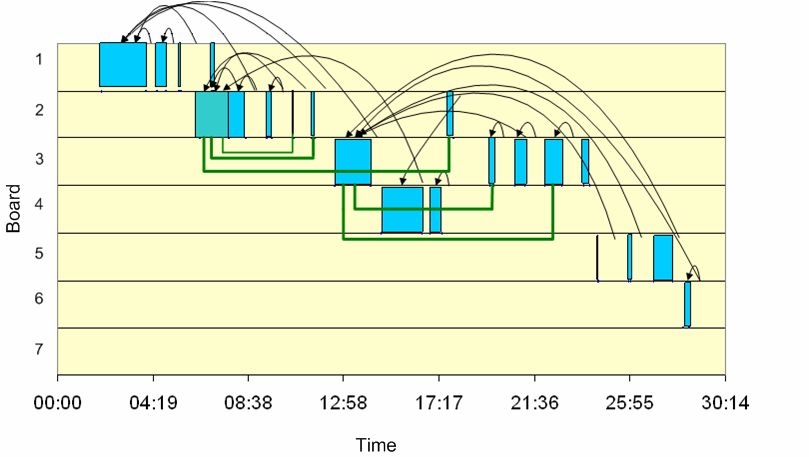
CHI 2008 Proceedings · Tools for Education                                                   April 5-10, 2008 · Florence, Italy

                                                                      instructor uses as one logical area. Often a board unit is one
                                                                      physical board, but the instructor may draw a line to divide
                                                                      a physical board into two or more units when she wishes to
                                                                      have separate logical units. We recorded the location and
                                                                      time of the following major events:
                                                                      • Writing. A single writing event was determined
                                                                           according to the content: text, LP, IA, graph, diagram,
  Figure 3. Classrooms with 3x3 and 5x2 arrays of sliding                  and table. The act of drawing a diagram or writing a
    blackboards (images used under license from [17])                      sentence was coded as a single event.
Classroom Slide Lectures                                              • Layer. New information is added to content written
To see if presentation style and use of slides differ between              earlier.
formal conference presentations and classroom lectures, we            • Erase. The entire board or item of content is erased.
attended 18 undergraduate lectures by 12 different                    • Gesture. Gestures at the board were recorded.
instructors presented at our university in which the main             Coding Reliability
visual aid was computer slides. Classes included anatomy,             All lectures were coded by the first author. To assess the
biology, chemistry, economics, nutrition and political                reliability of the coding scheme, a second coder attended
science. All were held in large lecture halls (more than 150          two of the classroom slide lectures and two randomly
seats) equipped with projectors. The size and location of the         chosen blackboard lectures. For slide lectures, there was a
screens varied, but most were positioned high above the               94% agreement on events between the two coders (Kappa
presenter. To gesture some instructors used a laser pointer           coefficient = 0.89), with only a few gesture events missed,
or a laptop’s mouse, while others did not use a gesturing             and 93.2% agreement on content (Kappa = 0.85). In the
device. Average lecture time was 48.0 min (SD = 8.7).                 blackboard corpus there was 86.7% agreement on events
                                                                      (Kappa = 0.79), but we encountered difficulties assessing
Classroom Blackboard Lectures
                                                                      content. For the first blackboard lecture, the second coder
We coded 15 lectures by 15 different instructors offered on           forgot about the IA category and coded those events as text.
MIT Open Courseware [17]. All used blackboard or
                                                                      This was identified and corrected for the second lecture, but
whiteboard as the main visual aid. The videos were
                                                                      only 4 out of the 7 IA events were coded by both coders.
professionally recorded in MIT undergraduate classes. Most            This suggests there may be a lack of precision in the IA
(13) were in large lecture halls using a 3x3, 3x2 or 5x2 grid
                                                                      category. Coding the three missed IA events as text yielded
of sliding boards (see Figure 3). The remaining three were
                                                                      a 91.5% agreement on content (Kappa = 0.87); coding them
in small classrooms using only two blackboards. Subjects              as errors yielded an 84.1% agreement (Kappa = 0.80).
included biology, chemistry, computer science, electrical
engineering, material science, mathematics and physics.               Interviews
Average lecture time was 44.8 min (SD = 6.0).                         To supplement the observational results, we conducted
                                                                      semi-structured interviews with six experienced university
Coding Schemes
                                                                      instructors from commerce, computer science and
We developed two coding schemes, one for the blackboard               mathematics. During a one hour session, instructors were
lectures and one for the slide corpora. The overall goal was
                                                                      asked about their usage of visual aids, including but not
to explore how content is spatially and temporally
                                                                      limited to blackboards and slides. The goal was to
organized and presented. Gestures were recorded because               understand what types of aids were used, and for what
they show a degree of interaction with the material being
                                                                      purpose different types were used.
presented, thus providing an indication of how and when
content was used.                                                     FINDINGS
Slide coding scheme. For both the conference and the slide            We report quantitative and qualitative findings. Comparing
lecture corpora we used the same coding scheme, recording             classroom to conference slide presentations allows us to
the time for each event. The major events were:                       understand if and how people adapt their use of
• New slide. A new slide appears. Slides were further                 presentation software between the two settings. When
     categorized based on their most prominent type of                comparing slide-use and board-use our goal was not to
     content: text, LP, diagram, graph, image, or table.              quantitatively compare slides and boards since interactions
• Layer. New information is added to a slide.                         with each were quite different. Our purpose was instead to
• Slide back. The instructor returns to a previous slide.             isolate and identify the differences and understand how
• Gesture. Both hand gestures and gestures using an aid,              blackboards are used in ways that slides are not.
     such as a laser pointer or the computer’s mouse, were
                                                                      Similarities of Slide-use in the Two Settings
     counted as gesture events.
                                                                      Computer slides were used as the main visual aid in both
Blackboard coding scheme. Each event occurs on a single               conference and classroom corpora. The average time spent
board unit. A board unit is a part of the board that the              on a slide was significantly less in the conference (54.5s)

                                                                698
CHI 2008 Proceedings · Tools for Education April 5-10, 2008 · Florence, Italy
conference corpus and 88% in the classroom corpus).
Image slides were gestured at (36% and 25% of the
conference and classroom corpora, respectively) more than
text and less than tables, diagrams and graphs.
Figure 6 presents the percentage of events gestured at for
each type of content of the blackboard corpus. The pattern
is similar to that of the slides, with a high percentage of
gestures on tables, diagrams, graphs and LPs (combined
Figure 4. Proportion of each content type for conference (390
slides), classroom slide (413 slides), and classroom blackboard 75.2%), and a lower percentage on text (27.6%) and IA
(474 writings) corpora. gr=graph, im=image, diag = diagram, (40.6%).
lp = logical progression, IA = immediate aid, ta = table
100
than in classrooms (112s) (t(806) = 35.2, p < 0.001). This 90
matched our expectations because conference presentations 80
are shorter and usually provide higher density of 70
60
information. Differences in the average time spent on
Percent
50
different content types within each corpus were not 40
significant. 30
20
The distributions of content types in the three corpora are 10
shown in Figure 4. In both slide corpora, text was the main 0
visual component (68% of conference slides and 75% of text table diagram IA graph LP
lecture slides). In the blackboard corpus, different types are
more evenly distributed with less text content and more Figure 6. Percentage of writing events (N=474) gestured at for
diagram and LP content. While this can be partly attributed each content category in the blackboard corpus.
to the types of classes using the blackboard (more Figure 7 shows the average amount of time instructors
scientific), it may also be caused by the fact that writing of spent writing each type of data in the classroom corpus.
text takes too much time for the blackboard. This was measured from the beginning to end of writing,
Figure 5 shows the percentage of slides gestured at for both and may include pauses for explanation. We conducted a
slide corpora. The corpora were surprisingly similar. one-way ANOVA to evaluate the effect of content type on
Although both were very different in the setting, type and time. A main effect of content type was significant (F(1,5)
content, and show significant differences in time per slide, = 16.4, p < .001). The pairwise comparisons, using a
both the distribution of types of slides and the amount of Bonferroni adjustment, showed that text (M = 18.9s) was
gesturing for each type of slide (Figures 4 and 5) were significantly shorter to write than diagrams (M = 53s),
relatively similar in comparison to the blackboard corpus. graphs (M = 54s) and LP (M = 36.1s), (p < .001 for all
comparisons). IA (M = 9.8s) content was also significantly
Rich and Support Content shorter to write than diagrams, graphs, and LP (p < .001).
As can be seen in Figure 5, in both slide corpora, there was Summarizing these findings clearly distinguishes two
a dramatic difference between the percentage of gestures on different groups of content. Rich content includes diagram,
text slides and on other types of slides. Text slides were table, graph and LP types, while support content includes
least gestured at (17% of conference corpus and 11% of text, IA and image types of content. Rich content is focused
classroom corpus). Diagrams, graphs and tables on the on much more by the instructor: it is gestured at more often
other hand, were highly gestured at (combined, 73% of the (Figures 5 and 6), takes more time to be written (Figure 7),
60
100
90 50
80
70 Conference 40
Time (s)
60
Percent
50 30
Class
40 lectures 20
30
20 10
10
0 0
text table diagram Image graph text table diagram IA graph lp
Figure 5. Percentage of slides gestured at for each content Figure 7. Average duration of writing events for each content
type for conference and class slide corpora. type for the blackboard corpus.
699CHI 2008 Proceedings · Tools for Education April 5-10, 2008 · Florence, Italy
and results in more gesture iterations (Table 1) than support
content. In contrast, support content takes less time to write,
and is gestured at and iterated upon less.
In the rich content group the presenter uses the visual as the
focus of the idea, and therefore will spend much time and
will gesture often. Support content, on the other hand, is
used as a secondary visual aid to the spoken explanations.
Text, for example, is used mainly for headings or
redundancy. It is self explanatory and in the same modality
(verbal) so it does not need to be gestured at.
The Importance of Gestures Figure 8: Diagrammatic example of a blackboard lecture.
During a writing event, many times the instructor would lift Blocks represent writing events, curved arrows represent
the pen or chalk, explain the content with gesturing, then gestures, rectangular lines represent layer events.
continue writing the same content. We recorded this as one
writing event, but we also recorded the number of writing
interpersonal engagement between the presenter and the
iterations, distinguishing between two iterations as having a
audience, thus reducing learning outcomes [14].
gesture between them. The average number of iterations
and frequency of iterations can be seen in Table 1. We can
Data Persistency
see that for the rich content types, especially graphs and
diagrams, a high percentage of events is iterated upon. Long-Term Persistency
Using the blackboard, data persists for longer than when
D G LP Table IA Text using slides, allowing the audience to see previous content.
Average To examine if data not only persists longer, but is also used
iterations
3.4 4.6 3.3 3.6 2 3
more at later points by the presenter or audience, we
% of events
41.1 42.8 32.4 25 3.1 0.5 examined gesture and layer events on older board units.
iterated upon
Table 1. Average number of iterations and percentage of To illustrate the degree to which instructors refer back to
events iterated on for each type of content for the
previous content in blackboard lectures, Figure 8 shows one
blackboard corpus. (D = Diagram, G = Graph)
blackboard lecture using sliding boards throughout time.
The X axis represents time, while the Y axis represents
In a blackboard setting, the instructor is usually close to the
board units. Each box represents a writing event in time (X)
board, making it easier and more natural to gesture at the
and space (board in Y). Arrows represent gestures at the
desired content as there is an embodiment of the instructor
corresponding content, and the bottom square lines
with the visual aid. We had therefore expected there would
represent the addition of layers on top of existing content
be more gestures in the blackboard corpus than in the slide
(e.g., adding new content to a previously sketched graph).
corpora. To compare the number of gestures using the
This diagram, can help to understand the flow of
blackboard and computer slides, we compared between the
blackboard use during the lecture.
two classroom corpora. There was a significant difference
showing more gestures in blackboard classes (M = 38.2) The active board is the board where the most recent writing
than in slide classes (M = 6.5) (t(28) = 16.4, p < 0.001), event occurred. A referral back is defined as a gesture to a
even though the lecture lengths were similar between the previously written content item on a board unit other than
two corpora. the active board. Often, when instructors verbally refer back
to a concept, they gesture at the visual aid used when
Gestures are important for the presenter to connect the
explaining that concept. This helps the students easily recall
audio and visual parts of the presentation, focus the
the previous item and reduce their cognitive load when they
attention of the audience on the visual aid, and specifically
learn new items, since they connect the concept with the
show some detail on the visual. As we have shown, this is
place and image of the visual aid. An example of this can
most important on rich content types. Using slides, there
be seen in Figure 8A. There was a total of 117 referral
may be a feeling of a disembodied voice when the audience
backs for an average of 7.8 per lecture (SD = 4.4). The
is viewing slides and only hearing the notes. An instructor
average elapsed time between a writing event and a referral
writing on the blackboard and gesturing at what is written
back to that content was 8:55 min (SD = 6:43m). If we try
will retain the audience attention on him or her, thereby
to compare referral backs with computer slides, the only
communicating nonlinguistic behaviour that is important
similar behavior is the presenter navigating back through
for the interaction with the audience. We observed that
the slide presentation to a previous slide. This behavior
when an instructor looks at the slides projected on the wall,
occurred only six times in the entire classroom slide corpus
or stands behind the podium looking at his or her laptop, the
and only three times in the conference corpus. Although we
audience will focus on the slides and not on the instructor.
did not explicitly record duplicate slides, which could be
This may create a learning environment in which there is no
700CHI 2008 Proceedings · Tools for Education April 5-10, 2008 · Florence, Italy
used as a form of referral back, our informal observation is Pacing and In-depth Exploration of Rich Content
that their use occurred rarely. From our initial observations, we hypothesized that a slide
lecture shows more information than a blackboard lecture,
A write back is a writing event on a previously used board and that the pace of a blackboard lecture is slower. Five of
which is not the active board. This usually occurs when the the six instructors interviewed agreed to this, as one
instructor adds a layer to existing content (like a diagram) instructor commented:
or when the instructor writes new content in proximity to “You can move more quickly with slides. […] I use the whiteboard
previously written content usually because it is semantically whenever I want to slow down the pace.”
related. An example of this can be seen in Figure 8B.
Instructors averaged 2.0 write backs a lecture (SD = 2.9). To get a very rough estimate of the amount of information
in slides and boards, we conservatively estimate the number
We observed that in many lectures, there were content of slides that would be required to display the visual
items that were the center of attention for a long time. The information in the blackboard lectures according to the
writing event highlighted in Figure 8C, for example, took a following transformation: any one diagram graph or table
minute and a half to write, but then from around minutes 20 event, two LP events, or three text or IA events equals one
to 30 it was referred back to and written on several times slide. Using this estimation, we calculate that blackboard
and was clearly still active. To examine how many of these lectures present less visual information on average; when
content events occurred per lecture, we defined a highly the length of lecture is divided by the number of estimated
referenced content item as one which was gestured at or slides, the average is 162s per slide. In contrast, the average
layered back on at least five times from different points in slide length in the slide classroom corpus was 112s. This
the lecture. Given this definition, there was an average of supports the idea that slide lectures show more information
1.9 highly referred to content events per lecture (SD = 1.2). in a shorter period of time than blackboard lectures. This
All but one of these events was of rich content. This difference in pacing could be because the computer slides
suggests that only a few items need to be kept persistent for are premade and do not require content creation during the
a long length of time. lecture. Another possibility is that the slower pacing of the
blackboard is a result of its support more in-depth, dynamic
Short-term Persistency development of rich-content ideas. Using slides, presenters
Most of the gestures instructors made were to recent usually follow a steady pace, going from one idea to the
information. Referral backs, which are mostly at items next in a linear manner. Blackboards, on the other hand,
written less recently, comprised 23.5% of all the gestures, support a slower, less deliberate pace, showing less
while 62.3% of the gestures were at content items that were information for longer periods of time. For example, in our
no more than four writing events in the past. This interviews, one math instructor who mainly uses the
emphasizes that instructors most often use information that blackboard commented:
was only recently presented. From informal discussion with
students, we believe that students can benefit largely from “The first thing I can say about blackboard teaching is that the
having the most recent data persistent. First, having pace is slower, and that already has much value […]. The Pace of
writing stuff on the board is much more adequate in terms of the
previous content visible may help to understand how ability of people to digest [mathematical] derivation.”
current explanations have been reached. Second, students
copying notes often need the recent data to be kept for Boards support more in-depth exploration of a single idea.
longer. Third, by having more data persistent, the control of The temporal build up of a problem plays an important role,
what to look at and how to assimilate data is transferred allowing the audience to gradually understand each
from the instructor to the student. Using slides, the building block of the problem. This is shown mainly in rich
instructor tells the student what he or she needs to look at. content types like diagrams or LP that usually represent
Using sliding boards with the whole lecture data persistent, more abstract, complex information. Indeed, diagram (21%)
the student is empowered to use what is best for him or her, and LP (24%) type were much more common in the
thus encouraging active learning. blackboard corpus than in the class slide corpus (4% and
2% respectively). Looking back at Table 1, we see that rich
Some instructors post their slides to allow students to bring content has a higher number of gesture iterations suggesting
printed handouts of slides to class. While handouts allow temporal build up of the information. This can also be seen
content persistence for students, we did not see an effect on in the layer events. In the blackboard corpus there were a
instructors' teaching styles. Instructors cannot refer back to total of 47 layer events in which additional information was
handouts in the same way they interact with information added onto existing information. Although possible to do in
displayed for the entire class. In interviews, some existing slideware,, this type of behavior was not observed
instructors said they were reluctant to post slides because in the slide corpora.
students might not attend or would not pay attention in
class, having the content available ahead of time. Comparing Between Two Content Items
We noticed that in some cases, instructors explicitly
compared two items on a single board or on two different
701CHI 2008 Proceedings · Tools for Education April 5-10, 2008 · Florence, Italy
boards. This could be identified by iterating gestures Computer Slides Boards
between two content items. We asked instructors if they Multimedia capability Dynamic and spontaneous
compared items when they use the board. All instructors Easily shows premade content More space (multiple boards)
said that they do compare items, and some said they wish Data persists before and after Natural gesturing –
they could compare two slides. One instructor commented: presentation embodiment of presenter with
“I often feel a slide is too small, and a lot of times it’s because High resolution images visual aid
there is something I’d put on one slide that I wish I could put on displayed Enables temporal buildup of
the other slide and see them at the same time” Legible and organized rich data
Non-linear
Dynamic vs. Static Nature of Content Simulates problem solving
Slides are commonly presented in a static manner, and
rarely does one see a presenter navigating through his or her Table 2. Comparison of the advantages of slides and boards
slides in an order other that which was predefined; in our
observations, presenters have returned to previously shown the audience because of the need to remember previous
slides only 3 and 6 times in the conference and classroom ideas.
corpora, respectively. Although it is possible to annotate We suggest a two-fold approach for data persistency in
slides using electronic ink in PowerPoint, which would presentations. First, we suggest broadening the window of
allow for more flexibility, we did not observe this in either persistence of current content. As we have shown, most
slide corpus. Blackboards, on the other hand, afford much gestures are aimed at recent writing events. By showing the
more spontaneity. As one instructor has said: most recent content as long as possible this will
“I tend to switch back to the whiteboard when I’m doing accommodate the audiences’ need for immediate context.
something particularly ad-hoc or spontaneous”. Second, we suggest allowing the presenter to keep certain
data available for longer times. We have shown that some
Using the blackboard, the presenter can drift from one idea data needs to be referred to from later parts of the lecture.
to another without having to plan the entire lecture in This need not take much space. We have shown that only
advance. IA content, for example, reflects use of the visual two items on average were referred to multiple times
aid as support for spontaneously given explanations. throughout the lecture. By allowing the instructor to keep
these items persistent, we can help reduce the audience’s
DISCUSSION cognitive load, and assist learning.
Table 2 summarizes the advantages of slides and of
blackboards, as found in our observations and interviews. We have distinguished between two types of visual data:
Incorporating characteristics from both will be important rich content and support content. We found that rich
for designing effective classroom presentation systems. content, which include diagrams graphs tables, and LP,
took longer to write, had more gestures, and in the
According to Tufte [27], using PowerPoint as the main blackboard corpus also had more iterations of gestures.
visual aid dictates a certain cognitive style of presenting When supporting rich content in presentation software, we
information that most presenters use regardless of the should allow more space, focus attention on it, provide
situation and content of presentation; this should also apply long-term persistency possibilities, and, if possible, support
to competing commercial presentation tools. Our findings gesturing. Support content, in particular text, does not
support Tufte’s claim by showing similar trends for the necessarily need to be in the focus of the attention. IA
usage of slides in two very different corpora using slides, content is a special case. While all other types refer to the
and showing different trends of usage than a different data’s content, IA refers to how the data is being used.
medium such as a blackboard. This also suggests that Without electronic ink or some other input interaction, it
instructors are not adapting their slide use for teaching. would be difficult to emulate this kind of behavior because
Slide presentations are inherently sequential over time of its dynamic nature.
showing one slide after another: we observed that The pace of the presentation is different when the presenter
presenters using slides rarely go back to previously shown uses slides or board. Slides show more information, and
slides. This may have implications for cognitive load theory generally have a faster pace, and therefore may be more
[25], which states that best learning is achieved when suitable for business or conference settings in which the
cognitive load on working memory is minimized. It presenter wishes to convey more preset information in a
suggests that instead of loading the working memory by short amount of time. Boards, on the other hand, are more
mentally integrating pieces of information one should try to suitable for learning of complex ideas. They are more
physically integrate these sources of information. When dynamic, and support more in-depth exploration of rich-
instructors refer back to information using the blackboard, content ideas using temporal build-up of the information.
they physically integrate the different pieces of information. They support non-linearity since the presenter can more
Using slides, on the other hand, increases cognitive load of easily show how several ideas, written previously on the
board, support the current idea.
702CHI 2008 Proceedings · Tools for Education April 5-10, 2008 · Florence, Italy
Limitations that the computer used for presentation must have two
Most courses in the blackboard corpus were science and video cards to control the two screens. We use the Village
engineering lectures. Math-related courses usually use Tronic VTBook© card that connects to a PCMCIA slot.
blackboards for visual support because of their advantages
in problem solving and slower pacing. This poses a possible System Description
limitation on how our results generalize to other domains. MultiPresenter does not currently allow authoring of slide
We believe that while our insights stem from the content. Slides can be authored in PowerPoint and saved in
observations of mostly science lectures, they are valid for image format, then loaded to the system. They are
any area that conveys complex reasoning and learning. presented to the instructor in a split-screen view in which a
stream of slides is shown on the left. When presenting, the
Design guidelines instructor’s display changes to a presentation view showing
Summarizing the important points from our analysis, the the current two slides on display, enabling the presenter to
following guidelines are given for designers of presentation navigate to different areas in the presentation.
systems that support learning:
The system has three basic modes. The first two modes
1. Provide short-term persistency of data. Data usually assume that the instructor does not want to interact with the
builds on top of other data. Showing the latest data for system during the lecture. In the first, the instructor simply
longer is beneficial to the audience. progresses from one slide to the next., as she would in
2. Provide long-term persistency of data. Some data is PowerPoint. Following the short-term persistency
important throughout longer periods of the guideline, the current slide is on one screen and one, two or
presentation. It is important to provide the instructor four previous slides are on the second screen to give the
with a means of showing specific data for longer. audience more context,and to allow the audience to look at
3. Support gradual build-up of information. Gradual, content that may have been missed.
temporal build-up of the problem is important for The second mode is a custom-made presentation using two
learning complex ideas. screens. In authoring mode, there are two columns of slots
4. Rich content is different than support content. in which slides can fit, representing the two screens. The
Designers of systems that handle content should slide deck loads on a single column, and the user authors a
emphasize support for presenting rich content dual-screen presentation by copying, moving or stretching a
information, allowing for long-term persistency and slide to one or more locations in the second column. This
easy gesturing. Support content can be more peripheral. presentation mode is useful when comparing two slides,
5. Gestures are important. Gesturing is important to showing an overview slide and a detail slide, or when an
connect the visual aid with the presenters’ auditory important slide is kept for a longer time alongside regular
explanations. A presentation tool should ideally slides. This follows the long-term persistency guideline.
support specific gesturing at areas of the visual The third mode requires interaction by the presenter, but
presentation. This will be especially important in high- allows the presentation to be more dynamic and interactive.
resolution, wall-size displays. The system shows the main stream of slides on one screen.
6. Support dynamic content. Presenters should be allowed The instructor can at anytime select a part of the slide (e.g.,
to dynamically add, control, change, and remove an important diagram) and drag and drop it to the other
content. screen. She can then move, resize or erase any snippet on
the other screen. All interactions are shown on the
MULTIPRESENTER presenter’s laptop as well as to the audience so the audience
Based on the guidelines outlined above, we have built knows where the data have come from. The presenter can
MultiPresenter, an early prototype slide presentation system thus create and manipulate a “clipboard” of highly referred
for multiple displays (Figure 9). MultiPresenter allows the to content that she deems important, following the long-
presenter to author presentations for two screens, and term persistency and dynamic content guidelines.
control the presentation flow using her laptop. Following
our guidelines of short-term persistency, long-term
persistency, and dynamic content, it allows the presenter to
show previous content (either automatically or user-
controlled), to compare between two slides, to have an
important slide persist for a long time, or to interactively
manipulate content from one screen to the other.
Unlike other systems that use multiple projectors with
dedicated servers or a complicated infrastructure, we
believe that for the system to be usable it should be
lightweight and able to run on any laptop connecting to
existing projectors in any room. The only requirement is Figure 9 - Image of our MultiPresenter in use in a classroom
703CHI 2008 Proceedings · Tools for Education April 5-10, 2008 · Florence, Italy
Future work 8. Glover, D., Miller, D., Averis, D., Door, V. The Interactive
MultiPresenter is at a very early stage of development. An Whiteboard: a literature survey. Technology, Pedagogy and
important next step will be to evaluate the system in use. Education 14:2 (2005) 106-113.
Although further design iterations are required in the short- 9. Good, L., Bederson, B. Zoomable User interfaces as a medium
term, our long-term evaluation goal is to have instructors at for slide show presentations. Information Visualization 1:1
our university use MultiPresenter as an integral part of their (2002) Palgrave Macmillan, 35-49.
classes. We plan to evaluate how they use the system, their 10. Holman, D., Stojadinovi´c, P., Karrer, T., and Borchers. J. Fly:
response to it, the audience’s response, and the audience’s an organic presentation tool. Extended Abstracts CHI (2006),
learning outcomes. Electronic ink adds another level of 863–868.
dynamicity and allows the student to follow the presenters’ 11. Kam, M., Wang, J., Iles, A., Tse, E., Chiu J.,, Glaser, D.,
way of thought [2]. We intend to add the ability to annotate Tarshish O.,, and Canny. J. Livenotes: A system for
slides for tablet PC users: one screen could show the slides, cooperative and augmented note-taking in lectures. Proc. CHI
and the other used as a blank writing area, similar in 2005 (2005) 531–540.
interaction to using slides and boards together. We also plan 12. Kjeldsen J., The rhetoric of powerpoint. Seminar.net - Media,
to investigate methods to support IA content and gradual Technology and liftelong learning 3:1 (2007)
build up of information. 13. Lanir, J., Booth, K. S., Understanding instructors’ use of visual
aids in classroom setting. Proceedings of ED-Media, AACE
CONCLUSIONS (2007), 788-794
Our observational study identified important themes and 14. Levasseur D. G., Sawyer K. J. Pedagogy meets PowerPoint: A
usage trends in different settings, the importance of research review of the effects of computer-generated slides in
persistency of data, and differences in rich and support data. the classroom. The Review of Communication 6:1-2 (2006)
We devised design guidelines for presentation systems on 101-123
high-resolution and multiple displays using these 15. Meyer, R.E., Multimedia Learning. Cambridge University
guidelines, and an initial prototype for multiple displays. Press. Cambridge, 2003
16. Meyer, R.E. and Moreno R. Nine ways to reduce cognitive
ACKNOWLEDGEMENTS load in multimedia learning. Educational Psychologist 38, 1,
We thank Clarence Chan, Kirstie Hawkey, Karen Parker, (2003), 43-52
Garth Shoemaker and Tony Tang. This work has been
17. MIT Open Courseware
partly funded by the NSERC NECTAR research network
.http://ocw.mit.edu/OcwWeb/index.htm
grant.
18. Myers, B. Using handhelds and PCs together. CACM, 44:11
REFERENCES (2001), 34–41.
1. Abowd, G., Classroom 2000: An experiment with the 19. Nelson, L. S., Ichimura, E. R., Pedersen, and Adams. L.,
instrumentation of a living educational environment. IBM Palette: A paper interface for giving presentations. Proc CHI
Systems Journal, 38, 4 (1999). 1999 (1999), 354–361.
2. Anderson, R. J., Hoyer, C., Wolfman, S., and Anderson, R. A 20. Norman D. In defense of PowerPoint. (2004) .
study of digital ink in lecture presentation. Proc. CHI (2004) http://www.jnd.org/dn.mss/in_defense_of_p.html
567-574. 21. Parker I. Absolute PowerPoint. The New Yorker, 77,13 (2001)
3. Buxton, W. A. S. Mountains, exploration, education, rich 76-87.
media and design. e-presence web archive. 22. Ratto, M., Shapiro, R. B., Truong, T. M., and Griswold,W. G.
http://epresence.tv/mediacontent/archives/2004_dec9/?archiveI The activeclass project: Experiments in encouraging classroom
D=110 participation. In proc. CSCL (2003)
4. Chiu P, Liu O, Boreczky J, Foote J, Fuse T, Kimber D, 23. Röüling G, Trompler C, Mühlhäuser M , Köbler S , Wolf S,
Lertsithichai S, Liao C. Manipulating and annotating slides in Enhancing classroom lectures with digital sliding blackboards,
a multi-display environment. Proc. of INTERACT ‘03, (2003) Proc. of SIGCSE (2004), 218-222
583-590.
24. Smith, H., Higgins, S., Wall, K., Miller, J. Interactive
5. Dufresne, R. J., Gerace, W. J., Leonard, W. J., Mestre, J.P., whiteboards: boon or bandwagon? A critical review of the
and Wenk, L. Classtalk: A Classroom Communication System literature. Journal of Computer Assisted Learning 21:2 (2005),
for Active Learning. Journal of Computing in Higher 91-101.
Education, 7, 3-47, (1996).
25. Sweller, J., Cognitive load during problem solving:, Cognitive
6. Daniels, L. Introducing technology in the classroom: Science, 12 (1988), 257-285.
PowerPoint as a first step. J. of Computing in Higher
Education, 10, 2 (1999) 42-56. 26. Szabo, A., Hastings, J. Using IT in the undergraduate
classroom: Should we replace the blackboard with
7. Friedland, G., Knipping, L., Schulte, J., Tapia, E. E- PowerPoint? Computers and Education, 35 (2000), 175-187
Chalk: A lecture recording system using the chalkboard
metaphor. Interactive Technology and Smart Education 1 27. Tufte E. The Cognitive Style of PowerPoint. Graphics Press,
(2004) 9–20 Cheshire, CT, 2003
704You can also read