Occasional Paper Series - The use of cash by households in the euro area - European ...
←
→
Page content transcription
If your browser does not render page correctly, please read the page content below

Occasional Paper Series
               Henk Esselink, Lola Hernández    The use of cash by households
                                                in the euro area

                                                   No 201 / November 2017

Disclaimer: This paper should not be reported as representing the views of the European Central Bank
(ECB). The views expressed are those of the authors and do not necessarily reflect those of the ECB.
Contents
Abstract                                                                       3

Executive summary                                                              4

1      Introduction                                                            6

2      Research method and sample                                              9

       2.1    Research scope and research population                           9

       2.2    Sample                                                           9

       2.3    Research method                                                 12

       Box 1 Payment diary surveys in Germany and the Netherlands             13

       2.4    Recruitment of respondents and data collection                  13

       2.5    Translation of survey material                                  14

       2.6    Weighting and adjustments                                       14

3      Validation                                                             16

4      Cash usage in the euro area                                            18

       4.1    Relative use of payment instruments                             18

       4.2    Average value of transactions                                   20

       4.3    Average number of transactions per person per day               22

       4.4    Payment behaviour by demographic characteristics                22

       4.5    Use of payment instruments by value range                       24

5      Use of payment instruments by market segment and for recurrent
       payments                                                               26

       5.1    Market share of payment instruments by number of transactions   26

       5.2    Market share of payment instruments by value of transactions    27

       5.3    The use of cash for recurrent payments                          28

6      Contactless payments in the euro area                                  30

7      Card ownership and card acceptance                                     32

       7.1    Card ownership                                                  32

ECB Occasional Paper Series No 201 / November 2017                            1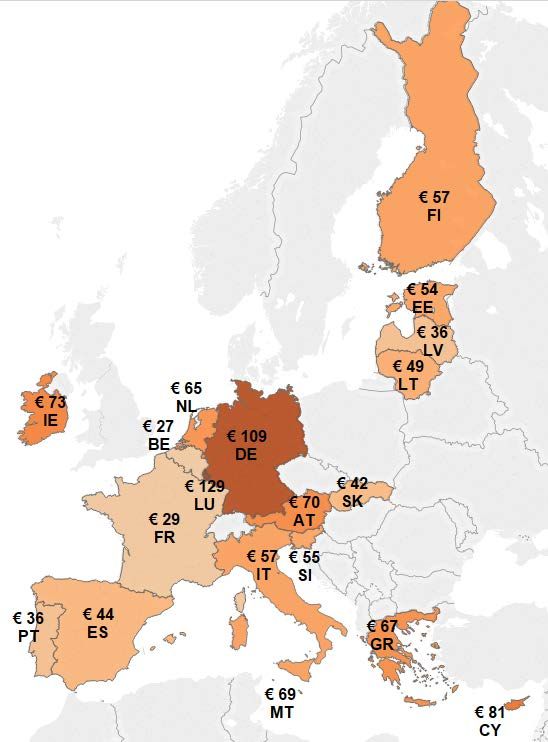
7.2    Card acceptance                                            33

8      Amount of cash people carry                                       34

9      How people acquire cash                                           36

       9.1    Cash withdrawal and replenishment by source                36

       9.2    Regular income in cash                                     39

10     Cash as a store of value and use of high denomination banknotes   41

       10.1   Cash as a store of value                                   41

       10.2   Use of high denomination banknotes                         43

11     Cash withdrawal habits and satisfaction with ATM services         46

       11.1   Cash withdrawal habits by source                           46

       11.2   Satisfaction with ATM services                             47

       11.3   Satisfaction with ATM denominations                        49

12     Payment preferences and other factors that influence consumers’
       payment choices                                                   52

       12.1   Payment preferences                                        52

       12.2   Factors that influence respondents’ choice of payment
              instrument                                                 54

13     Concluding remarks                                                56

References                                                               57

Annex A       Definition of payment instruments                          59

Annex B       Diary survey questionnaire: Study on the use of cash by
              households 2016                                            61

Annex C       Use of high denomination banknotes                         67

Abbreviations                                                            69

Acknowledgements                                                         70

ECB Occasional Paper Series No 201 / November 2017                       2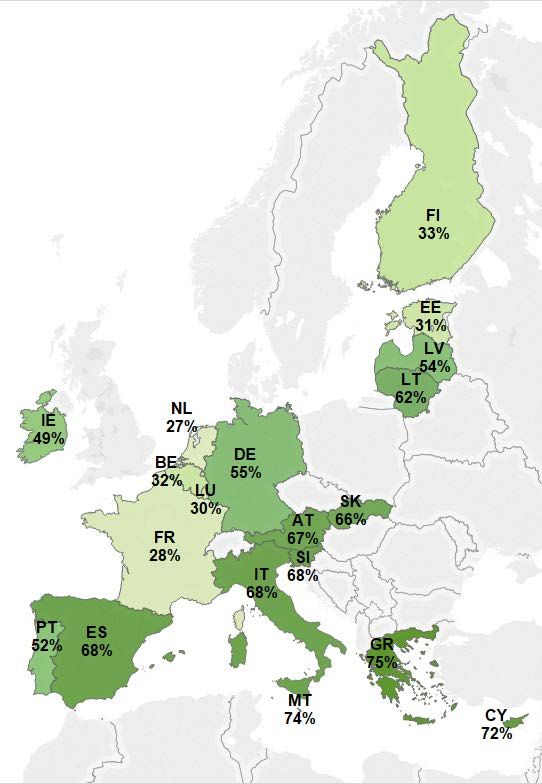
Abstract

Although euro banknotes and coins have been in circulation for fifteen years, not
much is known about the actual use of cash by households. This paper presents an
estimation of the number and value of cash transactions in all 19 euro area countries
in 2016, based on survey results. It presents an extensive description of how euro
area consumers pay at points of sale (POS). The aim of this study is to shed light on
consumers’ payment behaviour and in particular to improve the understanding of
consumers’ payment choices at POS, based on a large sample of countries.
Therefore, it provides central banks and relevant payment system stakeholders with
fundamental information for the development of their policies and strategic decisions
that can contribute to improving the efficiency of the cash cycle and the payment
system as a whole. Previous estimates of the value of cash usage by households in
the euro area date from 2008. Since then some central banks have carried out their
own research on cash usage. This paper is the first study to measure the transaction
demand for cash in the euro area. The results show that in 2016 around 79% of all
payments at POS were made with cash, 19% with cards and 2% with other payment
instruments. In terms of value, the market share of main payment instruments was
54% for cash, 39% for cards and 7% for other instruments. However, results show
substantial differences between euro area countries.

Keywords: payment behaviour, money demand, payment systems, cash, consumer
choice.

JEL codes: E41, E58, D12, D14.

ECB Occasional Paper Series No 201 / November 2017                                  3
Executive summary

The European Central Bank (ECB) has conducted a comprehensive study to analyse
the use of cash, cards and other payment instruments used at points of sale (POS)
by euro area consumers in 2016. 1 This paper presents the results of the study,
including an estimation of the number and value of payments made with cash and
cards by consumers in the euro area during the period under consideration. The
study also assesses the use of each payment instrument by consumers at the
country level. The methodology is first discussed, and the main findings of the study
are then reported.

The survey results show that in 2016 cash was the dominant payment instrument at
POS. In terms of number, 79% of all transactions were carried out using cash,
amounting to 54% of the total value of all payments. Cards were the second most
frequently used payment instrument at POS; 19% of all transactions were settled
using a payment card. In terms of value, this amounts to 39% of the total value paid
at POS.

The use of cash and cards differs according to country, place of purchase,
transaction value and consumers’ demographic characteristics. In terms of number
of transactions, cash was most used in the southern euro area countries, as well as
in Germany, Austria and Slovenia, where 80% or more of POS transactions were
conducted with cash. Cash was least used in the Netherlands, Estonia and Finland,
where its share in the number of transactions ranged between 45% and 54%. In
terms of value, the share of cash was highest in Greece, Cyprus and Malta (above
70%), while it was lowest in the Benelux countries, Estonia, France and Finland (at,
or below, 33%). When looking at the demographic characteristics of euro area
consumers, it can be concluded that men tend to use cash more often than women.
Furthermore, consumers aged 40 and over use more cash than younger age groups,
whereas cash usage appears to be relatively homogeneous across different levels of
education.

Overall, the results put the use of cash relative to non-cash payment methods by
consumers at POS into perspective, and indicate that the use of cash at POS is still
widespread in most euro area countries. This seems to challenge the perception that
cash is rapidly being replaced by cashless means of payment.

Indeed, as the results of this study show, when consumers are asked which means
of payment they prefer, a larger share report to prefer cards rather than cash –
despite the fact that they use cash more often. This contradiction may be explained
by the fact that nearly two-thirds of the transactions conducted at POS in 2016 were

1
    By other payment instruments at POS we refer to the use of cheques, direct debit, credit transfers and
    mobile payments, among others. We have grouped them into one category given their relatively small
    market share compared with cash and cards. For a detailed definition of all payment instruments
    considered in the study, see Annex A. The use of virtual currencies was not within the scope of this
    study.

ECB Occasional Paper Series No 201 / November 2017                                                       4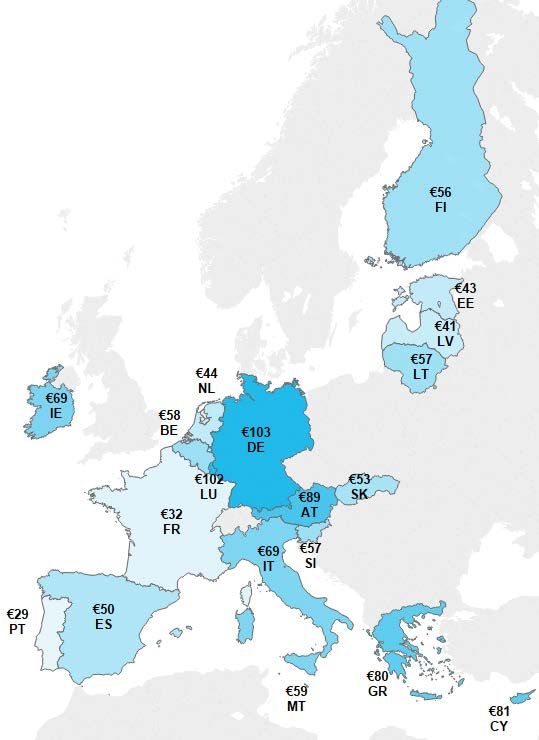
below €15. Moreover, two-thirds of all POS transactions took place in shops for
purchases of day-to-day items, as well as in restaurants, bars and cafés. On the
other hand, only 8% of all POS transactions were above €50, and only 14% were
made in shops for durable goods or in petrol stations.

When asked about their payment behaviour, people mostly seem to remember the
larger value payments which they make less regularly, and tend to forget how
frequently they make low-value payments on a daily basis.

Access to payment cards does not seem to fully explain differences in payment
behaviour, because on average access is high in all euro area countries. However,
there seems to be a relationship between card acceptance (i.e. the perceived
availability of card payment terminals) and cash usage. It can therefore be expected
that in countries and market sectors where card acceptance is still low, cash usage
may decrease once infrastructure for making card payments becomes more widely
available.

Although the share of contactless payments in many countries is still low, the survey
results suggest that the speed with which such payments have been embraced in
some countries may mean that once payment cards and POS terminals are enabled
with contactless technology on a wider scale, the share of contactless payments
could increase significantly. Since contactless payments are typically relatively low
value and 81% of all payments at POS are below €25, this could have a significant
impact on the use of cash for smaller value payments, especially given that
respondents who prefer cash and those who prefer cards both appear to place
importance on the transaction speed of their preferred means of payment.

The study confirms that cash is not only used as a means of payment, but also as a
store of value, with almost a quarter of consumers keeping some cash at home as a
precautionary reserve. It also shows that more people than often thought use high
denomination banknotes; almost 20% of respondents reported having a €200 or
€500 banknote in their possession in the year before the survey was carried out.

ECB Occasional Paper Series No 201 / November 2017                                  5
1   Introduction

    Keeping abreast of the latest cash usage trends is essential for both the Eurosystem
    and the relevant stakeholders of the payment system. National central banks are
    responsible for the issuance of banknotes and often for the distribution of coins in
    their respective countries. They require reliable statistics that allow them to compare
    the development of cash usage in the different countries of the euro area.

    Nevertheless, to date there have been no reliable statistics on the number and value
    of cash transactions and there is limited information on the differences between euro
    area countries regarding the use of cash compared with other means of payment.
    With the increase in card payments and the rise of alternative payment methods, the
    future of cash is under discussion and the relevance of cash in society is being
    challenged.

    However, without knowing exactly how people currently pay, these discussions have
    no solid basis and result in speculation rather than fact-based findings. Often,
    conclusions on payment behaviour in a certain country are drawn based on studies
    available on other countries, without knowing whether people exhibit similar payment
    behaviour in the country concerned. Moreover, data provided by certain retail chains
    or associations of retailers may not give accurate information on payment behaviour
    in general, as payment behaviour differs between market sectors. For example,
    people may pay in different ways depending on whether their purchase is made at a
    large supermarket chain or at a bakery.

    Central banks have a strong interest in having accurate data on cash usage for
    discussions on the role of cash in society, as well as for the development of their
    policies and strategic decisions regarding the cash cycle and the efficiency of the
    payment system as a whole. For example, the costs of cash and counterfeiting
    statistics can be placed in perspective when the actual number of cash transactions
    is known. Furthermore, for the development of certain policies it is important to
    understand the determinants of cash usage, since this can be supply and/or demand
    driven.

    The latest estimates on cash usage in the euro area date from 2008, when the value
    of cash transactions was estimated to amount to between €1,800 and €2,100 billion
    (ECB 2011). This estimate was based on a household survey, payment statistics and
    a company survey. The household survey involved 8,175 respondents from eight
    euro area countries – Belgium, Germany, Spain, France, Italy, Luxembourg, the
    Netherlands and Austria 2 – and was conducted between 18 September and
    31 October 2008 by means of a questionnaire (i.e. no payment diary was used). The
    ECB’s company survey on the use of cash was carried out in 2008 in the same
    countries as the household survey (except Luxembourg) and surveyed a sample of
    3,052 small and medium-sized enterprises (SMEs).

    2
        These eight countries issued 92% of all banknotes in the euro area in 2008. See ECB (2011).

    ECB Occasional Paper Series No 201 / November 2017                                                6
In order to better understand the current developments in cash usage, the
Eurosystem agreed in 2014 to conduct the survey on the use of cash by households
(SUCH) in all euro area countries, except in Germany and the Netherlands, where
the corresponding central banks have been carrying out similar payment diary
surveys since 2008 and 2007, respectively. The latest available survey results from
these countries are from 2014 for Germany and 2016 for the Netherlands. Even
though the methodology used in the SUCH survey is similar to the methodologies
used by the central banks of Germany and the Netherlands, the central banks in
those countries preferred to continue using their own methodology in order to avoid
deviating from their historical results. Nevertheless, to the extent possible, the results
of those countries have been integrated to present the results for the whole euro
area. 3 The ECB’s SUCH survey was conducted from October to November 2015 and
from January to July 2016. It involved 65,281 respondents who kept a diary to write
down all the payments and cash withdrawals or replenishments that they carried out
during the course of a single day. In the specific case of Cyprus and Malta,
respondents used three-day diaries. A total of 128,677 payments were reported. A
subset of 28,099 respondents was also invited to complete a questionnaire in order
to collect information on consumers’ access to payment instruments, their payment
behaviour and to analyse these results together with the reported transactions. The
total number of survey participants for the whole euro area, including Germany and
the Netherlands, was 92,080, reporting a total of 198,600 payments.
This paper reports on the main findings and conclusions of the SUCH survey. It
presents an extensive description of how euro area consumers pay at POS. The aim
of this study is to shed light on consumer payment behaviour in the euro area and in
particular to improve the understanding of cash payment economics based on a
large sample of households and countries. The paper is mainly descriptive in nature,
does not aim to analyse differences in payment behaviour in depth and suggests
opportunities for further research. It is hoped that, together with the unique
underlying data, it will lead to future research on the use of cash and cashless
means of payment.
The paper is organised as follows. Section 2 describes the research method and
sample used and Section 3 describes the validation of the survey results. Section 4
presents the findings related to the use of cash and other payment instruments in the
euro area. Specifically, it analyses the use of cash relative to other payment
instruments in terms of number and value of payments, by transaction amount, and
describes the impact of personal characteristics on consumers’ choice of payment
instrument. Section 5 analyses cash usage by market segment and the use of cash
for recurrent payments. Section 6 describes the use of contactless payments and
Section 7 presents the findings on card ownership and the acceptance of non-cash
instruments. Section 8 is dedicated to the amount of cash euro area consumers
carry in their wallet. Section 9 discusses how consumers obtain their cash and
Section 10 presents the results on the use of cash as a store of value and the use of
3
Each time the euro area results of 19 countries are presented it should be taken into account that the
results for Germany are from 2014 and that this country has a relatively high weight in the overall
results of the euro area. For a more detailed description of the German survey see Bundesbank (2015)
and for the Dutch survey see Jonker, Kosse and Hernandez (2012).
ECB Occasional Paper Series No 201 / November 2017 7high denomination banknotes. Section 11 addresses consumers’ cash withdrawal habits and their satisfaction with ATM services. Section 12 highlights consumers’ payment preferences and other factors which determine consumers’ payment choice. Section 13 concludes. ECB Occasional Paper Series No 201 / November 2017 8
2     Research method and sample

2.1   Research scope and research population
      The purpose of this study is to analyse the number and value of cash payments
      made in the euro area in 2016. In order to examine consumers’ payment behaviour
      and the role played by cash, the study takes into account the use of cards and other
      payment instruments commonly used at POS, including cheques, direct debits, credit
      transfers and mobile payments. The study is limited to euro area residents aged 18
      years and over and excludes payments made by consumers travelling outside of
      their place of residence, as well as payments made by tourists, other non-residents
      and payments between businesses. The study excludes payments carried out by
      respondents who are below 18 years old in all countries except the Netherlands,
      where payments by children from 12 years old were considered. The study includes
      information on payments carried out at POS, as well as those carried out between
      individuals, such as relatives and friends, charity donations or for home services
      (e.g. babysitting) which are referred to as person-to-person payments here.
      Recurrent payments (such as rent and utilities) are excluded from the study, unless
      they were paid at a POS. 4 Internet payments (e.g. online shopping) were recorded in
      the payment diaries but are excluded from the analysis, as the objective of the study
      is to assess the attitudes towards and choice between cash and other payment
      methods; cash is usually not accepted to pay for remote payments. For the same
      reason, person-to-person payments were recorded, but not included in the results on
      the share of cash and non-cash means of payment at POS. 5 It should be noted that
      the remainder of this chapter mainly describes the research method and sample of
      the survey on the use of cash by households carried out by the ECB in 17 euro area
      countries and does not describe the methods used in the German and Dutch study.

2.2   Sample
      The field work was carried out by Kantar Public (Brussels) in three waves from
      October 2015 to July 2016. A total of 65,281 respondents participated in the diary
      survey, reporting 128,677 transactions in the euro area, excluding Germany and the
      Netherlands. The survey was carried out over eight months; 31% of interviews were
      held in 2015 and 69% in 2016 (see Table 1). Over two-thirds of interviews were
      carried out in October, November and February, which are considered to be fairly
      average months with respect to POS payments made by consumers. The total
      sample for the euro area – including data from Germany and the Netherlands – is of
      92,080 respondents, reporting a total of 198,600 payments.

      4
          However, a question on recurrent payments was included in the survey questionnaire answered by a
          subset of respondents.
      5
          With the recent developments in instant payment solutions, the choice to use alternative means of
          payment rather than cash for person-to-person payments is expected to increase. Therefore, in future
          research on these payments may be included in the results.

      ECB Occasional Paper Series No 201 / November 2017                                                         9
Table 1
Distribution of the sample, per month
Year 2015 Year 2016
Country October November December January February May June July Total
AT 2% 27% 3% - 41% 19% 6% 1% 100%
BE 2% 26% 0% - 39% 17% 12% 3% 100%
CY 33% 6% 0% - 61% 0% 0% 0% 100%
EE 3% 23% 7% - 38% 23% 6% 0% 100%
ES 2% 31% 0% - 41% 22% 4% 0% 100%
FI 3% 13% 8% 5% 39% 13% 19% 0% 100%
FR 2% 28% 0% - 38% 31% 1% 0% 100%
GR 2% 33% 0% - 45% 4% 6% 9% 100%
IE 2% 28% 0% - 37% 23% 5% 5% 100%
IT 2% 23% 6% - 42% 14% 7% 5% 100%
LT 3% 22% 8% - 38% 24% 5% 0% 100%
LU 4% 27% 0% - 44% 23% 3% 0% 100%
LV 4% 23% 7% - 38% 15% 2% 11% 100%
MT 21% 24% 0% - 55% 0% 0% 0% 100%
PT 2% 24% 5% - 42% 14% 13% 0% 100%
SI 3% 20% 9% - 37% 9% 6% 17% 100%
SK 3% 22% 5% - 39% 10% 5% 17% 100%
Sample euro area 17 3% 24% 4% 0% 40% 17% 7% 4% 100%
Sources: ECB.
For practical reasons it was not possible to ensure an equal number of interviews in
all countries in each month. Furthermore, owing to the different dates of (public)
holidays in various countries and because the interviews were not held in all months
of the year, there could be some slight differences in the reported payment
behaviour. Moreover, as December was excluded (some interviews were held in the
first few days of December only in some countries), Christmas shopping was largely
excluded from the survey results. For this reason, the exclusion of the larger value
payments typically carried out in December may have an impact on the estimation of
the number and value of payments in the year of the survey.
To ensure the reliability and representativeness of the findings, Kantar Public drew a
sample of the population of each country from its internet panels, based on three
demographic characteristics: gender, age and region of residence. Purposive
sampling was used for the study. This is a non-random selection technique which
aims to achieve a sample that is representative of a defined target population. 6 The
quotas set in each country reflected the census-based population characteristics in
terms of gender, age and region of residence. The population figures used to set the
quotas came from the most up-to-date Eurostat (2011) data available at the time the
study was set up.
6
The most common purposive sampling ensures that a census-balanced sample is drawn to conform to
the overall population statistics. The basic idea is that if a sample is representative of a population for
which some characteristics are known, then the sample will also be representative of other survey
variables.
ECB Occasional Paper Series No 201 / November 2017 10In addition to the internet panels, respondents aged 55 and over were interviewed by
telephone to compensate for the lower probability that those from this age group
would participate in online panels. Furthermore, it was considered that those over 55
without internet access would be less likely to adopt new means of payment than
those with internet access; they may thus have different payment behaviour from
those who have internet access. Given the unavailability of internet panels in Cyprus
and Malta, as well as the relatively low costs, all respondents in these countries were
interviewed face-to-face.
For the purpose of the telephone and face-to-face sample, the basic sample design
applied in the first stage was a multi-stage random (probability) one. As a second
step, respondents from the telephone sample were selected on the basis of age and
everyone under the age of 55 was excluded from this sample. Telephone
respondents who agreed to participate were called again to complete the diary. In
the case of the face-to-face sample, the recruitment process involved choosing
households at random. Quotas were used to make sure that a sufficient number of
respondents across gender, age and region of residence. An important feature of the
survey design was that the overall sample sizes could not be determined in advance
because the aim was to reach a certain number of recorded transactions per country,
even though the average number of transactions per person per day for each
country was unknown. Therefore, during the first wave of the study, a conservative
estimate of an average of 1.35 transactions per person per day and a specific target
for the total number of transactions was set for each country. The initial target was to
reach approximately 10,000 transactions in Belgium, Greece, Spain, France, Italy,
Austria, Portugal and Slovakia and Finland; approximately 7,500 transactions in
Estonia, Ireland, Latvia, Lithuania and Slovenia; and approximately 5,000
transactions in Cyprus, Luxembourg and Malta. The results of the first wave showed
that the number of transactions per person per day was higher than initially
assumed. Therefore the sample sizes of the consecutive waves were recalculated
and resulted in fewer interviews. Given that payment behaviour differs according to
the day of the week, the interviews were distributed as evenly as possible over the
course of the week. 7
Education level categories were created based on the respondent’s age when
finishing full time education: still studying or no fulltime education, up to age 16 (low
level of education, equivalent to secondary education), between 16 and 20 years old
(medium level of education, equivalent to vocational education) and higher than 20
years old (high level of education, equivalent to university education).
7
The distribution of interviews by day of the week does not perfectly match the total number of each
days of the week in the month considered in the survey (e.g. an over-representation of Thursdays over
Saturdays). Therefore, it should be taken into consideration that this could have had an impact on the
estimation of POS payments carried out by households.
ECB Occasional Paper Series No 201 / November 2017 112.3 Research method
Respondents were asked to write down all the payments made during a single day in
all countries, except Cyprus and Malta, where three-day diary books were used.
Respondents were not informed who had authorised the survey, in order to avoid
influencing their behaviour. They were reminded to maintain the same behaviour as
usual and encouraged to participate in the survey regardless of whether they had
made any transactions. The choice of the duration of the diary survey is not unique
to this study; it was set to allow the collection of diary data from telephone interviews
and to minimise diary fatigue as described in Jonker and Kosse (2013). However, for
certain categories of payments, such as occasional high-value payments for
furniture, high-value electronics or cars, or for certain places of payment, such as
hotels, one-day diaries have some shortcomings, as these payments may be under-
recorded to some extent. These categories of payments and places of payment are
typically characterised by higher card use. Because of their low frequency, they have
limited influence on the number of payments, but may have some influence on the
average value of payments and the value of card payments.
The study was structured in two parts: the payment diary and a survey
questionnaire. All 65,281 respondents of the survey completed the payment diary,
while a subset of 28,099 respondents also completed the questionnaire. 8
The payment diary collected the relevant characteristics of all transactions, as well
as cash withdrawals carried out by respondents during one single day. The data
included information about the transaction value, the place of purchase (13 place
categories, e.g. shop for day-to-day items, shop for durable goods, online shop,
restaurants), the instrument of payment chosen (nine instrument categories) 9, the
amount of cash carried at the beginning of the survey day and the perceived
acceptance of non-cash instruments in each place of purchase where a payment
was made in cash. Data on cash withdrawals included information on the source of
withdrawal (ATM, bank counter, cashback or other) and the value of withdrawals.
Moreover, the data included information on the demographic characteristics of each
diary respondent, such as gender, age and region of residence, along with
information on education level, occupation, household size, frequency of internet use
and family net income. The diary survey questions can be found in Annex B.
The survey questionnaire collected information on attitudes that may influence
respondents’ payment behaviour, such as payment preference, perceived
convenience of particular payment instruments, perceived payment and withdrawal
behaviour and information on consumers’ views on different cash policies. Moreover,
the questionnaire collected data on respondents’ access to non-cash payment
instruments, the use of cash for recurrent payments and information on the use of
cash as a store of value.
8
Results from all 19 euro area countries are based on the answers of 92,080 respondents who
participated in the diary survey and a subset of 32,907 respondents who completed the questionnaire.
9
The focus of this study is on the use of cash, cards (debit, credit or contactless) and other instruments
used at POS, including cheques, direct debits, credit transfers and mobile payments, among others.
For a detailed definition of each payment instrument, see Annex A.
ECB Occasional Paper Series No 201 / November 2017 12Box 1
Payment diary surveys in Germany and the Netherlands
Payment diary surveys in Germany and the Netherlands have been carried out since 2008 and
2007, respectively. In both cases, the surveys consist of a diary and a questionnaire. In the case of
Germany, a seven-day diary was used. The latest diary survey was carried out between May and
July 2014 among 2,016 respondents who reported 19,823 transactions.
In the Netherlands, a one-day diary was used. The latest survey was conducted throughout 2016,
with an equal number of respondents per month. A total of 24,783 respondents participated in the
survey and reported 50,452 transactions.
2.4 Recruitment of respondents and data collection
For the ECB survey, a combination of web-based, telephone and face-to-face based
methods were used for recruiting respondents and for collecting the questionnaire
answers (see Table 2). The majority of the interviews were carried out online
(54,377). There were 8,996 interviews conducted by telephone and 1,908 via face-
to-face interviews. Table 2 presents the number of interviews conducted by month
and interview mode.
Online respondents were recruited to participate in the study two days before the
actual interview took place. 10 During first contact, when respondents were asked to
take part in the study, they were asked to record their payments for the following day,
keeping track of all their transactions. Once they had agreed to take part,
respondents were allowed a day in which to record all their transactions and were
called to collect the information the next day. For example, respondents who were
contacted on Monday were asked to record their transactions for Tuesday and were
then contacted to complete the interview on Wednesday. They were allowed a
48-hour window from the time the link was sent to them to complete the survey. For
the telephone and face-to-face 11 modes, the interview took place within two days of
the day on which the transactions were recorded. For example, respondents
contacted on Monday who recorded their transactions on Tuesday would be
interviewed on Wednesday or Thursday.
10
Online respondents were sent invitations by email, along with the instructions for pre-recruitment.
11
During the face-to-face interview, respondents were informed of the main objectives of the survey and
were read the pre-recruitment instructions. Once potential respondents had agreed to participate in the
study, they were given the printed three-day diary and asked to complete it each day. After the three-
day period, they were contacted by the research company by telephone, which recorded all
transactions.
ECB Occasional Paper Series No 201 / November 2017 13Table 2
Distribution of interviews by month and interview mode
Month Face-to-face Online Telephone Total
2015
October 518 0 1,669 2,187
November 278 15,543 0 15,821
December 0 2,532 0 2,532
2016
January 0 232 0 232
February 1,112 17,949 7,327 26,388
May 0 10,933 0 10,933
June 0 4,291 0 4,291
July 0 2,897 0 2,897
Source: ECB.
2.5 Translation of survey material
The translation of all survey material was a crucial aspect in the study. Kantar Public
was responsible for the whole translation process and used its own translation
department to deliver the required quality. Once ready, the translated material was
sent to the ECB, which sent it to its own translation department, as well as to a group
of national central bank experts who served as advisers during the whole process of
the study. An additional check of most translations was carried out by ECB staff from
the countries involved in the study. During the translation process, emphasis was put
on the use of terms that would be easily understood by the public. For example,
“debit card” could not always be translated literally, as in many countries another
term is used.
2.6 Weighting and adjustments
Given that the sample was not perfectly representative, sample weights were
needed to correct the sampling bias inherent to online panels and purposive
sampling. 12 The key variables used for the post-stratification adjustment were
gender, age and region of residence. A further factor used in the adjustment of
respondents aged 55 and over who were interviewed by telephone was the
frequency of internet usage. This was used as a fourth weighting variable, nested
12
All non-probability online panels have inherent and significant coverage errors, as even a relatively
large national panel of one million members would only have about 2% of adult internet users enrolled
at any given time (in France, for example). Another part of the bias comes from the fact that the
response rate of non-probability online panels is not accurately known. DiSogra and Callegaro (2009)
point out that there are currently no widely accepted metrics that can be used to accurately quantify or
otherwise characterise the non-response that occurs at the recruitment stage of non-probability online
panels. This is because the base (denominator) against which the number of people who joined the
panel (numerator) can be compared is often unknown.
ECB Occasional Paper Series No 201 / November 2017 14under age. The external information source was the most recent Eurobarometer
survey containing the information available when the weighting targets were set.
The sample population was segmented into two groups:
• respondents aged 55 and over who were interviewed online and those in this
age cohort interviewed by telephone who said they used the internet frequently
(at least once a week);
• respondents aged 55 and over who are not frequent internet users (those who
use the internet two or three times a month, less often, or never and those with
no internet access).
The Eurobarometer survey shows that in all euro area countries, except in
Luxembourg, the Netherlands and Finland, people aged 55 and over use the internet
much less than those in the younger age cohorts. In Luxemburg, the Netherlands
and Finland, they have an internet use pattern similar to the younger age cohorts.
ECB Occasional Paper Series No 201 / November 2017 153 Validation
In order to check whether the results from the survey were reasonable, an extensive
validation of the data was carried out. For most countries, no alternative sources of
information that could be used to validate the survey results were available, such as
existing studies on retail payments or data from retail associations. The only country
with an available recent payment study was Portugal, which was carried out by the
Banco de Portugal. However, the scope of this study was different; it included not
only POS payments, but all payments made by individuals. 13 Furthermore, the
Oesterreichische Nationalbank (2017) carried out a study on payment behaviour by
households in 2015. The set-up was nearly the same as that of the SUCH, but
instead of one-day diaries, three-day diaries were used. The results of the
Oesterreichische Nationalbank study and the SUCH study appear to be very similar.
The only source available for all countries at the time of data validation was euro
area payment statistics 14 in the ECB’s Statistical Data Warehouse (SDW), with data
from 2015. Two main items of payment statistics were used from the SDW: i) the
value of cash withdrawals, in order to validate the estimated value of cash payments;
and ii) statistics on domestic card payments initiated at the POS, 15 in order to
validate the estimated number and value of card payments resulting from the survey.
The euro area payment statistics do not report domestic card payments split by debit
and credit card payments. For this reason, card payments have been validated as a
whole. The validation of the German survey results has been excluded, as they refer
to 2014 and have already been published.
When looking at the SDW data on cash withdrawals it should be considered that not
all cash withdrawals are used for payments. A proportion of withdrawn cash is used
by retailers as change and some cash is kept at home as a reserve. In addition,
some of the cash withdrawn leaves the country and is spent abroad when
consumers travel. The estimated value of cash payments resulting from the study
equals roughly 93% of cash withdrawals in the SDW.16 Therefore, the estimated
value of cash payments from the survey is, in general, a good indication of the actual
use of cash at POS. 17
13
In September 2015 the Banco de Portugal published its study “Use of instruments of payment in
Portugal” based on one and three-day diary book data among respondents aged 18 to 74 years old, as
well as person-to-person payments and other non-POS payments. However, it should be noted that the
SUCH results include respondents aged 74 and over and focus on POS payments only.
14
These datasets are mainly collected on an annual basis according to Regulation ECB/2013/43
(regulation on payment statistics).
15
Using data on cards issued by resident payment service providers.
16
Excluding over-the-counter cash withdrawals from Luxemburg, Malta and Austria, which are not
available in the SDW, and excluding cashback at retailers, available in some countries.
17
The estimated value of cash usage for Ireland, Italy and Lithuania is higher than the value of cash
withdrawals reported in the SDW. Differences could be the result of variation in reporting
methodologies and data quality issues. Moreover, in all these countries cashback is offered at retailers.
In the case of Lithuania, the fieldwork of the SUCH coincided with the year of the adoption of the euro.
This brought changes in the reporting of statistics, as well as temporary changes in how consumers
use their money.
ECB Occasional Paper Series No 201 / November 2017 16The validation of card payments shows that the survey results are, at euro area level and for the majority of the euro area countries, roughly in line with card payment data from the SDW. When comparing SDW data with the SUCH results, it should be considered that the characteristics of card payment data from the SDW do not fully match the characteristics of the survey data. The SDW includes card transactions made by persons under 18 years old and businesses, while the SUCH data only contain card payments from households and those aged 18 years and over. Moreover, the survey was conducted during only a few months of the year, and mostly excludes December. Since the number and value of transactions is higher in this month than the yearly average, and higher value payments are more frequently made by card, this may have led to an underestimation of the total value of card payments by extrapolating the SUCH results to the whole year. In addition, respondents may not have been able to distinguish between debit and credit cards and certain special-purpose cards, such as public transport cards or canteen cards, which are not recorded in the SDW as card payments. Furthermore, in some countries, such as Greece and Italy, there are still a considerable number of people below the age of 55 without internet access or who do not use the internet frequently. Thus, internet panels used in these countries do not include this part of the population. Since people with internet access are more likely to adopt new means of payment more quickly, card use in these countries may be overestimated in the SUCH results, to some extent. Finally, because of the introduction of capital controls in Greece in 2015 and the introduction of the euro in Lithuania in that same year, it is difficult to compare the relevant payment statistics data with the survey results. However, it seems that these explanations do not fully explain the relatively large differences between the SUCH results and the SDW data for some countries, in particular for France, Italy, Slovakia and Finland in terms of the number of card transactions, and for France, Ireland, Portugal and Finland in terms of the value of card transactions. Chapter 4 describes the effect of using card data from the payment statistics in the SDW instead of the survey results for these countries. As shown, the resulting difference in the use of cash by applying the card data from the SDW is limited for most countries, especially if the differences in data characteristics between the SDW and the SUCH are taken into account. As an additional data quality check, a margin of error for the estimated number and value of card payments was calculated. Results showed that the estimated card payments from the SUCH moved within a narrow margin of error. Considering that survey results never provide a perfect representation of reality, and that the SDW may also have shortcomings and limitations, it can be concluded that the SUCH results are representative for the payment behaviour of euro area consumers of those aged 18 and over at the point of sale. ECB Occasional Paper Series No 201 / November 2017 17
4     Cash usage in the euro area

4.1   Relative use of payment instruments
      In 2016 euro area consumers made 163 billion payments by means of cash,
      payment cards or other payment instruments, amounting to more than €2,968 billion
      (see Table 3). 18 The large majority of these payments were made in shops for day-to-
      day items, restaurants and petrol stations, as well as at street merchants and shops
      for durable goods. These payments are referred to as POS and account for 96% of
      all payments. The remaining 4% refers to payments between individuals, such as in-
      home services and giving money to relatives, friends, churches or other charity
      organisations.

      Table 3
      Number and value of payments in the euro area in 2016
               Payment instrument                  Number (billion transactions)               Value (billion EUR)        Average value

       Cash                                                      129                                 € 1,653                   € 12.8

           POS                                                   124                                 € 1,530                   € 12.4

           P2P                                                    6                                   € 123                    € 21.1

       Cards                                                      30                                 € 1,110                   € 36.9

       Other                                                      3                                   € 205                    € 61.9

       Total payments                                            163                                 € 2,968                   € 18.2

           POS                                                   157                                 € 2,845                   € 18.1

      Source: ECB.
      Notes: Online payments are not included in Table 3. Based on the diary survey results, the value of online payments in the euro area
      in 2016 amounted to €144 billion. The latter estimation excludes German results, owing to a lack of data availability, as well as
      standing orders for online recurrent payments, such as the monthly fee for an online music and entertainment service. The “Other”
      category includes payment instruments, such as cheques, direct debits, credit transfers, mobile payments or other instruments used
      by households at POS. Due to their low frequency of use, these instruments have been grouped in a single category.

      To pay for their POS purchases, euro area consumers made 124 billion cash
      payments, 30 billion card payments and 3 billion payments by means of other
      instruments, such as cheques, direct debit, credit transfers and mobile payments.
      Although cash was mainly used for low-value purchases, it was used four times
      more often than debit or credit cards, bringing the total value of cash payments
      above that of all card payments.

      Survey results show that cash was dominant at the POS. In terms of number of
      transactions, 78.8% of purchases at the POS were paid using cash, 19.1% using
      cards and the remaining 2.1% was paid using various other payment instruments
      (see Chart 1). In terms of value, cash payments accounted for 53.8% of all POS
      payments, cards for 39% and other means of payment accounted for the remaining
      7.2%.

      18
           Survey results extrapolated to a year for the total euro area population of 18 years and over (12 years
           and over in the case of the Netherlands).

      ECB Occasional Paper Series No 201 / November 2017                                                                                18
Chart 1
Market share of payment instruments at points of sale
cash
cards
other
Number 78.8% 19.1% 2.1%
Value 53.8% 39.0% 7.2%
0% 10% 20% 30% 40% 50% 60% 70% 80% 90% 100%
Sources: ECB, Deutsche Bundesbank and De Nederlandsche Bank.
Notes: Euro area results, adjusted for country size.
Comparing the use of cash per country, it can be concluded that cash was used
most in southern euro area countries, as well as in Germany, 19 Austria and Slovenia
(resulting in country shares of 80% or above for all POS transactions; see Chart 2).
The market share of cash was lower in Latvia, Lithuania, Slovakia and Ireland,
ranging from 71% to 79%. Belgium, Luxembourg and France follow with a cash
share ranging between 63% and 68%. The Netherlands, Estonia and Finland had
the lowest shares, ranging between 45% and 54% of all payments at POS. 20
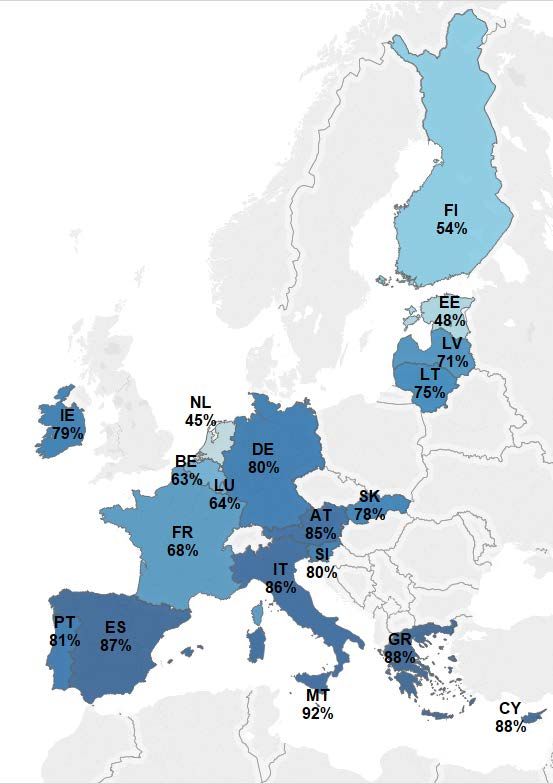
In terms of value of payments made at POS, in all countries the share of cash was
much lower than in terms of number of payments. In Cyprus, Malta and Greece the
share of cash in value of payments was the highest, ranging from 72% to 75%. In
Lithuania, Slovakia, Austria, Spain, Italy and Slovenia the share ranged from 62% to
68%. In Ireland, Portugal, Latvia and Germany the share of cash in value of
19
It should be noted that the results for Germany are included separately and are taken from the
Deutsche Bundesbank’s 2014 cash payment survey. Taking into account the trends in Germany, it can
be expected that the share of cash payments in Germany in 2016 was slightly lower than in 2014.
Consequently, given the high weight of Germany in the overall results for the euro area, the overall
share of cash in number and value in the euro area may be marginally lower in 2016. It should also be
noted that some of the figures published in this paper differ slightly from those published by the
Deutsche Bundesbank in 2014. This paper presents figures on the use of payment instruments at POS,
while the Deutsche Bundesbank’s report presents figures for all payments, including person-to-person
and internet payments. As a result and as presented in Charts 2 and 3, the share of cash usage in this
paper is 79.8% in terms of number and 54.6% in terms of value, while those published by the Deutsche
Bundesbank in 2014 are 79.1% and 53.2% in terms of number and value of payments, respectively.
20
As explained in Chapter 3, for some countries the survey results on card data deviate markedly from
the card statistics in the SDW. Using the card data from the SDW instead of the survey results (noting
all the caveats described in Chapter 3) would result in the following shares of cash payments in terms
of number of total payments at POS: France 63%, Italy 91%, Slovakia 86% and Finland 42%, while the
share of cash at POS for the euro area as a whole would remain at 79%.
ECB Occasional Paper Series No 201 / November 2017 19payments was between 49% and 55%, while in the Benelux countries, France,
Estonia and Finland the share ranged from 27% to 33%. 21
Chart 2 Chart 3
Share of cash transactions per country at points of sale Share of cash transactions per country at points of sale
(number of transactions) (value of transactions)
Sources: ECB, Deutsche Bundesbank and De Nederlandsche Bank. Sources: ECB, Deutsche Bundesbank and De Nederlandsche Bank.
4.2 Average value of transactions
The different shares of cash in the total number and value of transactions at POS are
also reflected in the average value of a cash transaction to some extent. On average
in the euro area, the value of a cash transaction was €12.38. In terms of value of
transactions, the average value of a cash transaction was the highest in Cyprus,
Luxembourg and Austria where it ranged from €18.60 to €17.80 (see Chart 4a). This
suggests that consumers in these countries use cash not only to pay low amounts
but also relatively higher amounts. In contrast, the average cash transaction value
was the lowest (below €10) in Spain, Latvia, France and Portugal where it ranged
21
As described in Chapter 3, also in terms of value the survey results deviate markedly from the card
statistics in the SDW for some countries. Using the card data from the SDW instead of the survey
results (noting all the caveats described in Chapter 3) would result in the following shares of the value
of cash payments in total payments at POS: Ireland 41%, France 23%, Portugal 34% and Finland 23%.
Applying the whole euro area 2015 SDW card data instead of the SUCH results, the share of cash in
value of POS transactions would be 50%.
ECB Occasional Paper Series No 201 / November 2017 20between €8.80 and €7.50, indicating that in these countries cash is mainly used for
small payments.
Chart 4
Average value of a transaction at points of sale
average value cash average value cards
a) cash b) cards
€ 20 € 80
€ 18
€ 70
€ 16
€ 60
€ 14
€ 50
€ 12
€ 10 € 40
€8
€ 30
€6
€ 20
€4
€ 10
€2
€0 €0
CY LU AT DE IE GR MT SI IT NL FI euro BE LT SK EE ES LV FR PT LU MT DE CY AT BE FR IT euro GR IE PT ES FI NL SI LT SK EE LV
area area
average value other
c) other payment instrument
€ 400
€ 350
€ 300
€ 250
€ 200
€ 150
€ 100
€ 50
€0
IE CY LU MT AT EE GR DE FR euro BE FI IT LT PT LV SK SI ES NL
area
Sources: ECB, Deutsche Bundesbank and De Nederlandsche Bank.
Notes: The “other” category includes instruments such as cheques, direct debits and credit transfers.
The average card transaction value was the highest in Luxembourg, Malta and
Germany, where it ranged from €70.78 to €51.38 (see Chart 4b). In contrast, the
average card transaction value in the euro area was the lowest in Slovakia, Estonia
and Latvia where it ranged from €16.05 to €14.33, indicating that consumers in these
countries use cards for relatively low-value payments.
Diary results suggest that cheques or credit transfers and direct debits are commonly
used to pay for larger amounts, such as at hotels, certain service providers or at
public authority offices. The average transaction value of these kinds of payments
were therefore higher than those of cash and cards, the highest being in Ireland,
Cyprus and Luxembourg, where they ranged from €387 to €130 (see Chart 4c).
ECB Occasional Paper Series No 201 / November 2017 214.3 Average number of transactions per person per day
In 2016 euro area consumers made 1.6 payments per day on average, which equals
nearly 11 payments per week (see Chart 5). They used cash more frequently than
other payment instruments, making on average 1.2 cash payments per day, i.e.
almost nine per week. The second most frequently used payment methods were
payment cards, which consumers used on average 0.3 times per day, i.e. 2.1 times
per week. However, these are euro area averages, since payment behaviour varied
from country to country. Italy, Spain and Greece were the countries where
consumers made the highest number of cash payments per day, with 1.7
transactions per day, i.e. nearly 12 per week. On the other hand, consumers in the
Netherlands, Luxembourg, Finland and Estonia made the highest number of card
payments per person per day, with 0.8, 0.6 and 0.5 payments per day, respectively.
This is equal to 5.3, 4.1 and 3.8 payments per week, respectively.
Chart 5
Average number of transactions per person per day, by instrument of payment
cash
cards
other
1.8 1.7 1.7
1.6
1.6 1.5
1.4 1.4 1.4 1.3 1.3
1.4 1.3 1.2
1.2
1.2 1.1
1.0 1.0
1.0 0.9
0.8
0.8
0.8 0.7
0.6 0.6
0.5 0.5 0.5
0.6
0.4
0.3 0.3 0.4 0.4
0.4 0.3 0.3 0.3
0.3 0.3
0.2 0.2 0.2 0.2 0.2
0.2 0.1
0.0
IT ES GR MT CY PT AT IE SK SI euro LU LT LV DE FR BE FI NL EE
area
Source: Authors’ calculation based on ECB, Deutsche Bundesbank and De Nederlandsche Bank data.
In 2016 the Netherlands was the only euro area country where consumers used
payment cards more often than cash. They carried out 55% of all transactions using
a payment card, while in Estonia consumers carried out an equal number of
transactions by cash and card, on average.
4.4 Payment behaviour by demographic characteristics
Payment behaviour differs not only by country, but also from person to person. In line
with the literature on payments (see Whitesell, 1989; Boeschoten, 1998; Von
Kalckreuth et al. 2009, Stavins, 2011), the survey results show that consumer
characteristics, such as gender, age and level of education, appear to influence the
choice for a particular payment instrument at POS. Chart 6 shows that male
consumers aged between 40 and 64 and those with a high level of education carried
out a larger number of daily payments than their counterparts. On average, they
made between 1.6 and 1.8 payments each day at the POS using cash, cards or
ECB Occasional Paper Series No 201 / November 2017 22other payment instruments, which corresponds to between 11 and 13 payments per
week. In contrast, the number of daily payments was lower among women, young
people and those who are still studying. These consumers made, on average,
between 1.3 and 1.6 payments each day, corresponding to between 9 and 10
payments per week.
Chart 6
Average number of POS payments per person per day
POS payments per person per day
2.0
1.8
1.8 1.6 1.6 1.6 1.6
1.6 1.6
1.5 1.5
1.6 1.5 1.5
1.4 1.3
1.2
1.0
0.8
0.6
0.4
0.2
0.0
still studying
male
65+
high
low
18-24
25-39
40-54
55-64
female
medium
no educ /
average gender age education
Source: Authors’ calculation based on ECB, Deutsche Bundesbank and De Nederlandsche Bank.
A similar phenomenon can be observed when analysing the demographic
characteristics of cash users (see Chart 7). On average, euro area consumers made
1.2 cash payments per day, i.e. 8.4 per week. However, this varied by gender and
age. Men and consumers aged between 40 and 64 were more likely to use cash.
Younger consumers aged between 18 and 39 carried out fewer cash payments,
namely from 1.1 to 1.3 daily payments respectively. When looking at the results by
level of education, cash usage appears to be relatively homogenous among
consumers with a low, medium or high education level.
The use of payment cards also tends to be relatively homogenous among women
and men, as well as consumers aged over 25. However, results show that young
people (18 to 24 years old) and those with a low level of education used payment
cards the least (see Chart 8). 22 They made on average 0.24 and 0.22 card payments
per day respectively (i.e. around 1.6 per week), in contrast with the rest of the
population, which made on average 0.3 payments per person per day (i.e. around
2.1 per week).
22
It should be taken into account that young people (18-24 years old) carried out the lowest number of
payments per person per day, compared with the payment behaviour of consumers in older age groups
(see Chart 6).
ECB Occasional Paper Series No 201 / November 2017 23Chart 7 Chart 8
Average number of cash payments at POS Average number of card payments at POS
(per person per day) (per person per day)
cash payments per person per day cards payments per person per day
1.6 0.40 0.37
1.4 0.33
1.4 1.3 1.3 1.3 1.3 1.3 1.3 0.35
1.2 0.30
1.2 1.2 1.1 0.29 0.29
1.2 0.30 0.26 0.27 0.26 0.27 0.27
1.0
0.24
1.0 0.25 0.22
0.8 0.20
0.6 0.15
0.4 0.10
0.2 0.05
0.0 0.00
still studying
male
65+
still studying
high
male
65+
high
low
18-24
25-39
40-54
55-64
low
18-24
25-39
40-54
55-64
female
medium
female
medium
no educ /
no educ /
average gender age education average gender age education
Source: Authors’ calculation based on ECB, Deutsche Bundesbank and De Source: Authors’ calculation based on ECB, Deutsche Bundesbank and De
Nederlandsche Bank data. Nederlandsche Bank data.
4.5 Use of payment instruments by value range
On a daily basis, consumers spent on average €18 every time they made a payment
at POS using cash, cards or other means instruments. Most POS payments carried
out by consumers involved lower transaction values; over a third of payments were
lower than €5, and 65% were lower than €15. Conversely, only two in over 100
payments were worth more than €100.
In line with the literature (see Whitesell, 1989; Boeschoten, 1998; Klee, 2008; Von
Kalckreuth et al., 2014 and Arango et. al 2017), consumers’ instrument of choice is
strongly influenced by the payment amount; cash is mainly used for low-value
payments while cards are used for larger-value payments. This is confirmed by the
survey results. Indeed, although absolute levels differed between countries, within
each country the average value of a cash transaction was lower than the average
value of a card transaction. Looking at the way consumers paid according to
payment instrument and amount, cash was the instrument of choice for purchases
under €45. These purchases accounted for 91% of all POS payments. Cards, on the
other hand, were the most frequently used payment instrument for purchases above
€45, which accounted for 9% of all POS payments. As can be expected, the higher
the amount to be paid at the POS, the more likely it is that a consumer pays by card
(see Chart 9).
ECB Occasional Paper Series No 201 / November 2017 24Chart 9
Use of payment instruments at POS, by value range
(number of transactions)
% from total POS cash credit transfer
debit card direct debit
credit card internet
contactless card other
cheque
< €5 34% 93% 4% 1%
€5 to €9.99 19% 86% 8% 4%
€10 to €14.99 13% 79% 13% 6%
€15 to €19.99 8% 71% 17% 9%
€20 to €24.99 7% 67% 20% 11%
€25 to €29.99 3% 57% 26% 13%
€30 to €34.99 3% 54% 29% 12%
€35 to €39.99 2% 51% 30% 16%
€40 to €44.99 2% 50% 31% 16%
€45 to €49.99 1% 44% 31% 20%
€50 to €99.99 6% 39% 36% 20% 2%
> €100 2% 32% 35% 21% 4% 4%
0% 10% 20% 30% 40% 50% 60% 70% 80% 90% 100%
Sources: ECB, Deutsche Bundesbank and De Nederlandsche Bank.
Looking more closely at the payment amounts above €100, it is interesting to note
that the use of cash remained relatively high. Almost a third of POS transactions with
a value above €100 were paid with cash. However, it should be noted that the
number of payments above €100 was relatively small; only 2% of recorded payments
were above €100. For this reason, no reliable breakdown of the use of various
payment instruments for value ranges above €100 can be provided.
Although the share of cash payments above €100 was small, in terms of value they
amounted to 10% of the value of all cash payments at the POS in the euro area. The
share of cash payments above €100 in the total value of cash payments at the POS
was wide-ranging, from 3% in France or 5% in Belgium, to 21% in Ireland and
Slovenia or 26% in Greece.
ECB Occasional Paper Series No 201 / November 2017 25You can also read