Office Space hungry tenants drive soaring rental growth in Downtown Vancouver and Toronto - JLL
←
→
Page content transcription
If your browser does not render page correctly, please read the page content below

Office

Canada | Q1 2018

Space hungry tenants drive
soaring rental growth in
Downtown Vancouver and
Toronto
JLL Research

Office Outlook | Canada | 2018

Contents

Key trends                              3
State of the Market                     4
Office Clocks                           6
Local Markets                           7
        Downtown Toronto                8
        Suburban Toronto West            9
        Suburban Toronto North & East   10
        Ottawa                          11
        Montreal                        12
        Montreal (French)               13
        Edmonton                        14
        Downtown Calgary                15
        Suburban Calgary                16
        Vancouver                       17
Office Outlook | Canada | 2018

                        3            key trends

Rising rents in Vancouver and Toronto
Landlords respond to the extremely tight market conditions in downtown
Vancouver and Toronto by increasing rental rates

The next wave of developments underway
Vancouver, Toronto and Montreal are all well into a new development cycle
that over the next five years will add over 10 million square feet

Bottoming market conditions in Alberta
The speed of negative absorption has slowed in Calgary and Edmonton
but a recovery will take time considering the historically high vacancy in
both markets
4                                                                                                   Office Outlook | Canada | 2017

After a red-hot 2017, the Canadian office market saw a         were created in March, all full-time employment. Further,
slight contraction in market fundamentals in the first three   the latest Business Survey Outlook (Spring 2018) from the
months of the year. Nationally, the office market recorded     Bank of Canada (BoC) indicate that intentions to increase
134,943 square feet of negative net absorption in the first    employment over the next 12 months are widespread
quarter, well below the five year quarterly average of         across regions and most sectors, particularly in services,
219,524 square feet. On a more promising note, both            which bodes well for office markets.
Vancouver (291,521 s.f.) and Toronto (707,856 s.f.) saw its
positive momentum carry into 2018 with positive net
                                                               Canada Unemployment rate (%)
absorption in the first quarter although it was not enough
to offset negative net absorption in Calgary, Ottawa and          7.5%
Montreal. As a result the overall office vacancy rate
increased 20 basis points from the previous quarter to
                                                                  7.0%
reach 12.1 percent with the largest vacancy rate increases
seen in Calgary and Ottawa.
                                                                  6.5%
    Net absorption across office markets
                                                                  6.0%
                                  Q1 2018 net absorption
    Market                                                        5.5%
                                                    (s.f.)
    Vancouver                                      291,521        5.0%
    Downtown Class A                                55,589                 Q1 Q2 Q3 Q4 Q1 Q2 Q3 Q4 Q1
                                                                          2016 2016 2016 2016 2017 2017 2017 2017 2018
    Calgary                                       -511,399
    Downtown Class A                               -30,754
                                                               Leasing activity slows
    Edmonton                                        25,614     Leasing activity slowed noticeably in the first quarter with
                                                               only 1.8 million square feet (leases signed >20,000 s.f.)
    Downtown Class A                                -9,806     completed, down from 4.4 million square feet the same
                                                               time last year. Over 70 percent of transactions took place in
    Toronto                                        707,856     Vancouver and Toronto where demand seems to have no
                                                               end. However, the limited amount of available office space,
    Downtown Class A                               519,717
                                                               particularly in the downtown markets, is making it
    Ottawa                                        -164,330     increasingly difficult for tenants to find space that fits their
                                                               needs which in turn is keeping leasing volumes down. In
    Downtown Class A                               -98,716     response, we continue to see a trend toward renewals. In
                                                               Toronto 37.0 percent of leases signed in Q1 2018 were
    Montreal                                      -484,205     renewals, up from 16.7 percent in the previous quarter.
    Downtown Class A                              -201,281
                                                               From an industry standpoint 27.7 percent of leases signed
    Canada (all classes)                          -134,943     were in the Financial Services sector including EY which is
                                                               relocating to 1133 Melville in downtown Vancouver when
     Downtown Class A                              234,749     the tower is completed in 2022. Other significant
                                                               transactions include Ivari which renewed at 5000 Yonge
                                                               Street and SAP who is consolidating several suburban
From an employment standpoint 2018 started the year            offices to 222 Bay Street, former EY space, in Downtown
strong. The latest job numbers from Statistics Canada          Toronto.
show a continuation of the historically low unemployment
rate, currently at 5.8 percent, after 32,300 net new jobs
5                                                                                                  Office Outlook | Canada | 2018

Construction is still well below peak but booming in             Positive momentum to carry into 2018
key markets                                                      The outlook remains positive although regional variations
No significant office projects were completed in the first       will persist. In downtown Toronto and Vancouver a period
quarter, however on the new construction front the first         of limited new supply (no large construction completions
quarter did not disappoint demonstrating that the new            until 2020) coupled with historically low vacancy rates
development cycle is in full swing across several markets.       means both markets will remain firmly in landlord
In Montreal, Broccolini and National Bank announced their        favourable territory. Edmonton and Calgary, on the other
proposal to build the tallest office tower in the city in over   hand, will edge closer to the bottom of the cycle and we
25 years. The 1 million square feet (36 floors) building will    expect both markets to remain tenant favourable for a
serve as National Bank’s new headquarter when                    longer period. Montreal, which started the year off with
completed in 2022. And, to the west in Vancouver, hot on         almost half a million square feet of negative net
the heels of 753 Seymour, 601 West Hastings and 320              absorption, is undergoing a number of large infrastructure
Granville began construction. We expect to see 1133              upgrades which are expected to lead to increased demand
Melville and 400 West Georgia join the race in the coming        although considering the high number of vacant space,
months. Nationally we are currently tracking 11.9 million        rental rates are expected to remain stable in the short
square feet under construction of which 75.1 percent in in       term.
downtown markets.

    Share of construction across office markets

       Toronto

                                  6.1%
                              3.6%
       Montreal

                      20.6%
                                                     47.5%
       Vancouver

       Calgary              22.1%

       Edmonton

Strong rental growth in Vancouver and Toronto
Overall net asking rental rates settled at $17.16 per square
foot, down 0.4 percent from the previous quarter while the
downtown Class A rent dropped 3.4 percent. We continue
to see rental rates in Calgary and Edmonton deteriorate,
albeit at a slower pace than earlier in the cycle. Rental
rates in Toronto and Vancouver, on the other hand,
continue to rise with the downtown Class A asking net rate
in Toronto increasing 1.4 percent quarter-over-quarter.
6                                                                         Office Outlook | Canada | 2018

Office clock

Reading the clock

JLL’s office clock demonstrates where each market sits
within its real estate cycle. Markets generally move
clockwise around the clock. Geographies on the left side of
the clock are generally landlord-favourable, while markets
on the right side of the clock are typically tenant-
favourable.

                                      Peaking                 Falling
                                        phase                 phase

Toronto

                                         Rising               Bottoming
                                         phase                phase
                                                                              Calgary, Edmonton

                                                                              Halifax, Winnipeg
      Montreal
                                                                              Quebec city
                                                                              Ottawa

Source: JLL Research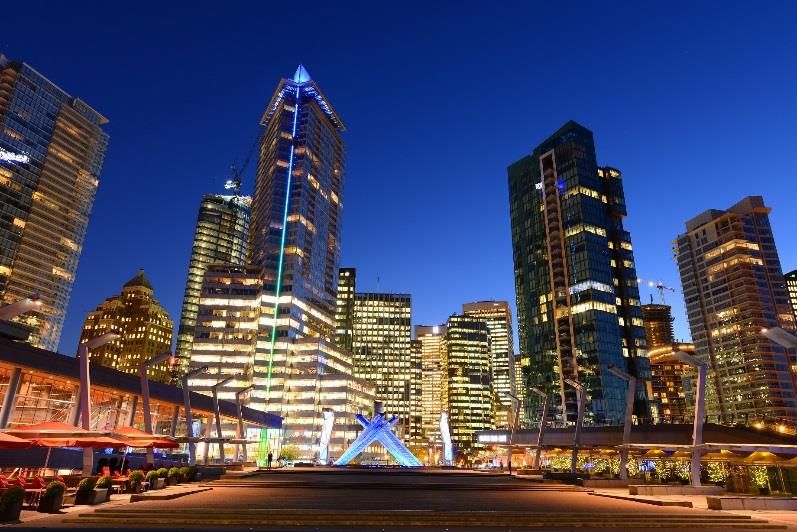
Local markets
7

Downtown
                                                                                                                                 Toronto
Downtown Toronto feels the squeeze – vacancy
continues to decrease while rent growth accelerates
                                                                                                                                   Fundamentals                                     Forecast
  • Time to roll up those sleeves! Unemployment fell 20 basis points to 5.8
                                                                                                                                   YTD net absorption                          371,392 s.f. ▲
    percent, dipping under the city’s record low of 6.0 percent.
  • Total vacancy dropped for the fourth consecutive quarter, currently                                                            Under construction                      4,534,314 s.f.     ▲
    down to 4.4 percent.                                                                                                           Total vacancy                                      4.4%    ▼
  • Got money to burn? Average gross rents downtown have jumped 2.7                                                                Average asking rent (gross) $55.77 p.s.f.                  ▲
    percent quarter-over-quarter after already rising 10.0 percent in 2017!                                                        Concessions                                      Falling   ▼
Toronto’s economy is showing few signs of slowing as the job market absorbs
                                                                                                                                   Supply and demand (s.f.)                      Net absorption
more and more workers. 5,100 full-time jobs were added to the market in the                                                                                                      Deliveries
past three months, pushing the unemployment rate down to 5.8 percent, a                                                            3,000,000
new record low for the city! Business, building, and other support services
were the largest contributing industry, adding 8,800 jobs to the sector.                                                           2,000,000
Healthcare and educational services were also strong leaders this quarter,
adding a collective 8,000 jobs.                                                                                                    1,000,000

Accordingly, the downtown office market has tightened even further under                                                                    0
the demand. The market recorded a net absorption of 371,391 square feet this                                                                        2015        2016         2017      Q1 2018
quarter and vacancy dropped 20 basis points to 4.4 percent. This was
overwhelmingly driven by demand for class A office space. Cadillac Fairview’s
TD Centre at 222 Bay St. was in high demand this quarter with two leases                                                            Total vacancy
signed for over 50,000 square feet. SAP took 57,500 square feet while BDO
                                                                                                                                                        6.9%
took another 57,500 s.f. in the building. BMO leased the full 11th floor at 150                                                         5.6%
King St. W. for approximately 21,000 square feet. In the west, Nuco, a                                                                                                 4.6%            4.4%
blockchain startup founded by ex-Deloitte leads, took 19,000 square feet at
129 Spadina Ave., proving the area’s brick-and-beam space still has its charm.
Migration to the core isn’t the only driver of demand!
                                                                                                                                        2015            2016            2017         Q1 2018
In Liberty Village, Kevric’s 99 Atlantic Avenue project kicked off this quarter.
The development is going ahead on spec and will deliver 151,000 square feet
of class A space to the market. Expected delivery for the building is in Q4 2019.                                                  Average asking net rents ($/s.f.)                     Class A
                                                                                                                                                                                         Class B
Outlook
                                                                                                                                   $80.00
We expect downtown supply to get even tighter as we approach the
2020/2021 delivery dates of new construction. Rental growth is accelerating                                                        $60.00
aggressively as well in response to the lack of space, with average gross                                                          $40.00
asking rates increasing by 2.7 percent quarter-over-quarter to $55.77! Larger
tenants with lease expiries before 2020 should expect to act quickly or                                                            $20.00
negotiate deftly for their perfect space.                                                                                           $0.00
                                                                                                                                                 2015          2016         2017       Q1 2018

© 2018 Jones Lang LaSalle IP, Inc. All rights reserved. All information contained herein is from sources deemed reliable; however, no representation or warranty is made to the accuracy thereof.
Toronto West

Still Waiting for a Recovery in the Toronto West Market
                                                                                                                                   Fundamentals                                    Forecast
  • Suburban vacancy edged up 10 basis point due to near zero net
    absorption and the completion of 2 International Boulevard                                                                     YTD net absorption                          11,617 s.f. ▲
  • Vacancy has changed very little since Q4 2016                                                                                  Under construction                         748,648 s.f.    ▶
  • Despite high vacancy, average gross rental rates continue to rise                                                              Total vacancy                                    15.7%     ▶
    modestly to $29.90 per square foot                                                                                             Average asking rent (gross) $29.90 p.s.f.                  ▶
Despite strong tenant growth in 2016, absorption has stalled over the past                                                         Concessions                                      Stable    ▶
several quarters and vacancy remains high in the Toronto West market.
Strong job growth in the Toronto area since 2016 and an extremely tight                                                            Supply and demand (s.f.)                      Net absorption
downtown market has yet to translate into significant tenant growth in the                                                                                                       Deliveries
                                                                                                                                   1,500,000
West region. Further headwinds for landlords will be the over 400,000 square
                                                                                                                                   1,000,000
feet of space expected to be added to the leasing market in Q2. While high
quality new builds continue be the most competitive portion of the market, in                                                        500,000
some locations, even these building have struggled as both 2727 Meadowpine                                                                   0
Boulevard and 2 International Boulevard have yet to see any leasing.
                                                                                                                                    -500,000
                                                                                                                                                   2014      2015      2016      2017 Q1 2018
There were still signs of life as leasing activity has been steady in Q1. Pearson
Vue signed a 20,000 square foot deal at 567 Michigan Drive, Cogeco signed a
30,000 square foot sublease at 191 The West Mall, Primerica did a 43,000
square foot deal at 6985 Financial Drive and Axis Auto Finance took 24,000                                                          Total vacancy
square feet of the Revera sublease at 55 Standish Court. All these deals                                                                          17.2%
                                                                                                                                                               15.7%        15.6%       15.7%
represent net growth in the Toronto West market and join Geotab, Scotiabank                                                           13.6%

and Cognizant as tenants who are either entering the West market or
expanding in it. These moves should translate into positive net absorption for
the year. Meanwhile, downtown Toronto has no major completions scheduled
until 2020 and with continued strong demand in the Toronto area, more
tenants are likely to take advantage of the large block availabilities in                                                             2014         2015        2016         2017       Q1 2018
Toronto’s western suburbs.

Outlook                                                                                                                            Average asking net rents ($/s.f.)                     Class A
                                                                                                                                                                                         Class B
The West market is expected to remain a tenants market through 2018 but
                                                                                                                                   $20.00
vacancy will likely drop slightly. Rents have achieved inflationary growth and
this is expected to continue, however Tenant Improvement allowances will
remain robust on 10 years deals, often exceeding $50.00 per square foot in                                                         $15.00
many submarkets.

                                                                                                                                   $10.00
                                                                                                                                                 2014     2015       2016      2017     Q1 2018

© 2018 Jones Lang LaSalle IP, Inc. All rights reserved. All information contained herein is from sources deemed reliable; however, no representation or warranty is made to the accuracy thereof.
Toronto North &
                                                                                                         East

Vaughan is Hot, North Yonge is Not
  • Vacancy dropped 40 basis points this quarter due to strong absorption                                                          Fundamentals                                    Forecast
    and no new supply coming to market                                                                                             YTD net absorption                         189,358 s.f. ▶
  • Vaughan was the standout node with 193,913 square feet of positive net                                                                                                                    ▲
                                                                                                                                   Under construction                         240,819 s.f.
    absorption
  • Average gross rental rates declined 0.5 percent this quarter, but have                                                         Total vacancy                                    10.4%     ▶
    seen moderate growth over the past few years                                                                                   Average asking rent (gross) $31.86 p.s.f.                  ▶
Vacancy dropped notably in the overall North and East market almost solely                                                         Concessions                                      Stable    ▶
due to strong absorption in Vaughan. This quarter Telecon completed their
120,000 square foot move into the recently completed 7777 Weston Road                                                              Supply and demand (s.f.)                      Net absorption
while FM Global made their move from Markham to the KPMG Tower and                                                                                                               Deliveries
                                                                                                                                   1,000,000
Taylor Made Expanded out of the Adidas facility into 6240 Highway 7. Vacancy
in the node now stands at 6.3 percent and has seen a total of almost 700,000                                                         500,000
square feet of positive net absorption since 2015. Additionally, it was also
announced that LiUNA local 183 will soon break ground on their new 295,000                                                                   0
square foot headquarters on Huntington Road. The recently completed
Vaughan subway extension has helped transform Vaughan from a secondary                                                              -500,000
                                                                                                                                                   2014      2015      2016      2017 Q1 2018
office market into a prime destination for major office tenants in the region.

The story is significantly different in North Yonge. Vacancy has been steadily
rising to 11.0 percent. This quarter Ivari signed a 100,000 square foot renewal                                                     Total vacancy
at 5000 Yonge Street, but gave back at least 2 floors of space in the process.                                                        11.1%                    11.0%
This combined with Cognizant and Capitol One imminently moving out of the                                                                                                   10.8%
node will likely cause vacancy to rise further this year. Tenants should now                                                                      10.3%                                 10.4%
find themselves with more leverage in this typically expensive and transit
friendly node.

Meanwhile Vacancy in the East market has held stable at 11.1 percent. Leasing                                                         2014         2015        2016         2017       Q1 2018
has been steady with BDO and TELUS signing renewals at 60 Columbia Way
and 120 Commerce Valley Drive respectively, while Home Depot expanded
their presence at 1 Concorde Gate. However, with Harlequin vacating the                                                            Average asking net rents ($/s.f.)                     Class A
                                                                                                                                                                                         Class B
region in Q2 and Sony downsizing, they are still many large vacancies in the
                                                                                                                                   $20.00
region.
Outlook
The downward trend in vacancy since 2016 will likely slow this year as                                                             $15.00
Vaughan is now largely leased up and much of the rest of the market is
lukewarm. However strong demand and lack of new supply downtown may
encourage further tenant growth in the next few years.                                                                             $10.00
                                                                                                                                                 2014     2015       2016      2017     Q1 2018

© 2018 Jones Lang LaSalle IP, Inc. All rights reserved. All information contained herein is from sources deemed reliable; however, no representation or warranty is made to the accuracy thereof.
Ottawa
Quiet start to 2018 for the nation’s capital but vitals
point to stronger momentum ahead
Fundamentals Forecast
• Job market is improving, with the unemployment rate falling below 5.0
YTD net absorption -164,330 s.f. ▼
percent for the first time in a decade
• Government town no longer! Industries in Ottawa are diversifying and Under construction 0 s.f. ▶
growing, mainly in the tech space Total vacancy 11.4% ▲
• However, tenants are still taking advantage of lease rollovers to optimize Average asking rent (gross) $33.68 p.s.f. ▶
their office space, counteracting the new demand Concessions Stable ▼
Ottawa’s economy experienced a solid start to the year. 9,800 jobs were Supply and demand (s.f.) Net absorption
Deliveries
added to the market this quarter, pushing the unemployment rate down to
1,000,000
4.8 percent. This is the lowest level attained by Ottawa since 2008! The
revitalized job market is driven by two factors: increased government
500,000
spending under the Liberal government and the diversification of industries
active in the city. Growth rate in the public sector has rapidly accelerated, 0
from 0.1 percent pre-2015 to over 3.0 percent post-2015. Meanwhile, as the
government presence returns, so has the high-tech sector in the wake of -500,000
Nortel Networks’ dissolution back in 2010/2011. In addition to 2015 2016 2017 Q1 2018
telecommunications, SaaS, cloud software development, AI, and e-commerce
are all growing sources of demand in Ottawa.
However, large occupiers are still taking advantage of their lease expiries to Total vacancy
optimize their space use. Large firms are modernizing their office layouts by 11.4%
moving from traditional closed offices to open plans in order to attract and 10.9%
10.6%
retain top talent. Transactions like these continue to offset significant deals 10.1%
like SurveyMonkey taking 48,000 square feet over six floors at 200 Laurier
Avenue West and Telesat taking roughly 76,000 square feet at 160 Elgin Street,
the Place Bell building. The federal government has completed multiple deals
as well, most notably taking 14,000 square feet at 219 Laurier Ave. W. and 2015 2016 2017 Q1 2018
16,000 square feet at 225 Albert St.
Outlook Average asking net rents ($/s.f.) Class A
Class B
Ottawa has seen a slow start to the year, but diversification is a solid sign for
$20.00
the future. Accordingly, Ottawa sits at a turning point. Market momentum isn’t
quite there yet but the pieces are being put in place. With no new
construction on the horizon, any acceleration of demand will be potent. We $10.00
expect tenant-favourable conditions to continue until the market posts at
least three consecutive quarters of positive net absorption.
$0.00
2015 2016 2017 Q1 2018
© 2018 Jones Lang LaSalle IP, Inc. All rights reserved. All information contained herein is from sources deemed reliable; however, no representation or warranty is made to the accuracy thereof.Montreal
Downtown Montreal renewal continues apace with new
office tower and public infrastructure work
• Broccolini will build the National Bank’s new headquarters. The 1 million Fundamentals Forecast
square feet (up to 36 floors) building will be the tallest new office tower YTD net absorption -484,205 s.f. ▲
in Montreal in over 25 years. Under construction 2,617,245 s.f. ▼
• The Greater Montreal Area’s (GMA) unemployment rate was stable at 6.1 Total vacancy 13.4% ▼
percent in Q1.
• The GMA total vacancy rate increased 60 basis points quarter-over- Average asking rent (gross) $29.34 p.s.f. ▲
quarter to 13.4 percent. Concessions Stable ▶
The solid performance of Montreal’s labour market continues, adding 20,000 new
jobs in the first quarter of the year. The unemployment rate, however, remained Supply and demand (s.f.) Net absorption
Deliveries
unchanged at 6.1 percent as more people entered the job market. Montreal has 2,000,000
an aging workforce; its capacity to attract qualified workers will be a key factor in 1,000,000
maintaining good growth prospects.
0
The moving of Manulife staff between their old premises at 2000 Mansfield and
-1,000,000
their new home at Maison Manuvie caused statistical imbalances in absorption
numbers between the last quarter of 2017 and the first quarter of 2018. Likewise, -2,000,000
new marketing initiative for office space at 555 Chabanel caused absorption to be 2013 2014 2015 2016 2017 Q1 2018
underestimated in the Midtown market. Overall, the office leasing market was
mostly stable during the first three months of 2018.
In the downtown area, several large subleases have been added to the leasing Total vacancy
market. Aeroplan (Aimia) added 104,571 square feet of sublet space at 525 Viger
West, in Downtown-South, while Yellow Pages added 50,000 square feet at 1250 12.0% 12.6% 12.9% 12.8% 13.4%
René-Lévesque West in the Downtown Core. 9.7%
While the first quarter did not see any new office deliveries, the year still awaits
two notable Class A office towers; Solar Uniquartier (Phase 1), located on the
South Shore, will add close to 157,000 square feet (8 floors) of which 87,000
square feet remain available for lease. The second delivery is 1100 Atwater. Kevric 2013 2014 2015 2016 2017 Q1 2018
is responsible for the conversion of the seven-storey building from a data center
to an office tower and the entire 154,000 square feet of the building remain
available for lease. Average asking net rents ($/s.f.) Class A
Class B
Outlook
$20.00
Montreal is in the midst of a major revamping of its infrastructure. Construction of
the light-rail system (REM) has officially begun while work continues on the Turcot
highway exchange and the new Champlain bridge. The downtown area is also the
$10.00
subject of a major makeover: the City of Montreal is refurbishing the main
shopping segment of Sainte-Catherine street and will transform McGill College
Avenue into a central pedestrian plaza.
$0.00
2013 2014 2015 2016 2017 Q1 2018
© 2018 Jones Lang LaSalle IP, Inc. All rights reserved. All information contained herein is from sources deemed reliable; however, no representation or warranty is made to the accuracy thereof.Montréal
Nouveau gratte-ciel et réfection d’infrastructures: le
renouveau de Montréal se poursuit
• Broccolini et la Banque Nationale ont annoncé la construction de la plus Fondamentaux Prévisions
haute tour de bureau de Montréal en 25 ans. L’édifice d’1 million de p.c. sur 36 Absorption totale nette CDA -484 205 pi. ca ▲
étages accueillera le nouveau siège social de la Banque Nationale
• Le taux de chômage dans la Grande région de Montréal (GRM) était stable à 6,1
En construction 2 617 245 pi.ca ▼
pourcent Taux d’inoccupation global 13,4% ▼
• Le taux d’inoccupation dans la GRM a augmenté de 60 points de base Moyenne des loyers bruts $29,34 / pi. ca. ▲
atteignant 13,4 pourcent. Allocation Stable ▶
La solide performance du marché de l’emploi Montréalais se poursuit avec l’ajout
de 20 000 nouveaux postes au premier trimestre. Le taux de chômage reste L’offre et la demande (pi. ca) Absorption totale nette
Constructions complétées
cependant inchangé, car la population active a aussi augmenté. Montréal a une 2 000 000
main-d’œuvre vieillissante; l’attrait de travailleurs qualifiés sera essentiel pour 1 000 000
conserver un potentiel de croissance intéressant.
0
Le déménagement des employés de Manuvie entre leurs anciens locaux au 2000 -1 000 000
Mansfield et leur nouvel espace de travail à la Maison Manuvie a provoqué un
-2 000 000
déséquilibre dans les données statistiques aux T4 2017 et T1 2018. Parallèlement,
2013 2014 2015 2016 2017 T1 2018
l’absorption au Centre-de-l’Ile était sous-estimée suite à une nouvelle initiative de
commercialisation du 555 Chabanel. Globalement, le marché de location des
espaces de bureaux est demeuré relativement stable.
Taux d’inoccupation global
Au centre-ville, quelques gros espaces de sous-location ont été mis sur le marché:
104 571 p.c. d’espace à 525 Viger Ouest au centre-ville sud par Aeroplan (Aimia) et 12,0% 12,6% 12,9% 12,8% 13,4%
50 000 p.c. au 1250 René-Lévesque Ouest au cœur du centre-ville par Pages Jaunes. 9,7%
Deux nouveaux édifices de classe A seront ajoutés à l’inventaire en 2018. Solar
Uniquartier (Phase 1), situé sur la Rive Sud, représente 157 000 p.c. sur huit étages,
dont 87 000 p.c. sont toujours disponibles. Le deuxième projet est 1100 Atwater.
2013 2014 2015 2016 2017 T1 2018
Kevric convertit ce centre de données de sept étages en tour de bureau. Le
bâtiment entier 154 000 p.c. reste disponible, ce qui représente 50 000 p.c.
Moyenne des loyers nets ($/pi. ca)
Perspectives A B
Montréal modernise de ses infrastructures. La construction du Réseau express 20,00$
20.00$
métropolitain (REM) a officiellement débuté, alors que les travaux sur l’échangeur
Turcot et le pont Champlain se poursuivent. La transformation du centre-ville est
aussi enclenchée: la ville de Montréal remet à neuf le tronçon principal de la rue 10,00$
10.00$
Sainte-Catherine Ouest et transformera l’avenue McGill College en place publique
piétonnière.
0,00$
0.00$
2013 2014 2015 2016 2017 T1 2018
© 2018 Jones Lang LaSalle IP, Inc. All rights reserved. All information contained herein is from sources deemed reliable; however, no representation or warranty is made to the accuracy thereof.Edmonton
New construction will further increase vacancy this year
Fundamentals Forecast
• Vacancy in the city increased by 160 basis points to reach 18.0 percent
• The disposition of Enbridge Tower will likely result in the asset being YTD net absorption -75,764 s.f. ▼
repurposed and removed from inventory. Furthermore, approximately Under construction 723,058 s.f. ▼
680,158 square feet of office space is expected to be introduced into the Total vacancy 18.0% ▲
overall market this year, further increasing vacancy Average asking rent (gross) $34.42 p.s.f. ▼
• Overall net rents across Edmonton decreased by 5.1 percent at $17.67
per square foot Concessions Rising ▲
The Edmonton office market continues to experience subdued office leasing Supply and demand (s.f.) Net absorption
demand. The Downtown market recorded 33,288 square feet of negative net Deliveries
absorption and the vacancy rate increased by 10 basis points to 17.9 percent. 1,500,000
The suburban market experienced 42,474 square feet of negative net
500,000
absorption and saw its vacancy rate increase by 190 basis points to reach 18.2
percent. The overall market remains tenant favourable and has an
-500,000
abundance of office alternatives in all building classes. These alternatives will
range from high quality product to attractive sublease rates, mostly found in -1,500,000
the Downtown market. 2015 2016 2017 Q1 2018
The Provincial Government led the way in terms of new leasing activity this
quarter. In total, the Province leased 115,871 square feet in three different Total vacancy
buildings and in three different submarkets. Alberta Infrastructure leased 16.4%
18.0%
57,048 square feet at Bonaventure Gate located in the 149th Street submarket 15.2%
and also took 19,473 square feet at the 9925 Building located in the 9.5%
Government District. Alberta Gaming & Liquor Commission (AGLC), moved
into 39,350 square feet at West Campus located in the West End submarket.
AGLC acquired this additional space as they will be responsible to administer
the upcoming cannabis legislation. Additional Government leasing activity
2015 2016 2017 Q1 2018
was found at TD Tower, with the Edmonton Police Service committing to
83,026 square feet of office space.
Outlook Average asking net rents ($/s.f.) Class A
With more inventory being introduced this year, an increase in vacancy will Class B
follow. Stantec Tower will account for the majority with 578,000 square feet $30.00
added to the Financial Core in Q4. In addition, 149th Street, Southside and the
Whyte Avenue submarkets will see new buildings completed which currently $20.00
have no large tenants committed to the new spaces. As demand is not
expected to increase, and much of the additional inventory added is expected $10.00
to be vacant, the market will remain tenant favourable for some time.
$0.00
2015 2016 2017 Q1 2018
© 2018 Jones Lang LaSalle IP, Inc. All rights reserved. All information contained herein is from sources deemed reliable; however, no representation or warranty is made to the accuracy thereof.Downtown
Calgary
Leasing activity surges as more tenants flee lower class
assets
Fundamentals Forecast
• Downtown vacancy continues to rise, up 1.4 percent since last quarter YTD net absorption -587,297 s.f. ▲
• Sublease market still eroding rental rates, accounting for nearly one Under construction 428,599 s.f. ▶
third of downtown vacancy Total vacancy 24.5% ▶
• Vacancy in Class B & C assets increased to 33.6 percent and 42.5 percent
respectively during Q1, illustrating a continued flight-to-quality Average asking rent (gross) $34.48 p.s.f. ▼
Concessions Stable ▶
After only a 200 basis points increase in downtown vacancy during the Supply and demand (s.f.) Net absorption
Deliveries
entirety of 2017, the first quarter of 2018 has ended with a 140 basis points 2,000,000
increase in vacancy, translating to more than 10.8 million square feet of
vacant downtown office space. Of that vacancy, nearly a third is being offered 0
by sub-landlords. Mirroring the dominance of the energy industry in Calgary's
core, the majority of available sublease space is top tier, Class A, Centre Core -2,000,000
space. These sub-landlords offer their space at discounted rates, resulting in
-4,000,000
continued pressure on average rents across the entire city. Downtown
2015 2016 2017 Q1 2018
Calgary’s average gross rents have fallen to $34.48 per square foot.
As we saw in 2017, and clearly continuing into this year, Calgary’s tenants are
taking advantage of the abundance of Class A space at discounted rates. Total vacancy
Class B & C assets in Downtown saw the largest increases in vacancy; an 23.1% 24.5%
21.1%
accurate representation of Calgary’s tenants fight-to-quality.
14.1%
Last year we saw the completion of Manulife’s 707 Fifth and Brookfield’s
Brookfield Place East, adding 140 basis points to our vacancy rate. Currently,
TELUS Sky is the only building under construction in the Downtown Core. With
only two floors pre-leased, TELUS Sky could add nearly 300,000 square feet of 2015 2016 2017 Q1 2018
vacant office space to Calgary’s Centre Core later this year.
Outlook Average asking net rents ($/s.f.) Class A
Class B
On the surface, Calgary seems to have bottomed out; construction has slowed
$20.00
and vacancy has remained relatively stagnant over the past 18 months.
Despite a renewed sense of optimism since Calgary’s oil crash in 2015, until
there is more clarity on the position of international companies employing $15.00
capital in Canada, and projects like the LNG pipeline, Calgary’s office market
will see little change in vacancy and new tenants in the market.
$10.00
2015 2016 2017 Q1 2018
© 2018 Jones Lang LaSalle IP, Inc. All rights reserved. All information contained herein is from sources deemed reliable; however, no representation or warranty is made to the accuracy thereof.Suburban
Calgary
Calgary suburban office market continues to be tenant
favourable, while city attempts to improve vacancy
rates
Fundamentals Forecast
• Suburban office vacancy is at 16.2 percent, down 30 basis points since
YTD net absorption 75,898 s.f. ▲
last quarter
• Market remains tenant favourable, with attractive net asking rents and Under construction 418,454 s.f. ▶
tenant improvement packages available Total vacancy 16.2% ▲
• City of Calgary invests $100 million, and developers slow construction Average asking rent (gross) $ 26.73 p.s.f. ▼
attempting to decrease current vacancy rates Concessions Stable ▶
Calgary’s suburban office market saw little movement from the trends Supply and demand (s.f.) Net absorption
Deliveries
established in the last quarter of 2017. A small change in office vacancy can
1,000,000
be attributed to limited new inventory and few new significant entrants into
existing spaces. Average net asking rates have dropped slightly, to $18.70 per
square foot for Class A buildings and $14.25 per square foot for Class B 0
buildings. In order to entice tenants, landlords continue to offer appealing
asking rates, significant tenant improvement packages and free rent.
-1,000,000
Calgary is attempting to recover from the economic downturn, and improve 2015 2016 2017 Q1 2018
vacancy through adaptation and investment. The City of Calgary recently
increased its Economic Development Investment Fund (EDIF)to $100 million
in order to attract new business and stimulate economic growth. Local Total vacancy
developers are aiding the suburban market by slowing construction on
20.5%
existing projects and new deliveries. Significant projects including Centron’s 16.5% 16.2%
Place 10 in the Beltline and Remington’s Quarry Station in the south are 14.3%
9.8%
waiting for anchor tenants to launch construction. It is unlikely that suburban
office vacancies will achieve significant decreases in the short term, however a
combination of slowed construction, financial investment and an improving
economy will attempt to support the decrease in available office space. 2014 2015 2016 2017 Q1 2018
Outlook
While the office market continues to recover along with the economy, net Average asking net rents ($/s.f.) Class A
Class B
rental rates and incentive packages are still very tenant focused. Landlords
$30.00
will continue to try and entice new tenants to take up existing space with
appealing net asking rates and tenant improvement allowances. Recent deal
velocity in the market has created a sense of improvement, however the $20.00
majority of large users are leaving behind a significant amount of space in
their previous locations, which will add to the overall vacancy into 2018 and
beyond. $10.00
2015 2016 2017 Q1 2018
© 2018 Jones Lang LaSalle IP, Inc. All rights reserved. All information contained herein is from sources deemed reliable; however, no representation or warranty is made to the accuracy thereof.Metro
Vancouver
And They're Off!
• Currently, only four ‘A’ Class buildings offer contiguous space of 15,000 Fundamentals Forecast
square feet or more in the downtown core. YTD net absorption 291,521 s.f. ▲
• The total square footage under construction increased by 17.1 percent Under construction 2,432,903 s.f. ▲
from last quarter, a result of 601 West Hastings and 320 Granville Total vacancy 8.1% ▼
beginning construction.
• The latest unemployment rate for B.C. is 4.7 percent, the lowest in Average asking rent (gross) $41.21 p.s.f. ▲
Canada. Concessions Stable ▶
Hot on the heels of 753 Seymour, 601 West Hastings and 320 Granville began
construction, signaling that the new development cycle is in full swing. We expect Supply and demand (s.f.) Net absorption
Deliveries
to see 1133 Melville and 400 West Georgia join the race in the coming months. In an
effort to expedite the development process the City of Vancouver has agreed to 3,000,000
issue demolition permits in advance of the rezoning and development application,
2,000,000
allowing developers to streamline the process by commencing the remediation
and demolition work while simultaneously working with the City to obtain the
1,000,000
remainder of approvals. Tenants, however, will be waiting until 2021/22 before this
new product arrives.
0
2015 2016 2017 Q1 2018
In the meantime, tenants will be competing for a dwindling supply of quality space.
Total space availability fell by 80 basis points from last quarter to 7.4 percent. This
was a result of strong tenant demand, in this quarter alone we saw a total of Total vacancy
541,000 square feet of space leased (leases >20,000 square feet). Government
11.8%
agencies accounted for 40.0 percent followed by the technology sector with 18.0 10.5%
percent. Total vacancy for the entire market continued to drop, falling 20 basis 8.3% 8.1%
points to 8.1 percent while Downtown Vancouver saw its total vacancy fall by 70
basis points to 6.5 percent. This is in part due to another quarter of high net
absorption totaling 291,521 square feet, which was a result of companies taking
occupancy of their new spaces including Splunk, Altus, Aurora and xMatters in the
downtown market and AbCellera and Arista Networks in the suburban markets. 2015 2016 2017 Q1 2018
Outlook
We anticipate continued strong demand for office space in the Metro Vancouver Average asking net rents ($/s.f.) Class A
Class B
market as many Canadian and U.S. companies continue to grow and relocate here.
2018 will see another year of strong absorption; however, we can expect to see $30.00
absorption begin to slow as the availability of space reaches historic lows. Until the
new supply arrives, tenants will be competing strongly for all spaces, particularly full $20.00
floor opportunities, likely resulting in increased rental rates and a flight to the
suburbs. $10.00
$0.00
2015 2016 2017 Q1 2018
© 2018 Jones Lang LaSalle IP, Inc. All rights reserved. All information contained herein is from sources deemed reliable; however, no representation or warranty is made to the accuracy thereof.18 Office Outlook | Canada | 2018 Want more information? Thomas Forr Gaurav Mathur Research Manager, Office Research Manager, Capital Markets +1 416 304 6047 +1 416 238 4455 Thomas.Forr@am.jll.com Gaurav.Mathur@am.jll.com
About JLL                                                                          About JLL Research

JLL (NYSE: JLL) is a leading professional services firm that                       JLL’s research team delivers intelligence, analysis and
specializes in real estate and investment management. A                            insight through market-leading reports and services that
Fortune 500 company, JLL helps real estate owners,                                 illuminate today’s commercial real estate dynamics and
occupiers and investors achieve their business ambitions.                          identify tomorrow’s challenges and opportunities. Our
In 2017, JLL had revenue of $7.9 billion; managed 4.6 billion                      more than 400 global research professionals track and
square feet, or 423 million square meters; and completed                           analyze economic and property trends and forecast future
investment sales, acquisitions and finance transactions of                         conditions in over 60 countries, producing unrivalled local
approximately $170 billion. At the end of 2017, JLL had                            and global perspectives. Our research and expertise, fueled
nearly 300 corporate offices, operations in over 80                                by real-time information and innovative thinking around
countries and a global workforce of 82,000. As of December                         the world, creates a competitive advantage for our clients
31, 2017, LaSalle had $58.1 billion of real estate assets                          and drives successful strategies and optimal real estate
under management. JLL is the brand name, and a                                     decisions.
registered trademark, of Jones Lang LaSalle Incorporated.
For further information, visit www.jll.com.

©2018 Jones Lang LaSalle IP, Inc. All rights reserved. No part of this publication may be reproduced by any means, whether graphically, electronically, mechanically
or otherwise howsoever, including without limitation photocopying and recording on magnetic tape, or included in any information store and/or retrieval system
without prior written permission of Jones Lang LaSalle. The information contained in this document has been compiled from sources believed to be reliable. Jones
Lang LaSalle or any of their affiliates accept no liability or responsibility for the accuracy or completeness of the information contained herein and no reliance
should be placed on the information contained in this document.
You can also read