OPPORTUNITIES TO ATTRACT SNAP SHOPPERS - IRI
←
→
Page content transcription
If your browser does not render page correctly, please read the page content below
Part   March
COVID-19
The Changing Shape of the CPG Demand Curve          12
                                                    2021

OPPORTUNITIES TO
ATTRACT SNAP SHOPPERS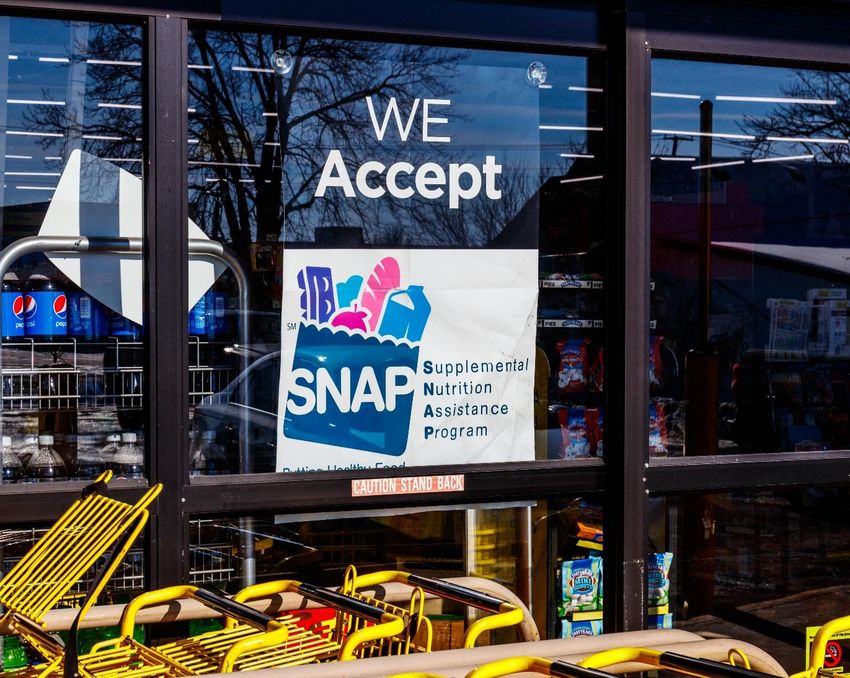
EXECUTIVE SUMMARY
    As of December 2020, 43 million Americans (13% of the population) across 20.5 million households participated
    in the Supplemental Nutrition Assistance Program (SNAP), an increase of 20% from 2019. USDA expanded
    the SNAP Online Purchasing Pilot, and it is now available in 1.5 million households in 46 states and D.C. for
    consumers using SNAP benefits to purchase groceries online through participating retailers.
    SNAP households purchased $74B, or 12% of Total Food & Beverage (sans produce, bakery, deli) in calendar
    year 2020, a dramatic increase from the $55B spent for the 52 weeks ended August 2020. Stimulus dollars, more
    SNAP participants, and prolonged access to SNAP benefits ensure that this population is important to CPG retail.
    SNAP recipients can be of any age but are more likely to be single / divorced and skew toward larger households.
    While a majority of recipients are white, both Black and Hispanic over index as a percent of total population.

Food & Beverage Purchase Influencers
•    Meal occasions account for 35% of SNAP recipient total CPG Food & Beverage spend, and there are categories within
     F&B where SNAP dollars capture a higher share of private label sales.
•    Private label accounts for 17% of SNAP dollar sales, but more trips and higher spending illustrate SNAP shoppers’
     preference for national brands, particularly in snack and beverage categories.
•    As with total population, snacking takes place throughout the day. SNAP recipients allot 21% of their spend on
     snacks. Promoting convenience and multiple servings for less money will support these shoppers.
•    While grocery is the top channel shopped for SNAP, recipients skew on shopping mass and dollar channels, often
     due to proximity and EDLP value. Online is gaining SNAP share as more retailers gain approval.
Attract and Retain SNAP
•    Leverage IRI SNAP target groups to understand and embrace the increasing importance of these shoppers.
•    Retailers and CPG should collaborate to educate SNAP recipients with financial and nutritional support materials.
•    Online baskets of SNAP shoppers are more lucrative than those of non-SNAP shoppers. Retailers should encourage
     online shopping with list-building, promotions and online fee waivers and/or payment options.
•    Promote cook-from-scratch and healthy affordable convenience meals (e.g., right mix of national and store brands).
•    Promote EDLP strategies. As income decreases, so does the percent of dollars sold on promotion, suggesting these
     shoppers can’t wait for a sale.

                                                                                                    © 2021 Information Resources Inc. (IRI). Confidential and Proprietary.   2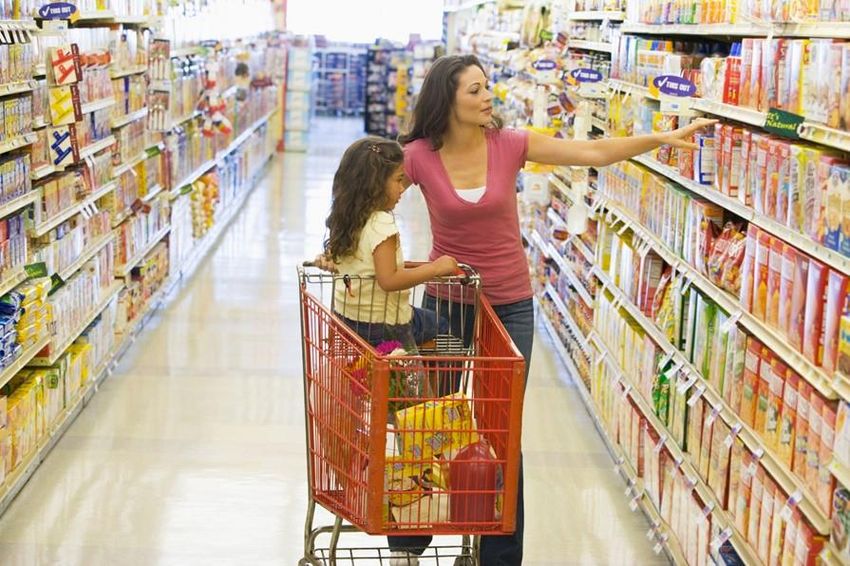
COVID-19 Spurred Multiple
Changes in SNAP Benefits
SNAP benefits increased throughout 2020, starting with an
increase of $2B or 40% in spring 2020.

In December, Congress provided a 15% increase in SNAP
benefits from January through June 2021. As part of the American
Rescue Plan, President Biden called on Congress to extend the
increase in SNAP benefits through September.

USDA expanded the SNAP Online Purchasing Pilot beyond the
original eight states. Currently, more than 1.5 million households
in 46 states and D.C. are using their SNAP benefits to purchase
groceries online through participating retailers.

States may suspend ordinary time limits for eligibility (specifically
for able-bodied adults without dependents).

SNAP benefits were boosted in 2020 under the Families First
Coronavirus Response Act, but it excluded 37% of households
already receiving the maximum SNAP benefits. USDA is working
with the Department of Justice to increase the weekly value of
SNAP benefits for these 12 million recipients.

    Source: Diatribe.org and SnapToHealth.org and https://www.fns.usda.gov and https://www.cbpp.org
                                 © 2021 Information Resources Inc. (IRI). Confidential and Proprietary.   3
SNAP “Snapshot”
2020 SNAP Participation Up

                SNAP
         Participants

  SNAP Participants
  as a % of the Total
     U.S. Population

   Increase of SNAP
        Participants
          from 2019

                             Source: https://www.fns.usda.gov/pd/supplemental-nutrition-assistance-program-snap; https://www.census.gov/popclock/; Population as of 7/1/20 – 329,877,505
                                                                                                                     © 2021 Information Resources Inc. (IRI). Confidential and Proprietary.   4
SNAP Benefits Are Applied to Food Products,
With the Exception of Prepared and Hot Foods,
as Well as Beverage Alcohol
Any Food for the Household, Such As:
• Fruits, vegetables • Other foods like snacks,
• Meat, poultry, fish   non-alcoholic beverages
• Dairy products      • Seeds and plants
• Breads, cereals

Households CANNOT Use SNAP Benefits to Buy:
• Beer, wine, liquor, cigarettes, tobacco • Nonedible items like
• Vitamins, medicines, supplements          pet foods, cleaning
• Live animals (except shellfish,           supplies, paper
  fish from water, etc.)                    products, other
• Immediate-consumption                     household supplies,
  prepared foods                            hygiene items,
• Hot foods                                 cosmetics

                                       Source: https://www.fns.usda.gov/snap/eligible-food-items
                             © 2021 Information Resources Inc. (IRI). Confidential and Proprietary.   5
In the Past, SNAP Participation Generally Followed
Unemployment Trends, But Recent Years Saw a Widened Gap
Unemployment peaked at 14.8% in 2020, but fell to 6.7% in November 2020.
Unemployment will continue to decline, but levels of SNAP participation will remain elevated through 2021.

                                       SNAP Participation and Unemployment
                                                                                                                                             COVID-19                16.0
                    70.0
                           RECESSION               RECESSION                                                                                                         14.0
                    60.0

                                                                                                                                                                             Unemployment Rate
                                                                                                                                                                     12.0
  Recipients (MM)

                    50.0
                                                                                                                                                                     10.0
                    40.0
                                                                                                                                                                     8.0
                    30.0                                                                                                                                             6.0
                    20.0                                                                                                                                             4.0
                    10.0                                                                                                                                             2.0
                     0.0                                                                                                                                             0.0
                                         Snap Recipients            Unemployment Rate

                                                       Source: U.S. Department of Labor and https://www.fns.usda.gov/pd/supplemental-nutrition-assistance-program-snap
                                                                                                    © 2021 Information Resources Inc. (IRI). Confidential and Proprietary.                       6
In Addition to Being Low Income and Across Generations, SNAP Shoppers Are
More Likely to Be Single / Divorced and Living in Large Households With Children

                                       WHO IS THE SNAP SHOPPER?

                                                                                                                      61%
                                                                                                                    (214 Index)

                                                                                  31%                         Do Not
                                                                                                                                                   36% (125 Index)
                                                                                  (388 Index)                 Own a
                                                                                                                                                            Live in
          35%                           28%
                                                                           Have HH Income                     Home
                                                                           Less Than $15K                                                                 Rural Areas

     Millennials (134 Index)       Boomers (84 Index)

                                                                               51%
           Compared to % of Total Population

        67%              21%             16%                                     (167 Index)
                                                                                   Single or                                           19% (171 Index)
          White            Black          Hispanic
                                                                                   Divorced                                                 5+ Person HHs
         (90 Index)      (165 Index)     (128 Index)

                                              Source: IRI Consumer Network™ Total US – All Outlets, 26 WE12/27/20 / Demographics of the SNAP Shopper (Index vs. Non-SNAP HH)
                                                                                                             © 2021 Information Resources Inc. (IRI). Confidential and Proprietary.   7
SNAP Dollars Increased Significantly During the Pandemic
                                                                                         $74B
A recent USDA study found that $1B in SNAP
stimulus would lead to an increase of $1.5B in
GDP, 54% above and beyond the new benefits.      $55B
• More SNAP participants in 2020

• SNAP eligibility periods have been
  extended

• Large percentage of stimulus dollars
  are spent on CPG products

                                                   52 WE                                      52 WE
                                                 August 2020                               December 2020

                                                               SNAP $ SPEND

                                                    Source: IRI Consumer Network™, Total US – All Outlets, 26 WE 12/27/20
                                                        © 2021 Information Resources Inc. (IRI). Confidential and Proprietary.   8
SNAP Households Purchase $74B of Total Food & Beverage Annually,
and Typically Shop More Frequently Across a Variety of Channels

   SNAP Recipients Represent
                of the total F&B Spend,
                and 13% of total U.S.
                population

                                                                                         SNAP Recipients Generate
   A SNAP Shopper on Average Makes                                                                            F&B Dollars
                                                                                                                                     *
                more trips* than                                                                          12.4%
                total population
                                                                                                          $74B
                                                                                                                                                                 SNAP
                                                                                                                                                                 Non-SNAP

                                   Source: IRI Consumer Network™, Total US – All Outlets, 26 WE 12/27/20 / *Total F&B excludes Produce, Deli, Bakery / 52 WE 12/27/20
                                                                                                    © 2021 Information Resources Inc. (IRI). Confidential and Proprietary.   9
Average
Dollar Sales Among SNAP Buyers $ per Buyer
Increased Pre- vs. During 11.8%
COVID-19, Driven by
a 20% Increase in
Buyers and Larger
23% Sales
Purchase Sizes Average $
per Trip 34.1%
$39B
SNAP F&B
20%
Buyers
9.1%
Trips per
Buyer
Source: IRI Consumer Network™, Total US – All Outlets, 26 WE 12/27/2020 vs. YG
© 2021 Information Resources Inc. (IRI). Confidential and Proprietary. 10Nearly 60% of
SNAP Shoppers Spend the
Same Amount of Time
Shopping as Before COVID-19
CPG Retail Must Continue
to Ensure Shopper Safety
and Increase Ease of Shopping
SNAP Recipients Who
Spent 30 Minutes on
Their Last Regular Trip
for Groceries In-Store
SNAP Recipients Who
Spent More Than One Hour
on Their Last Regular Trip
for Groceries In-Store
Source: IRI Weekly Surveys among IRI Consumer Network™ Panel representing Total U.S. Primary Grocery Shoppers – Wave 24 (1/8-1/10, 2021)
© 2021 Information Resources Inc. (IRI). Confidential and Proprietary. 11Meal Occasions Represent 35% of SNAP Recipient Total CPG F&B
Spend, While Beverage and Snacks Represent 42% of Their Spend
% of Spend
24% DINNER 21% SNACKS 5% BAKING
Dinner – SS Bakery Snacks Gelatin / Pudding PRD and Mixes
Dry Packaged Dinner Mixes Dried Meat Snacks Frosting
Corn on the Cob – FZ Non-Chocolate Candy Evaporated / Condensed Milk
Dinner / Entrees – FZ Dry Fruit Snacks Dessert Toppings – SS
Processed Poultry – FZ/RFG Appetizers / Snack Rolls FZ Sugar
Instant Potatoes Shelf Stable Dip / Dip Mixes Marshmallows
Potatoes / Onions – FZ
4% LUNCH 8% BEVERAGE
ALCOHOL 1% DESSERTS
Refrigerated Lunches Spirits / Liquor Refrigerated Cheesecakes
7% BREAKFAST 21% BEVERAGE 2% BABY
Pastry / Doughnuts Energy Drinks Baby Formula / Electrolytes
Toaster Pastries / Tarts Tea / Coffee – RTD
Breakfast Food – FZ Coffee Creamer – SS
Carbonated Beverages
*Total Food & Beverage excludes Produce, Deli and Bakery
**Cannot use SNAP dollars for Beverage Alcohol
Source: IRI Consumer Network™, Total US – All Outlets, 26 WE 12/27/2020; Total Food & Beverage - Dollar Share Index - SNAP HH’s vs. Non-SNAP HH’s
© 2021 Information Resources Inc. (IRI). Confidential and Proprietary. 12Many Top-Ranking SNAP Categories Revolve Around Convenience, Caffeine
and Feeding More for Less, Addressing Some of Snap Recipients’ Challenges
Carbonated Beverages Dinner / Entrees – Frozen Energy Drink Non-Chocolate Candy
Baby Formula / Electrolytes Bottled Juices Refrigerated Meat Tea / Coffee - RTD
Source: IRI Consumer Network™ Total US – All Outlets, 26 WE 12/27/2020; Total Food & Beverage - Dollar Share Index - SNAP HH’s vs. Non-SNAP HH’s
© 2021 Information Resources Inc. (IRI). Confidential and Proprietary. 13SNAP Shoppers Are Important to National Brands
Evidenced Not Only by Total Share, But Also Share of Specific National Brand Products
National Brands Private Label
% Share of Dollar Sales by Eating Occasion, National Brands vs. Private Label
Beverage Snacks Dinner Breakfast Lunch Baking
84% 16% 91% 9% 78% 22% 80% 20% 72% 28% 68% 32%
SNAP Households’ Dollar Share of National Brands’ Total Sales
Energy Drink – 64% Non-Chocolate Frozen Handheld Frozen Breakfast Refrigerated Meat / Cheese / Spice / Seasoning
Iced Coffee – 49% Chewy Candy – 38% Sandwich – 28% Handheld – 32% Cracker / Dessert – 30% (no salt / pepper) – 29%
Soft Drink – 34% Dried Meat Snack – 26% Shelf-Stable Microwaveable Pastry / Danish – 28% Sliced Lunchmeat – 29% Evaporated /
Fruit Drink Mix – 28% Rfg. Yogurt– 24% Dinner – 27% Muffin – 27% Ready-to-Serve Condensed Milk – 22%
Tortilla Chips – 23% Shelf-Stable Meat – 25% Ready-to-Eat Cereal – 24% Wet Soup – 27% Prepared Gelatin – 20%
Bottled Water – 26%
Fruit Rolls / Snacks – 23% Frankfurter – 25% Frozen Breakfast Dry Soup – 22% Cooking and Salad Oil – 19%
Frozen Dinner / Entree– 24% Entree – 23% Ramen – 22% Hominy Grits – 18%
*Total Food & Beverage excludes Produce, Deli and Bakery
Source: IRI Consumer Network™, Total US – All Outlets, 26 WE 12/27/2020 (top), All Outlets, 52 Weeks Ending 12-27-2020 (bottom)
© 2021 Information Resources Inc. (IRI). Confidential and Proprietary. 14Although Private Label Is 17%
of Dollar Sales, More Trips and
Higher Spending Show Preference by
SNAP Shoppers for National Brands
17%
of dollar sales for SNAP shoppers
is attributed to Private Label, similar
to 18% for non-SNAP shoppers
2.7X
more trips per buyer made by SNAP
shoppers for National Brands
spending vs. Private Label
4.9X
dollars per buyer spent by SNAP
shoppers on National Brands vs.
Private Label
Source: IRI Consumer Network™, Total US – All Outlets, 26 WE 12/27/2020 – Total Food and Beverage Share of Sales
© 2021 Information Resources Inc. (IRI). Confidential and Proprietary. 15However, in Select Categories, SNAP Dollars Capture
an Even Higher Share of Private Label Sales
Private Label vs. National Brand Purchases Are Driven by Availability and/or Preference
Categories where PRIVATE Categories where
LABEL Is Getting More NATIONAL BRANDS
Than 17% Share Are Within Are Getting More Than
Their “Fair Share”
Baking Breakfast Baby Snacks
Dessert Lunch Dinner Beverage Liquor
Source: IRI Consumer Network™, Total US – All Outlets, 26 WE 12/27/2020 – Index of % Dollar Sales by Eating Occasion – vs. SNAP Total F&B / *Total F&B excludes Produce, Deli and Bakery
© 2021 Information Resources Inc. (IRI). Confidential and Proprietary. 16Some SNAP Recipients
Plan to Change Their
Behavior in 2021 in
Response to the Pandemic
SNAP Recipients
Who Plan to Cook
From Scratch More
Often in 2021
161 Index
SNAP Recipients
Who Plan to Bake
Treats More
Often in 2021
164 Index
Source: IRI Weekly Surveys among IRI Consumer Network™ Panel representing Total U.S. Primary Grocery Shoppers – Wave 24 (1/8-1/10, 2021) / Index to All Respondents
© 2021 Information Resources Inc. (IRI). Confidential and Proprietary. 1737% Said They Will Wait
More Than Four Weeks
Before Returning to Dine
Out at a Restaurant
39% Plan to Dine Out
Less Often in 2021
Therefore, retailers need to
target messages about available
meal solutions in the store that
do not take long to prepare.
Source: IRI Weekly Surveys among IRI Consumer Network™ Panel representing Total U.S. Primary Grocery Shoppers – Wave 24 (1/8-1/10)
© 2021 Information Resources Inc. (IRI). Confidential and Proprietary. 18Income Concerns
May Impact How
SNAP Shoppers Spend
of SNAP recipients state they are
putting planned purchases on
hold and are reining in regular
spending as best they can.
of SNAP recipients state they are
having difficulty affording
needed groceries.
Source: IRI Weekly Surveys among IRI Consumer Network™ Panel representing Total U.S. Primary Grocery Shoppers – Wave 24 (1/8-1/10)
© 2021 Information Resources Inc. (IRI). Confidential and Proprietary. 19Overall SNAP Shoppers Spend Slightly Differently
Across the Month, But Spending Varies by State
SNAP Benefits Vary by State:
• In 36 states and Washington, D.C., benefits are
issued within the first two weeks of the month
• In 15 states, benefits are issued over a longer
period of three weeks
% of SNAP Monthly Dollar Spend – Average Month
51%
SNAP Dollars Spent
Over the First Half
of the Month
(Non-Snap = 50%)
WASHINGTON FLORIDA
49% 53% 1st 48% 1st
SNAP Dollars Spent Half Half
Over the Second of Month of Month
Half of the Month
47% 52%
(Non-Snap = 50%) 2nd Half 2nd Half
of Month of Month
(benefits in first 9 days) (benefits in first 10 days)
Source: IRI Consumer Network™, Total US – All Outlets, 26 WE 12/27/2020
© 2021 Information Resources Inc. (IRI). Confidential and Proprietary. 20Spending by Category Also Varies Across the Month
% of SNAP Monthly Dollar Spend – Average Month / Total U.S. – All Outlets 1st Half of Month
2nd Half of Month
51% 48% 51% 52% 46% 52% 49% 53% 50%
49% 52% 49% 48% 54% 48% 51% 47% 50%
Food & Baking Beverage Breakfast Desserts Dinner Beverage Lunch Snacks
Beverage Alcohol*
Source: IRI Consumer Network™, Total US – All Outlets, 26 WE 12/27/2020 / *Cannot use SNAP dollars for Beverage Alcohol
© 2021 Information Resources Inc. (IRI). Confidential and Proprietary. 21At a High Level, SNAP Shoppers Are Not as Deal-Driven
Since They Do Not Purchase on Promotion as Often
The Dollars SNAP Shoppers Spend on Promoted Products Under Index
Across Some Channels, With the Dollar Channel a Notable Exception
Dollar Sales on Promotion Dollar Index (Including Manufacturer Coupons)
84 91 82 115
74 Index Index Index Index
Index
Total U.S. Total U.S. Select Total U.S. Total U.S.
SNAP Shopper vs. Grocery Mass Drug Dollar
Non-SNAP Shopper
Source: IRI Consumer Network™, Total US – All Outlets, 26 WE 12/27/2020 - Dollar Sales on Promotion Dollar Index* vs. Non-SNAP
© 2021 Information Resources Inc. (IRI). Confidential and Proprietary. 22As Income Decreases, So Does the Percentage of
Dollars Sold on Promotion, Suggesting Lower Income
Households Buy on Need and Can’t Wait for a Sale
% of Dollar Sales on Promotion / Total Food & Beverage / Total U.S. – All Outlets
55% 23 21
20
of SNAP 20
19 19
Households
Have Income 16
Less Than
$25K
$100K+ $70-99.9K $50-69.9K $35-49.9K $25-34.9K $15-24.9K Under $15K
HOUSEHOLD INCOME
Source: IRI Consumer Network™, Total US – All Outlets, 26 WE 12/27/2020
© 2021 Information Resources Inc. (IRI). Confidential and Proprietary. 23SNAP Purchases Represent 28% of Dollar and 17% of Mass Dollar Sales,
Making Lowest Price Value the Chief Quest for SNAP Shoppers
SNAP Household Dollar Share of Channel (Indexed to All Outlet Average)
Index 120+ (Skew Toward) Index 80 – 120 (Average) Index < 80 (Skew Away)
All Outlet 12.5
Dollar 28.1 225 Index
Mass/Supercenter* 16.5 133 Index
Drug 14.7 118 Index
GroceryX** 10.6 85 Index
Club 8.1 65 Index
*Total Food & Beverage excludes Produce, Deli and Bakery / *Walmart included in Channel Aggregate / **GroceryX excludes Walmart
Source: IRI Consumer Network™, Total US – All Outlets, 26 WE 12/27/2020
© 2021 Information Resources Inc. (IRI). Confidential and Proprietary. 24Dollar Channel’s Success With
SNAP Shoppers Can Be Tied
to the Type of Promotions
Offered Before Shoppers
Get to the Store, Such as
Weekly $5 Off Deals
© 2021 Information Resources Inc. (IRI). Confidential and Proprietary. 25The Dollar Channel Caters to SNAP Recipients by
Providing Better-for-You and Budget-Minded Recipe Ideas
This Is an Opportunity Other Channels Should Adopt
Source: www.dollargeneral.com
© 2021 Information Resources Inc. (IRI). Confidential and Proprietary. 26SNAP Households Followed the Trend of
Increased Online Purchasing During COVID-19
% Households Purchasing Food & Beverage on the Internet / Total U.S.
14.2 14.0 14.2 14.2
13.4 13.6 13.2
13.3 12.6 12.5
13.0 13.0
12.5 12.7 12.6
10.0 12.1 11.9 11.8 12.2 12.2
9.0 9.0
8.3
7.8 7.7
8.9
7.9 7.9
7.2 7.5 7.5
SNAP Households Non-SNAP Households
Source: IRI Consumer Network™, Total U.S. – Internet 4 WE 2/23/2020- 4 WE 12/27/2020
© 2021 Information Resources Inc. (IRI). Confidential and Proprietary. 27COVID-19 Accelerated the
SNAP Online Purchasing
Pilot, With 46 States and
the District of Columbia
Participating
ALDI, Amazon and Walmart
Amazon and Walmart
ALDI and Amazon
ALDI, Amazon, ShopRite, Walmart
ALDI, Amazon, Walmart, Wright’s Market
ALDI, Amazon, Walmart, Woods
ALDI, Amazon, Walmart, HEB
ALDI, Amazon, Carlie C’s, Walmart
Amazon, Fresh Grocer, ShopRite, Walmart
Walmart
Approved, Not Live
No Participation
Source: https://www.fns.usda.gov/snap/online-purchasing-pilot _as of 01/26/2021
© 2021 Information Resources Inc. (IRI). Confidential and Proprietary. 28Online Baskets Among SNAP Households Are More
Lucrative Than Baskets of Non-SNAP Shoppers
Dollars per Buyer for Internet – Total U.S.
$362
$295
$188
$163
SNAP Households Non-SNAP Households
26 WE 12-29-2019 26 WE 12-27-2020
Source: IRI Consumer Network™, Total US – Internet 26 WE 12/27/ 20 / *Total Food & Beverage excludes Produce, Deli and Bakery
© 2021 Information Resources Inc. (IRI). Confidential and Proprietary. 29Purchase Pivot
In Addition, SNAP Households Are Contributing a Greater Portion
of Food & Beverage Spend Online Than Non-SNAP Shoppers
% of Total Food & Beverage Purchased on Internet / Total U.S.
4 w/e Feb- 4 w/e Mar- 4 w/e Apr- 4 w/e May- 4 w/e Jun- 4 w/e Jul-12- 4 w/e Aug- 4 w/e Sep- 4 w/e Oct- 4 w/e Nov- 4 w/e Nov- 4 w/e Dec-
23-2020 22-2020 19-2020 17-2020 14-2020 2020 09-2020 06-2020 04-2020 01-2020 29-2020 27-2020
SNAP Households Non-SNAP Households
Source: IRI Consumer Network™, Total U.S. – Internet 4 WE 12-23-2020- 4 WE 12-27-2020
© 2021 Information Resources Inc. (IRI). Confidential and Proprietary. 30Top Food & Beverage Items Purchased Online by SNAP
Households Include Dinner, Snacks, Beverage Products
E-Commerce Platforms Can Be Used as an Opportunity to Educate Shoppers Based
on Occasion or Needs to Assist in Engaging and Retaining These SNAP Shoppers
Index to
Product
Non-SNAP HHs
In the next four weeks
19%
Dried Meat Snacks 123
Sports Drinks 121
Breath Fresheners 132
Side Dishes – Rfg 130
Juice / Drink Concentrate – SS 135 of SNAP participants
Meat – Rfg 143 indicated they would buy
Pasta – FZ 134
Non-Fruit Drinks – SS 128
most of their groceries online
Dinner Sausage 128 (either pickup or delivery)
Luncheon Meats 144 (183 index vs. total respondents)
Tea / Coffee – Rfg 129
Sugar 153
Source: IRI Consumer Network™, Total US – Internet 26 WE 12/27/2020 – % HH’s Buying - Above 120 Index
IRI Weekly Surveys among IRI Consumer Network™ Panel representing Total U.S. Primary Grocery Shoppers – Wave 24 (1/8-1/10)
© 2021 Information Resources Inc. (IRI). Confidential and Proprietary. 31Ease of Online – The behaviors consumers adopt as SNAP recipients will
stick as they emerge from program participation. Support them with list-
building, promotions earlier in the month and by waiving online fees.
Innovation
Meal Solutions – Promote cook-from-scratch and healthy, affordable
Themes to
convenience meals. Demonstrate how products support specific health issues.
When possible, include the cost of the recipe or meal to feed a family of four.
Education and Optimization – Promote innovative ways to assist nutrition
Attract and assistance recipients on their financial and nutritional security journey.
Retailers can promote store tour videos that teach budget meal shopping.
Retain SNAP Pack Size Innovation – Package innovation can be just as important in a
recession as new products. Estimate the demand for lower price points of
small pack sizes as well as for larger, multi-serving sizes.
Participants Private Label – High-quality private brands are an important innovation
platform as retailers enhance their commitment to shoppers. Retailers should
promote their differentiated products to make them a destination for shoppers.
© 2021 Information Resources Inc. (IRI). Confidential and Proprietary. 32Mark Clouse Stuart Aitken Vivek Sankaran
President and CEO, Campbell Soup Company Chief Merchant & Marketing Officer, The Kroger Co. President & CEO, Albertsons Companies
November 10, 2020 September 3, 2020 August 25, 2020
© 2021 Information Resources Inc. (IRI). Confidential and Proprietary. 33IRI’s Latest CPG and Retail Insights Reports to Manage
the Impact of COVID-19 (click to see full report)
The Changing Shape of Discovering Pockets COVID-19 Emerging Recession Proof IRI COVID-19 Impact
the CPG Demand Curve of Demand Point of View Your Business Assessment Reports
14. Vitamins, Minerals, Supplements 3. Innovation for a Post- 5. COVID-19 Vaccine Update: 7. Defending and Recapturing 5. Anticipating Life After
13. America Is Ready for Football Pandemic World Impact on CPG Industry the Shelf COVID-19
12. Revenue Management 2. Harness Growth in 2021 4. Anticipated Vaccine Adoption & 6. Innovation Lessons From the 4. Consumers Provide a
Opportunities in a Pandemic 1. The Premium Opportunity Impact on the CPG Industry Great Recession to Apply Pessimistic View of Coming
11. Home for the Holidays 3. Potential Impact of Reduced Today Months
10. Powering the Future of Unemployment Benefit 5. Building Brands During 3. Tracking the Dramatic Pivot
Convenience Retail Changes on F&B Spending Recessionary Times of U.S. Consumer and
2. Consumer Stimulus, 4. Recessionary Lessons to Shopper Behavior
9. Reignite In-Store
Merchandising in Grocery Unemployment Benefit Apply to Private Label Today 2. Then and Now: Consumer
8. SNAP Benefits Spending & Shopping Behavior 3. How Big Brands Performed CPG Behavior During
1. The Impact of a Second Round During the Great Recession Economic Downturns
7. U.S. CPG Growth Leaders
of Stimulus on the CPG 2. Maintaining Pricing Discipline 1. COVID-19: Impact on CPG
6. E-Commerce
Demand Curve During a Recession and Retail
5. Boomers
4. A Global Perspective 1. How the Great Recession
Reshaped CPG Demand Curve
3. Tracking Transformation
2. Meat and Millennials
1. Anticipate the Future
© 2021 Information Resources Inc. (IRI). Confidential and Proprietary. 34CPG Economic Indicators
Access IRI’s industry-standard metrics for consumer product demand and supply
during the pandemic, our CPG inflation tracker and the latest data on category
trends, out-of-stock levels, consumer sentiment and more.
U.S. Demand Channel Shift E-Commerce
Demand Index™
Index™ Forecasts Index™ Demand Index™
Inflation Out-of-Stock Levels U.S. Topics from
Supply Index™
Tracker™ for Subcategories IRI Social Pulse™
The IRI CPG Demand Index™ provides a standard metric for tracking
changes in spending on consumer packaged goods.
U.S. Demand Index™ Forecasts are delivered through a proprietary,
fully automated forecasting solution that anticipates consumer demand.
Channel Shift Index™ provides a standard metric for tracking changes (migration)
in spending on consumer packaged goods across select channels.
The IRI E-Commerce Demand Index™ provides a standard metric for tracking changes
in spending on consumer packaged goods purchased online.
Inflation Tracker™ provides the well-known price per unit metric for tracking changes in pricing of consumer packaged goods.
Supply Index™ provides a standard metric for tracking changes in product availability (i.e., in-stock rates) in stores for consumer packaged goods.
Out-of-Stock Levels for Top-Selling Subcategories by Market Area in the U.S.
Top U.S. Topics from IRI Social Pulse™
© 2021 Information Resources Inc. (IRI). Confidential and Proprietary. 35Want to Be the First to Know?
www.iriworldwide.com/en-US/Insights/Subscribe
Registered Users Get New Thought Leadership
from IRI’s Research, Data & Analytics Experts
© 2021 Information Resources Inc. (IRI). Confidential and Proprietary. 36IRI Global Headquarters
CONTACT US 203 N. LaSalle St., Suite 1500
Chicago, IL 60601
FOR MORE IRI@IRIworldwide.com
+1 312.726.1221
INFORMATION Follow IRI on Twitter: @IRIworldwide
© 2021 Information Resources Inc. (IRI).
© 2021 Information Resources Inc. (IRI). Confidential
Confidential and
and Proprietary.
Proprietary. 37 37You can also read