OUR CITY, OUR SAFETY: One-Year Assessment Violence Reduction Plan 2022 - City of Chicago
←
→
Page content transcription
If your browser does not render page correctly, please read the page content below

One-Year Assessment

OUR CITY, OUR SAFETY:
   Violence Reduction Plan 2022

    Mayor’s Office of Public Safety
One-Year Assessment of the Our City, Our Safety Violence Reduction Plan 2022
                                     Mayor’s Office of Public Safety

Table of Contents

             n Executive Summary ......................................................... Pg. 3 – 4

             n Introduction ..................................................................... Pg. 5 – 7

             n Findings ........................................................................... Pg. 8 – 35

                 • Pillar 1: Empower and Heal People ............................ Pg. 8 – 14
                 • Pillar 2: Protect and Secure Places ............................ Pg. 15 – 24
                 • Pillar 3: Improve and Advance Policing ...................... Pg. 25 – 32
                 • Pillar 4: Affect Public Policy ........................................ Pg. 33
                 • Pillar 5: Plan and Coordinate ...................................... Pg. 34 - 35
             n Moving Forward .............................................................. Pg. 36

             n References ........................................................................ Pg. 37 – 38
One-Year Assessment of the Our City, Our Safety Violence Reduction Plan 2022
                                                                          Mayor’s Office of Public Safety

Executive Summary
With a backdrop of civil unrest and violence, Chicago’s Office of the Mayor released Our City, Our Safety: A Comprehensive Plan
to Reduce Violence in Chicago (OCOS) in September 2020, a plan for the City’s sustainable violence reduction work through 2023.
The City is building the necessary infrastructure and establishing policies and practices to reduce violence, as described by five
pillars (Figure 1): 1) Empower and heal people, 2) Protect and secure places, 3) Improve and advance policing, 4) Affect public
policy, and 5) Plan and coordinate.

Figure 1. Our City OurThis
                       Safety,  Fivelays
                           document   Pillars
                                         out theOf Violence Reduction
                                                 comprehensive plan for the City of Chicago’s violence reduction work through 2023,
                                          with the goal of sustainably reducing violence and making Chicago a city where everyone is and feels safe.

   Empower and Heal People                       Protect and Secure Places           Improve and Advance Policing               Affect Public Policy                   Plan and Coordinate

   Ensure that all residents can                Reduce the “safety gap” between       Increase police legitimacy in         Ensure that laws and policies that     Facilitate the development of
   pursue opportunities to thrive               safer communities and those most      communities where trust has           govern the city reflect the values,    realistic, actionable plans by
   without fear of violence by                  affected by violence by reclaiming    eroded by ensuring humane,            aspirations, and safety of residents   promoting alignment on strategy
   providing prevention and                     public places as safe spaces          effective, and constitutional law     by collaborating with stakeholders     and action among public, private,
   intervention supports that are               within communities and by             enforcement practices and by fully    to implement local policy, and         and community-based efforts to
   available to individuals of all ages         promoting community wellbeing         implementing the spirit and letter    advocate for state and federal         prevent and reduce violence, and
   and levels of risk. ■                        with stable housing, amenities,       of the consent decree and related     policy and legislation related to      by ensuring a citywide commit-
                                                                                                                                                                   ment to rigorous planning and
                                                commerce, and opportunities. ■        reforms. ■                            public safety and violence
                                                                                                                                                                   consistent coordination. ■
                                                                                                                            prevention, with a special focus on
   Increase capacity and service                                                                                            criminal justice reform, gun
   quality of gun violence, domestic                                                                                        regulation, and equitable quality of
                                                Invest in place-based programming     Acknowledge and remedy past                                                  Facilitate coordination among City
   violence, diversion, and victim                                                                                          life. ■                                departments and sister agencies
                                                and services                          harms between the Chicago Police
   services programs                                                                  Department and communities they
                                                                                      serve                                                                        Establish, facilitate, and participate
                                                Revitalize neighborhood                                                                                            in coordination tables, networks,
   Expand access to jobs and                    economies                                                                   Participate in local and national
                                                                                                                            collaboratives to elevate policy       and coalitions
   housing for those impacted by                                                      Deliver best practice reforms to
   violence                                                                                                                 positions
                                                                                      police policy and operations,                                                Utilize data to drive decision-making
                                                                                      consistent with the consent decree
                                                                                                                            Advocate for and support               Improve referral mechanisms and
   Expand supportive programming
                                                                                                                            equity-focused legislation and         linkages for programs and services
   for youth at highest risk of violence                                              Improve workforce management          policy
   involvement                                                                        including officer wellness,
                                                                                      recruitment, hiring, retention, and                                          Establish and promote
                                                                                      promotion                             Collaborate with State and County      standardized practices to improve
   Increase knowledge of services                                                                                           partners to align and coordinate       coordination among partners
   through public awareness                                                                                                 policy efforts
   campaigns in communities of need                                                   Assess the types of needs where                                              Provide needed technical support
                                                                                      police may need additional training                                          to grow capacity for partners and
                                                                                      and/or rely on other resources as                                            providers
                                                                                      first or co-responders
                                                                                                                                                                   Engage community in decision and
                                                                                                                                                                   policy making

                                                                                          Outcome Indicators
         The “Safety Gap” – the difference in rate of shootings and homicides in community areas with highest and lowest levels, while not decreasing safety in safer community areas.
         Number of serious victimizations (fatal and non-fatal shootings) and reported violent crimes (victim and incident counts)
         Community perception of safety, trust in law enforcement, and connectedness with City government

With this comprehensive framework, the City addresses violence as a preventable public health crisis which can be treated through
deliberate, coordinated, and sustained efforts, acknowledging that we must focus on individuals, communities, and systems
collectively in order to reduce violence. This public health approach represents a shift from a traditional criminal suppression model
for addressing violence to a more holistic, prevention-based approach. Therefore, the Community Safety Coordination Center
(CSCC) was established in August 2021 to coordinate a comprehensive approach for addressing the root causes of community
violence by implementing near- and long-term strategies to rebuild the physical environment, create a thriving economy, and
support residents in addressing their individual and family needs.

                                                                                                     03
One-Year Assessment of the Our City, Our Safety Violence Reduction Plan 2022
                                           Mayor’s Office of Public Safety

Executive Summary
Building upon the five pillars of the OCOS, the CSCC acts as the center for strategic coordination of violence prevention and
reduction activities, rapidly responding to the resource needs of community, and acting as the nerve center for data and
information on community violence. The CSCC framework, as shown in Figure 2, is not a departure from the five pillars of OCOS,
but an implementation process for those pillars. Moving forward, utilizing the CSCC framework will enable us to hold ourselves
accountable to empowering and healing people; protecting and securing places; improving and advancing policing; affecting
public policy; and planning and coordinating to enhance community safety.

Figure 2. Community Safety Coordination Center Framework

             Community Safety as a Public Health Framework
              Levels of Intervention                     Description
SMALLEST
population    Crisis                                  Crisis systems response to occurence of violence after prevention and
impacted,     Response                                intervention efforts to promote healing and prevent reoccurence
GREATEST
individual
effort        Support for Individuals                 Holistic services that support individuals at risk, survivors of violence,
              and Families At-Risk                    and their families in order to prevent occurences of violence

              Community                               Targeted place-based efforts to revitalize and reinvest in neighborhoods
              Revitalization &                        that have historically been disinvested to reduce poverty and poor health
              Reinvestment                            outcomes, and build community resilience, wealth, and wellness
LARGEST
population
impacted,
LEAST
              Systemic                                Initiatives to reform and transform systems, institutions, and culture to
individual    Transformation                          enable opportunity and address systemic racism
effort

              ENABLERS (across all interventions): community-based, data-driven, evidence-based, coordinated

                                                             04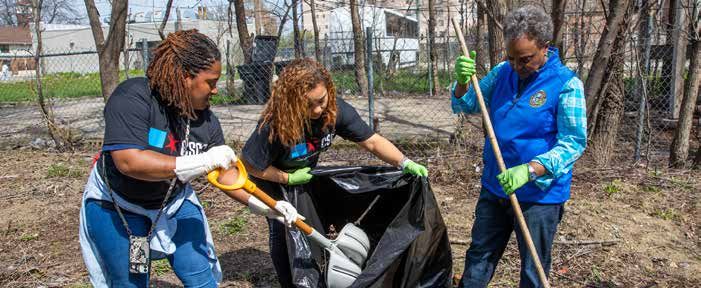
One-Year Assessment of the Our City, Our Safety Violence Reduction Plan 2022
Mayor’s Office of Public Safety
Introduction
Violence in Chicago has been historically concentrated in the West and South sides, disproportionately affecting communities of
color. As a point of emphasis, the OCOS violence reduction plan aims to prioritize violence reduction efforts in the 15 community
areas most affected by violence over the three-year period 2018-20 (“priority community areas”), as defined by the City as “serious
victimizations” (homicides and non-fatal shootings). These 15 communities, as highlighted in Figure 3, are (alphabetically):
Auburn Gresham, Austin, Chatham, Chicago Lawn, East Garfield Park, Englewood, Greater Grand Crossing, Humboldt Park, North
Lawndale, Roseland, South Lawndale, South Shore, West Englewood, West Garfield Park, and West Pullman.1 The table in Figure 3
shows the average annual rate per 100,000 residents for homicides and non-fatal shootings during the baseline three-year period.
Figure 3. Violence Reduction Priority Communities as Defined by Serious Victimization
9 1
2
12
Serious Victimization are Defined by
10 13
77 Homicides + Non-Fatal Shootings
11
76 4
14 3 2018-2020
16
Community Area 3-year Average,
15
17 5 Rate per 100,000
6
21
Austin 314.7
18 19
20 22 7 North Lawndale 193.7
Humbold Park 170.3
24 West Garfield Park 167.7
23 8
25 Englewood 142.7
Auburn Gresham 138.7
26 27 32
28 West Englewood 133.3
29
Greater Grand 128.7
33 Crossing
31 34
Roseland 128.0
30 60 35 East Garfield Park 127.7
59 South Shore 122.0
36
58 Chicago Lawn 96.7
57 38
61 37 39 South Lawndale 95.7
63 41 Chatham 94.3
56 62 40
West Pullman 83.3
64 68 42
67
65 66
69 43
70 71 45
44 46
47 48
72 73
49 50 52
74 51
75
53
55
54
A pattern of socioeconomic inequity has historically been a major driver of crime and violence in Chicago. As the first year of the
OCOS violence reduction plan comes to a close, recognizing these inequalities is essential to shaping the future of public safety
discourse in the City. To achieve meaningful and long-lasting improvements to our community safety, we will need to address
socioeconomic barriers, particularly in our most violent neighborhoods.
05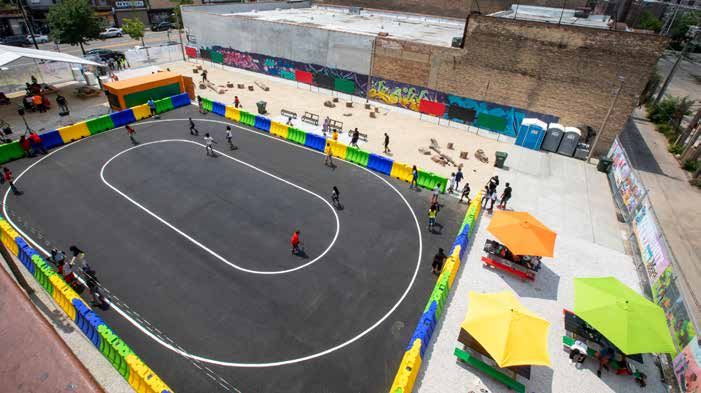
One-Year Assessment of the Our City, Our Safety Violence Reduction Plan 2022
                                              Mayor’s Office of Public Safety

Introduction
Furthermore, there are challenges with disentangling and estimating the effects of COVID-19 on public safety and increasing
violence in Chicagoland during the last two years (i.e., 2020 and 2021). As seen on a national level, the pandemic has placed
a significant economic burden on neighborhoods, particularly those that were already experiencing lower economic activity
and prosperity. Chicago and many other large metropolitan cities began to experience increases in violence in the wake of
the pandemic.2 For instance, from the start of Illinois’ Stay at Home Order in March 2020 to early August 2020, the number of
shooting victims in Chicago increased 43% as compared to the same period averaged over the previous three years. Increases in
shootings and other violent incidents were are also experienced in other cities such as New York, Los Angeles, and Philadelphia.3,4
It is difficult to pinpoint the exact cause as several factors played key roles, such as the economic hardships and increasing
unemployment rates due to the COVID-19 pandemic; closure of schools, after-school, and summer programs; and the civil unrest
and the challenged relationships between communities and the police following the police murder of George Floyd in Minneapolis.
We will follow the evolving research on the impact of the COVID-19 pandemic on crime and the factors driving the surge in violent
crime, and develop evidence-based and data-driven policies in response.

This report represents an effort to better understand the state of violence in Chicago in the year and a half timeframe since
the OCOS violence reduction plan was introduced by the Office of the Mayor while considering all the mentioned challenges.
To achieve this goal, this report provides an assessment of several public safety-related measures which are indicative of the
strategic initiatives embedded within the five OCOS pillars.

l Methodology

The Mayor’s Office of Public Safety formed a Public Safety Research Advisory Council comprised of university representatives
from Chicago with expertise in violence reduction to assist in evaluation efforts for the OCOS strategy. Together, the Council
identified indicators to measure progress in each OCOS pillar, as shown below. The Mayor’s Office of Public Safety worked with
departments and agencies from City government to collect the data and information used in the OCOS findings. These agencies
include Chicago Police Department, Chicago Department of Public Health, Department of Family and Support Services, Office of
Emergency Management and Communications, City Colleges of Chicago, Chicago Public Schools, and other partners around the
City (Figure 4).

Figure 4. OCOS Indicators and Data Sources

 Indicator                      OCOS Pillar                    Data Source

 Incident Violent Crimes,
 Property Crimes, Violent/      Empower and Heal People        Chicago Data Portal Crimes Dataset
 Domestic Crimes

 Violent Crime Victimization    Empower and Heal People        Chicago Data Portal Violence Reduction Dataset

 Serious Victimization          Empower and Heal People        Chicago Data Portal Violence Reduction Dataset

                                                               Office of the Mayor, University of Chicago Crime Lab, Chicago
 Youth Programs                 Empower and Heal People        Department of Family and Support Services, City Colleges of Chicago,
                                                               Chicago Public Schools
 Street Outreach,
                                Empower and Heal People        Chicago Department of Public Health
 Referrals to Victim Services

 Narcotics Diversion (NADP)     Empower and Heal People        Chicago Police Department

 Healthy Chicago Survey Items   Protect and Secure Places      Chicago Department of Public Health, Healthy Chicago Survey

 Calls for Service
                                Protect and Secure Places      Chicago Office of Emergency Management and Communications
 (911 and 311 Call Data)

                                                                06
One-Year Assessment of the Our City, Our Safety Violence Reduction Plan 2022
                                              Mayor’s Office of Public Safety

Introduction
Indicator                       OCOS Pillar                    Data Source

Police Perceptions -
                                Improve and Advance Policing   Chicago Data Portal Police Sentiment Scores Dataset via ZenCity
Trust and Safety Scores

Clearance Rate                  Improve and Advance Policing   Chicago Police Department

Guns Recovered/Turned-In        Improve and Advance Policing   Chicago Police Department

Crisis Intervention Training    Improve and Advance Policing   Chicago Police Department

City Initiatives and
                                Affect Public Policy           Office of the Mayor
Investments

Community Safety
                                Plan and Coordinate            Office of the Mayor, Community Safety Coordination Center
Coordination Center

                                                                07
One-Year Assessment of the Our City, Our Safety Violence Reduction Plan 2022
                                                                                                                        Pillars (ICONS)
                                               Mayor’s Office of Public Safety

Findings                                            PILLAR #1 Empower and Heal People

                                                                                                                          PILLAR #1:                  PILL
In order to empower and heal our citizens, we must ensure that all residents can pursue opportunities to thrive Empowerwithout    fear of
                                                                                                                        and Heal People        Protect and
violence by providing prevention and intervention supports that are available to individuals of all ages and levels of risk. Indicators
associated with this pillar include violent crime incidents; violent crime victimization;5 domestic violence incidents; serious
victimization (fatal and non-fatal shootings); recidivism (as measure by re-arrest); youth engaged in various supportive programs;
individuals engaged by street outreach and victim services; individuals diverted from the criminal justice system; and re-entering
residents.

As a point of departure, crime incidence was measured using data for what are commonly known as index crimes, representing        PILLAR #4:
                                                                                                                              Affect Public Policy
the most serious violent and property offenses. Violent index crimes include aggravated assaults, aggravated batteries, criminal
sexual assaults, homicides, and robberies. Property index crimes include arsons, burglaries, motor vehicle thefts, and thefts. Due
to the unprecedented events of 2020 (i.e., global pandemic and civil unrest), we separated the pandemic years (2020 and 2021)
from the previous years. Hence, in this section 2020 and 2021 numbers are compared to the 2018-2019 average separately.

Compared to the 2018-2019 average, Chicago experienced increases of incidence for aggravated assault and homicide in 2021.
However, compared to the 2018-2019 average decreases were observed for aggravated battery, criminal sexual assault, and
robbery in 2021 (Figure 5). For property crimes, compared to the 2018-2019 average, there were increases in incidence of arsons
and motor vehicle thefts, and decreases for burglaries and thefts in 2021 (Figure 6).

Figure 5. Incident Violent Index Crimes by Type, 2018-2021

                                      Incident
                                        IncidentViolent   IndexCrimes,
                                                 Violent Index   Crimes,  2018-2021
                                                                       2018-2021
10,000
                                       8,676 8,802 8,572                                                               8,837
 9,000
                                                                                                                               7,853 7,923
 8,000                     7,325
 7,000       6,160 6,432
 6,000
 5,000
 4,000
 3,000
                                                                 1,657
 2,000                                                                   1,215 1,446
                                                                                                554     791      805
 1,000
     0
            Aggravated Assault        Aggravated Battery       Criminal Sexual Assault                Homicide             Robbery

                                                       2018-2019 Average     2020        2021

                                                                   08
One-Year Assessment of the Our City, Our Safety Violence Reduction Plan 2022
Pillars (ICONS)
Mayor’s Office of Public Safety
Findings PILLAR #1 Empower and Heal People
PILLAR #1: PILL
Figure 6. Incident Property Index Crimes by Type, 2018-2021 Empower and Heal People Protect and
IncidentProperty
Incident PropertyIndex
Index Crimes,
Crimes, 2018-2021
2018-2021
70,000 63,868
60,000
50,000
41,259 40,413 PILLAR #4:
40,000 Affect Public Policy
30,000
20,000
10,692 8,751 9,479 9,950 10,554
10,000 6,648
374 588 522
0
Arson Burglary Motor Vehicle Theft Theft
2018-2019 Average 2020 2021
Rates of reported incidents of domestic violence (which are included among the violent index crimes, but also include simple
assaults and batteries) slightly increased in 2021 (10.74 per 1,000 compared to previous 3-year average of 10.49 per 1,000). It is
important to note that this is the rate for the reported domestic violence incidents, not all domestic violence incidents as many
of these incidents go unreported.6 Furthermore, there was a significant shift in how survivors of domestic violence sought help.
Compared to the 2018-2019 average, there was a slight increase (0.6%) in calls for help to Illinois Domestic Violence Hotline in
Chicago. This change was more pronounced in 2021, where the calls for help to the Illinois Domestic Violence Hotline in Chicago
increased by 6.2% compared to 2018-2019 average (Figure 7).7
The rise in domestic violence calls to hotlines was consistent with a national - even global - pattern of a rise in domestic and
intimate partner violence due to social isolation and restrictions posed by the pandemic.8
Figure 7. Domestic Violence Call For Service by Type, 2018-2021
Percentage Change
Percentage of Domestic
Change Violence
of Domestic ViolenceCalls in2020
Calls in 2020 and
andCompared
2021 2021 Compared to 2018-2019Average
to 2018-2019 Average
7.0% 6.2%
6.0%
5.0%
4.0%
2.7%
3.0%
2.0%
1.0% 0.6%
0.1%
0.0%
2020 Percentage Change From 2018-2019 AVG 2021 Percentage Change From 2018-2019 AVG
IL DV Hotline (Chicago) CPD DV Call for Service
09
One-Year Assessment of the Our City, Our Safety Violence Reduction Plan 2022
                                                                                                                                                                                                     Pillars (ICONS)
                                                                             Mayor’s Office of Public Safety

Findings                                                                           PILLAR #1 Empower and Heal People

                                                                                                                                                                                                          PILLAR #1:                             PILL
Regarding violent crime victimizations during the 2018-21 period, there were increasing trends for aggravated     assault,
                                                                                                               Empower       non-fatal
                                                                                                                       and Heal People                                                                                                    Protect and
shootings, vehicular hijacking, and fatal shootings, and decreasing trend for robberies, non-shooting homicides and aggravated
batteries (Figure 8). In 2021, 30% of all aggravated assault and 50% of all aggravated battery victims were domestic violence
victims. Overall, domestic violence victimization accounted for 22% of all violent crime victimization in 2020 and 2021.9

Figure 8. Violent Crime Victimization, 2018-2021
(Victimization is a unique event during which an individual becomes the victim of a crime. An individual may be victimized
multiple times, and each of those events would be depicted in the data as distinct victimizations)                       PILLAR #4:
                                                                                                                                                                                                                           Affect Public Policy

                                             Trends of Trends
                                                       Serious       Violent
                                                              of Serious          Crime
                                                                         Violent Crime       Victimizations,
                                                                                       Victimizations, 2018-21 2018-21
3,000

2,500

2,000

1,500

1,000

 500

   0
        Jan-March     April-June      Jul-Sept    Oct-Dec     Jan-March     April-June      Jul-Sept       Oct-Dec      Jan-March    April-June       Jul-Sept      Oct-Dec      Jan-March   April-June      Jul-Sept   Oct-Dec

               Incident Violent Index Crimes, 2018-2021
                               2018                                                  2019                                                     2020                                                    2021

                    Aggravated Assault                      Aggravated Battery                         Fatal Shooting                             Non-Fatal Shooting                     Non-Shooting Homicide
                    Robbery                                 Vehicular Hijacking                        Linear (Aggravated Assault)                Linear (Aggravated Battery)            Linear (Fatal Shooting)
                    Linear (Non-Fatal Shooting)             Linear (Non-Shooting Homicide)             Linear (Robbery)                           Linear (Vehicular Hijacking)

Another indicator to measure our progress in empowering and healing all Chicagoans affected by violence is assessing the rate
of re-arrest to approximate trends of recidivism. In 2021 in Chicago, the rate of re-arrest for violent index crimes within 12, 24, and
36 months of a previous arrest was 30.0%, 44.2%, and 52.4%, respectively (i.e., in 2021, 30.0% of individuals arrested for a violent
index crime had been arrested for a crime within the 12 months prior). Generally, these re-arrest rates were stable during 2018-21,
with a slight reduction observed in 2021 compared to 2020 (Figure 9).

                                                                                                               10
One-Year Assessment of the Our City, Our Safety Violence Reduction Plan 2022
Pillars (ICONS)
Mayor’s Office of Public Safety
Findings PILLAR #1 Empower and Heal People
PILLAR #1: PILL
Figure 9. Rates of Re-Arrest for Violent Crimes Within 12, 24, and 36 Months of Previous Arrest, 2018-2021 Empower and Heal People Protect and
Re-arrest
Re-arrestRates
RatesViolent Crimes,
Violent 2018-21
Crimes, 2018-21
70.0
65.0
60.0 54.1 54.7
52.4
55.0
Re-arresr Rate
PILLAR #4:
52.4 Affect Public Policy
50.0
45.0 47.9 44.2
45.8 48.6
40.0
35.0
37.4
30.0 35.0 36.9 30.0
25.0
20.0
2018 2019 2020 2021
12-Month Rate 24-Month Rate 36-Month Rate
While the statistics demonstrated thus far mostly show an increasing trend in violent crimes‑consistent with other major cities,
the City has dedicated millions of dollars and administers several programs for prevention and intervention supports for both
youth and adults at the highest risk of involvement in violence.
The City has implemented several programs which offer support services tailored towards youth. These programs can help
mitigate exposure to neighborhood violence and help youth avoid involvement in the criminal justice system. In spite of the
pandemic, several youth programs in Chicago continued to operate with success in their primary prevention efforts:
•mentoring
The Choose to Change program (C2C) is a six-month intervention that offers youth intensive wraparound and professional
services that focus on addressing each young person’s specific needs, with trauma-informed cognitive behavioral
therapy that helps youth process their trauma and develop a new set of decision-making tools. In 2021, the number of youth
enrolled in the program increased by 47%, from 444 youth enrolled in 2020 to 654 youth in 2021.
•data,
According to mid-study report data released by the University of Chicago Education and Crime Labs that examined 2015-2019
C2C has positive impacts on youth both in the short- and longer-term. Youth enrolled in the program were found to have 48%
fewer violent-crime arrests than their control peers while enrolled in the program, 38% fewer violent-crime arrests a year and a half
after program completion, and 33% fewer violent-crime arrests two and a half years after the program ends.10
•theirTheself-efficacy,
Service Coordination and Navigation (SCaN) program model seeks to stabilize eligible youth in their environment, increase
and assist in their transition to adulthood by offering employment and education supports. In 2021, SCaN had
an active enrollment of 652 majority young adult Black males enrolled in the program. The City is currently collecting data and
evaluating the long-term outcomes of the SCaN program which will be provided in future reports.
•a new
The Office of the Mayor, Chicago Police Department, and Department of Family and Support Services are currently developing
youth diversion model to replace current processes that is aimed at being respectful, equitable, trauma-informed, and data-
driven, resulting in positive outcomes for youth, families, and communities. This work is being supported with $10M in funding
from the Chicago Recovery Plan (CRP).
11One-Year Assessment of the Our City, Our Safety Violence Reduction Plan 2022
Pillars (ICONS)
Mayor’s Office of Public Safety
Findings PILLAR #1 Empower and Heal People
PILLAR #1: PILL
Programs for adults in Chicago have centered on implementing a trauma-informed approach for helping those Empowerwho arePeople
and Heal at the Protect and
greatest risk for violence exposure. Additionally, policy measures have been taken to offer diversionary options for individuals
experiencing substance use disorders, and for returning citizens:
•have
As part of Metropolitan Family Services’ network (MFS), Communities Partnering 4 Peace (CP4P) street outreach organizations
11
been actively working to quell unrest in several of Chicago’s community areas on the south and west sides. In 2020, Chicago
12
Department of Public Health funded street outreach organizations under MFS in 17 community areas for a total of $6,500,00013,
and several non-MFS victim services organizations serving 11 communities14 for a total of $1,500,000. These investments were PILLAR #4:
Affect Public Policy
expanded in 2021, with MFS-led street outreach receiving $12,475,000, victim services receiving $2,475,000, and new independent
street outreach programs being onboarded at $2,000,000 to serve 6 additional communities15. The impact of increased funding
can be seen in the significant increases in the number of individuals referred to and enrolled in mental/behavioral health services,
as well as those who received victim services. There was a decrease in the number of individuals connected to services by street
outreach due to changes in the partnership with a subcontractor.16 Furthermore, this particular indicator (individuals connected to
services) accounts for the number of newly enrolled street outreach participants. This means that in 2020 there were 680 and in
2021 there were 248 newly connected street outreach participants, but, over the course of the 2020-2021 period, approximately
900 individuals were connected to services (Figure 10).
Figure 10. Street Outreach and Victim Services, 2020-2021
Street
StreetOutreach andVictim
Outreach and VictimServices,
Services, 2020-2021
2020-2021
6000
5,111
5000
4000
3000
2000 1,550
921
1000 456 680
170 390 368
0
Referred for BH/MH Services Enrolled for BH/MH Services Connected to Services by Street Received Victim Services
Outreach
2020 2021
The Northwestern Neighborhood and Network Initiative (N3) at the Northwestern University’s Institute for Policy and Research
is currently performing an evaluation of the impact of street outreach on violence in Chicago.17 Their preliminary results shows
that CP4P successfully locates high-risk populations and potentially increases educational and employment opportunities while
reducing the risk of gun violence involvement for the participants.18
12One-Year Assessment of the Our City, Our Safety Violence Reduction Plan 2022
Pillars (ICONS)
Mayor’s Office of Public Safety
Findings PILLAR #1 Empower and Heal People
PILLAR #1: PILL
Additional preventive and diversionary measures have been implemented by the City such that the burden placed onand
Empower theHeal
individual
People Protect and
and criminal legal system may be minimized.
•drugIn 2016, the Chicago Police Department and the High Intensity Drug Trafficking Areas (federal law enforcement focused on
trafficking) partnered with the community healthcare provider Thresholds, and the University of Chicago Crime Lab and
Health Lab to design, test, and scale the Chicago Police Department Narcotics Arrest Diversion Program (NADP), a police-led drug
deflection program that offers substance use treatment in place of formal criminal justice system processing. NADP is a citywide
program first piloted in the community areas in the City’s west side. The program seeks to address the root cause of opioid and PILLAR #4:
Affect Public Policy
other substance use by providing a supportive - rather than punitive - intervention for individuals with substance use disorders.
City-wide data on NADP is available starting August 2020. From August to December 2020, 78 individuals were served by NADP,
compared to 309 in 2021. Looking into the 2018-2020 data where the program was active only in districts 10, 11, 15, and 25, Crime
Lab found that the program reduces the time officers spend on processing low-level drug offenses, decreases the likelihood of
re-involvement with the criminal justice system, connects individuals with substance use disorders to treatment, and improves
public safety.19
•(SIR)
The City Colleges of Chicago have implemented programs funded through legal cannabis sales-tax revenue, including Still I Rise
and Roots of Success (ROS). The goal of SIR is to prevent violence by providing wraparound services and free education
and certification to individuals with violence involvement who have cannabis records, allowing them to obtain a living wage job in
the legal cannabis market. ROS is an environmental literacy program that will be a pipeline into the SIR program. The Spring 2021
SIR pilot cohort concluded in August 2021, with 10 of the 11 students completing the program. ROS training was offered at Olive-
Harvey College and community partner locations in Fall 2021. Six of the 11 participants completed the program and received their
certificates of ROS completion.
•to Inimplement
2021, the City Colleges of Chicago, Richard J. Daley College partnered with the Inner-City Muslim Action Network (IMAN)
the Weekend Warriors program. The program aims to positively engage returning residents and at-risk individuals
on the weekends by offering students quality college-level instruction, career services, behavioral health therapy, individual case
management, artistic programming, select weekend excursions, transportation support, meals, and weekly stipends.
•Residents
Beginning in early 2021, the Office of the Mayor and various partner organizations convened a Working Group on Returning
to discuss the challenges faced by Chicagoans returning from jail or prison, and to propose recommendations for how
the City could address those challenges. The goal of this Working Group was to understand the ways in which the City has tried
to support returning residents in the past, recognize where it has been successful, acknowledge where it has fallen short, and look
to best practices around the country for a path forward to meaningfully improve the life outcomes of returning residents. These
efforts culminated in the successful creation of a Chicago Interagency Reentry Council, a full-time Director of Reentry position
in the Office of the Mayor, and increased investments for services which serve returning residents in the City of Chicago 2022
Budget.
13One-Year Assessment of the Our City, Our Safety Violence Reduction Plan 2022
Pillars (ICONS)
Mayor’s Office of Public Safety
Findings PILLAR #1 Empower and Heal People
PILLAR #1: PILL
Additionally, the City has invested millions of dollars in services that promote safety and well-being of all Chicagoans.
Empower and Heal People Protect and
•long-term
$10M from the CRP has been dedicated to support victim services, increasing support to organizations who provide direct,
services to victims of crime and their loves ones. Supporting families in the immediate aftermath of a violence crime
is critical. Victim services teams across Chicago provide supports such as assistance with funeral planning, applying for crime
victim compensation, grief counseling, and other mental health supports, addressing safety concerns, and providing support for
an array of practical and essential needs.
PILLAR #4:
• The Mayor’s 2022 budget includes $25M in new investments that support survivors of gender-based violence and human
trafficking, including $5M in funding for young people who have witnesses or experienced violence at home. The investments
Affect Public Policy
would provide emergency financial assistance, legal services, housing, services for young people, and prevention education efforts.
14One-Year Assessment of the Our City, Our Safety Violence Reduction Plan 2022
Mayor’s Office of Public Safety
Pillars (ICONS)
Findings PILLAR #2 Protect and Secure Places
PILLAR #1: PILLAR #2: PILL
The City is placing emphasis on making communities most affected by violence safer by reclaiming
Empower public places
and Heal People Protectas
andsafe
Securespaces
Places Improve and A
within communities by promoting community well-being with stable housing, amenities, commerce, and opportunities. Indicators
associated with this pillar include community perception of resource accessibility and safety; 311 requests for public safety-
related services; 911 calls related to violence; the safety gap; vacant lot restoration; and infrastructure improvements.
Understanding community perceptions of safety and resource accessibility will be a crucial first step in advancing the ability
to protect and secure places in Chicago. Assessment of these perceptions was measured using data provided by the Chicago
Department of Public Health from the community-based survey, Healthy Chicago Survey, 2020 (Figures 11-13).
PILLAR #4: 20
Affect Public Policy
Items fromPlan
thePILLAR #5:
and Coordinate
survey were demarcated into several neighborhood constructs, including:
Safety:
- “Do you feel safe in your neighborhood?”
- “In your neighborhood, how often does violence occur?”
Institutional Trust:
- “To what extent do you trust local government to do what’s right for your community?”
- “To what extend do you trust your local government to do what’s right for your community”
Resource Accessibility:
- “It is easy to walk, scoot or roll to a transit stop (bus, train) from my home”
Examining responses from these survey items from a city-wide level, while instructive, may tell an incomplete story of public
perceptions of safety, institutional trust, and resource accessibility among specific populations and communities. For instance,
when compared to other racial/ethnic groups, non-Latinx Black/African Americans report the lowest trust of law enforcement, and
lowest perceived neighborhood safety, but similar rates of exposure to violence as non-Latinx Whites. Gathering more data for the
next few years will be essential in achieving a more complete picture and understanding of community perception of resource
accessibility and safety. The Office of the Mayor will continue to work with Healthy Chicago Survey to achieve this goal.
15One-Year Assessment of the Our City, Our Safety Violence Reduction Plan 2022
Mayor’s Office of Public Safety
Pillars (ICONS)
Findings PILLAR #2 Protect and Secure Places
PILL
Figure 11. Perception of Safety by Race/Ethnicity, Health Chicago Survey, 2020 PILLAR #1:
Empower and Heal People
PILLAR #2:
Protect and Secure Places Improve and A
Do you feel safe in your neighborhood?
Do you feel safe in your neighborhood? Yes all/most of the
Yes all/most of the time
time
90 84
80 74 PILLAR #4: PILLAR #5:
70 65 64 Affect Public Policy Plan and Coordinate
56
60
Percentage
49
50
40
30
20
10
0
Total White, non- Black, non- Asian/PI, non- Non-Latinx, Latinx
Population Latinx Latinx Latinx Other or
multirace
In your
In your neighborhood,
neighborhood, how often
how often does violence
does violence occur?occur?
(Once
(Once a year
a year or so/not
or so/not at All)at All)
45
39
40
35
30 28
Percentage
25 23 23
21 21
20
15
10
5
0
Total White, non- Black, non- Asian/PI, non- Non-Latinx, Latinx
Population Latinx Latinx Latinx Other or
multirace
16One-Year Assessment of the Our City, Our Safety Violence Reduction Plan 2022
Mayor’s Office of Public Safety
Pillars (ICONS)
Findings PILLAR #2 Protect and Secure Places
PILLAR #1: PILLAR #2: PILL
Figure 12. Perception of Institutional Trust by Race/Ethnicity, Health Chicago Survey, 2020
Empower and Heal People Protect and Secure Places Improve and A
Towhat
To whatextent
extentdodoyou
youtrust
trust local
local government
government to do
to do what’s
what’s
rightfor
right foryour
yourcommunity?
community? (A(A great
great extent/somewhat)
extent/somewhat)
70
58
60 53 PILLAR #4:
Affect Public Policy
PILLAR #5:
Plan and Coordinate
47 48
50
40
percentage
37
40
30
20
10
0
Total White, non- Black, non- Asian/PI, non- Non-Latinx, Latinx
Population Latinx Latinx Latinx Other or
multirace
Towhat
To whatextent
extentdodoyou
youtrust
trust your
your law
law enforcement
enforcement agency?
agency?
(A(Agreat
greatextent/somewhat)
extent/somewhat)
80 71
68
70
60 56 55
46
Percentage
50 42
40
30
20
10
0
Total White, non- Black, non- Asian/PI, non- Non-Latinx, Latinx
Population Latinx Latinx Latinx Other or
multirace
17One-Year Assessment of the Our City, Our Safety Violence Reduction Plan 2022
Mayor’s Office of Public Safety
Pillars (ICONS)
Findings PILLAR #2 Protect and Secure Places
PILL
Figure 13. Perception of Resource Accessibility, Health Chicago Survey, 2020 PILLAR #1:
Empower and Heal People
PILLAR #2:
Protect and Secure Places Improve and A
It isPerception of Resource
easy to walk, Accessibility
scoot or roll to a transitbystop
Race/Ethnicity,
(bus, train)
Healthy Chicago Survey, 2020
from my home (Strongly agree/agree)
88 87
86 84 PILLAR #4: PILLAR #5:
84 Affect Public Policy Plan and Coordinate
82 81
79
Percentage
80
78 77
76
76
74
72
70
68
Total White, non- Black, non- Asian/PI, non- Non-Latinx, Latinx
Population Latinx Latinx Latinx Other or
multirace
In order to address the institutional trust in government and ensure safety of Chicagoans in their neighborhoods, the City of Chicago
implemented a new approach in summer 2021. The Summer Safety Strategy (SSS) was a holistic strategy to address community
safety at a hyperlocal level. The SSS approach involved a) identifying the most violent police beats across the city, b) convening
local leaders and service providers along with key city departments, and c) targeting the remediation of “hot” issues on a weekly
basis. Coordination included maintaining City department presence through City service blitzes, tailored police deployments
that included proactive engagement such as foot patrols and community safety walks, and collaboration with community-based
organizations to provide services to community members. For instance, the Chicago Department of Transportation made sure to
provide adequate lighting in hotspots, Department of Streets and Sanitation cleaned and cleared vacant lots, and the Department
of Business Affairs and Consumer Protection provided additional security support for businesses.
Institutional trust and perception of safety may also be elevated by addressing the disproportionate amount of violence in
communities of color. For this reason, the concept and estimation of the “safety gap” is a key outcome for the OCOS plan. The
safety gap provides an indication of disparity between communities historically known to experience high levels of violence and
communities that historically have experienced relatively low levels of violence.
The safety gap was calculated by comparing the serious victimization (fatal and non-fatal shootings) rates for the 15 priority
community areas with the highest serious victimization rates to the remaining 62 community areas. These geographically based
rates per 10,000 residents21 were then compared annually between 2018 and 2021. (Figure 14). Using this methodology, the
safety gap has generally increased over time (particularly between 2018-19 and 2020-21), indicating an increasing disparity (i.e.,
difference) in serious victimizations between the 15 priority community areas compared to the remaining 62 community areas. In
other words, these 15 community areas have had higher rates of fatal and non-fatal shootings per 10,000 residents, than all other
62 communities combined.
18One-Year Assessment of the Our City, Our Safety Violence Reduction Plan 2022
Mayor’s Office of Public Safety
Pillars (ICONS)
Findings PILLAR #2 Protect and Secure Places
PILLAR #1: PILLAR #2: PILL
Figure 14. Safety Gap: Serious Victimization Rate per 10,000 Residents in the 15 Priority Communities
Empower and Heal People Compared to the
Protect Remaining
and Secure Places Improve and A
SeriousSerious Victimization
Victimization Rate
Rate in in the 15 Priority
Community Communities
Areas per per
10,000, 2018-2021
10,000, 2018-2021
70
60 PILLAR #4: PILLAR #5:
Affect Public Policy Plan and Coordinate
15.78 12.80
50
40 21.56
17.56
Rates per 10,000
30
42.55 45.74
20
30.99 28.32
10
0
2018 2019 2020 2021
Axis Title
15 Priority Community Areas Other 62 Community Areas
The safety gap is a key indicator for long-term progress of our violence reduction strategy in Chicago. During 2020-21, many of
the neighborhoods most affected by violence were also managing the challenges associated with COVID-19, which could partially
explain the widening of the safety gap. A continued commitment to vigilant monitoring of geographic disparities in violence is a
primary point of emphasis for the City.
Calls for service are an additional indicator that can potentially help shed light on trends of violence and public safety in Chicago.
However, these measures do have limitations, as research indicates that African Americans are less likely to call 911 for matters
of personal and public safety.22
There was a very slight decreasing trend of total 911 calls and 911 calls for violent crimes during 2018-21. Aggravated batteries
were the most common violent crime-related 911 calls, accounting for an average of 57.8% of all violent crime-related 911 calls
during this time span (Figure 15).
19One-Year Assessment of the Our City, Our Safety Violence Reduction Plan 2022
Mayor’s Office of Public Safety
Pillars (ICONS)
Findings PILLAR #2 Protect and Secure Places
PILL
Figure 15. Violent Crime 911 Calls by Type, 2018-2021 PILLAR #1: PILLAR #2:
Improve and A
Empower and Heal People Protect and Secure Places
Percent
Percent of Violence
of Violence 911 911
callscalls by Type,
by Type, 2018-21
2018-21
100.0
90.0 22.6 19.7 21.9 22.0
0.7 1.2
80.0 0.9 1.4
4.9 5.5 4.7 5.7
70.0 PILLAR #4: PILLAR #5:
Affect Public Policy Plan and Coordinate
60.0
50.0
58.6 60.7 57.0 54.7
40.0
30.0
20.0
10.0 16.4
13.0 13.4 14.9
0.0
2018 2019 2020 2021
Aggravated Assault Aggravated Battery Criminal Sexual Assault Homicide Robbery
While aggravated batteries accounted for more than half of all violent-crime related calls, it is important to note that most 911 calls
were regarding non-violent crimes (e.g., disturbances, property crimes). In fact, during the four-year period, violent crime related
calls accounted for only an average of 1.61% of all 911 calls annually (Figure 16).
Figure 16. Percentage of Violent-Crime related 911 Call Compared to All 911 Calls, 2018-2021
% 911
% 911Calls
Callsforfor
Violence
Violence
1.80
1.70
1.60
1.50
1.40
%
1.30
1.20
1.10
1.00
Jan-Mar Apr-Jun Jul-Sept Oct-Dec Jan-Mar Apr-Jun Jul-Sept Oct-Dec Jan-Mar Apr-Jun Jul-Sept Oct-Dec Jan-Mar Apr-Jun Jul-Sept Oct-Dec
2018 2019 2020 2021
20One-Year Assessment of the Our City, Our Safety Violence Reduction Plan 2022
Mayor’s Office of Public Safety
Pillars (ICONS)
Findings PILLAR #2 Protect and Secure Places
PILLAR #1: PILLAR #2: PILL
There was an overall increasing trend of total 311 calls during 2018-21. However, when examining
Empower specifically public
and Heal People safety-related
Protect and Secure Places Improve and A
311 calls23 (e.g., those related to graffiti, non-functioning streetlights, abandoned buildings, etc.), a slight decreasing trend was
observed. Graffiti removal was the most common concern, accounting for an average of 63% of public-safety related calls to 311
(Figure 17).
Figure 17. Percentage of Public Safety-Related 311 Calls by Type, 2018-2021
Percentage
Percentage of Public
of Public SafetyRelated
Safety Related311
311 Calls
Calls by
byType,
Type, PILLAR #4: PILLAR #5:
2018-2021
2018-2021
Affect Public Policy Plan and Coordinate
120.0
100.0 3.3 2.4 2.3
15.5
80.0
51.4 64.4
60.0 67.3
69.0
40.0 4.4
3.3 3.7
20.0 40.9
4.4 26.9 29.5
0.0 11.1
1 2 3 4
Alley/Street/Viaduct Light Out Vacant/Abandoned Building Complaint
Graffiti Removal Request All other
Further, most 311 calls are not public safety related. Overall, during the four-year period, public safety-related 311 calls accounted
for an average of 6.8% of all 311 calls annually, and tended to decrease over time (Figure 18).
Figure 18. Percentage of Public Safety-Related 311 Calls Compared to All 311 Calls, 2018-2021
Percentage of Public Safety-Related
Percentage of Public Safety-Related311 Calls
311 Calls Compared
Compared to2018-2021
to All 311 Calls, All 311 Calls, 2018-2021
10.00
9.00
8.00
7.00
6.00
5.00
4.00
3.00
2.00
1.00
0.00
Jan-Mar Apr-Jun Jul-Sept Oct-Dec Jan-Mar Apr-Jun Jul-Sept Oct-Dec Jan-Mar Apr-Jun Jul-Sept Oct-Dec Jan-Mar Apr-Jun Jul-Sept Oct-Dec
2018 2019 2020 2021
21One-Year Assessment of the Our City, Our Safety Violence Reduction Plan 2022
Mayor’s Office of Public Safety
Pillars (ICONS)
Findings PILLAR #2 Protect and Secure Places
PILLAR #1: PILLAR #2: PILL
In order to address these public safety concerns in the short-term and reduce the safety gapandinHeal
Empower thePeople
long-term, the Cityandhas
Protect invested
Secure Places Improve and A
in several place-based initiatives and programs. Some of the City’s primary initiatives to protect and secure places have been the
Invest South/West Initiative, the Neighborhood Activation Initiative, and the intentional restoration of vacant spaces.
Invest South/West: This Mayoral initiative that was launched in 2019 in collaboration with the Department of Planning and
Development (DPD) has now totaled more than $1.4 billion in public and private investments to support small businesses, create
public realm improvements, restore buildings, and foster equity.
PILLAR #4: PILLAR #5:
Affect Public Policy Plan and Coordinate
Neighborhood Activation: This is a focused violence prevention and community investment initiative that combines community
aspirations with City investments and assets to implement programs, social services, and changes to the built environment at a
hyper-local block level.
The first pilot of Neighborhood Activation is focused on a few key blocks in West Garfield Park. The Office of the Mayor partnered
with the Garfield Park Rite to Wellness Collaborative, Studio Gang, the Goldin Institute, and community residents to understand
community needs and envision solutions. Resulting projects included tree planting, youth summer jobs and programming,
beautification of vacant lots, monthly produce markets at Legler Library in partnership with the Greater Chicago Food Depository,
improvements to the public way to promote pedestrian safety, mural and art projects, community-designed street banners, and
more, with additional investments to come.
One key project was the development of a Community Plaza and Roller Rink at 4008 W. Madison Street. The Community Plaza is
a safe outdoor space in the neighborhood for residents to gather and build community.
22One-Year Assessment of the Our City, Our Safety Violence Reduction Plan 2022
Mayor’s Office of Public Safety
Pillars (ICONS)
Findings PILLAR #2 Protect and Secure Places
PILLAR #1: PILLAR #2: PILL
Empower and Heal People Protect and Secure Places Improve and A
PILLAR #4: PILLAR #5:
Affect Public Policy Plan and Coordinate
Vacant Lot Restoration: There has been strong evidence to suggest that unmaintained, vegetative spaces which are subject to
blight may foster crime. Conversely, areas of maintained and healthy vegetation are believed to be protective against crime.24
Research has suggested that as physical signs of disorder become more apparent in a neighborhood, residents are not as likely
to interact, causing reduced community attachment, collective efficacy, and mobility.25 Through an $87M investment in vacant lot
restoration in 2022, the City aims to reactivate vacant city-owned land and build community wealth by streamlining environmental
reviews and transferring ownership to neighborhood residents for community benefit.
Additionally, the City has dedicated ARP Funding to directly enhance place-based strategies such as housing investments,
revitalization of commercial corridors, and improvement of local parks, all of which create community infrastructure which can
promote reduction of violence. A detailed breakdown of these efforts is listed below:
• $241.4M in housing investments to create and preserve safe and affordable housing:
- $12M for an acquisition rehab program to identify and restore troubled and abandoned homes and buildings
in priority neighborhoods.
- $75.1M to create mixed-use, multi-family developments
- $30M to support owner-occupied repairs and smaller scale rehabs
- $60.3M to address home hazards such as lead-based paint
- $11M to provide direct homebuyer assistance and expand opportunities for home ownership through land preparation
23One-Year Assessment of the Our City, Our Safety Violence Reduction Plan 2022
Mayor’s Office of Public Safety
Pillars (ICONS)
Findings PILLAR #2 Protect and Secure Places
PILLAR #1: PILLAR #2: PILL
Empower and Heal People Protect and Secure Places Improve and A
• $186M to support small businesses, revitalize commercial corridors, and create local opportunities:
- $77M to revitalize commercial corridors, support small business owners, activate vacant storefronts,
and bring neighborhood amenities to communities
- $54M to rehabilitate vacant commercial and mixed-use buildings in commercial corridors
- $15M to promote community wealth building via business ownerships
- $10M to expand food equity through entrepreneurship PILLAR #4: PILLAR #5:
- $20M to support business development and tourism Affect Public Policy Plan and Coordinate
- $10M to support equitable transit-oriented development
• $16M to support arts and culture
• $35.6M to improve local parks
24One-Year Assessment of the Our City, Our Safety Violence Reduction Plan 2022
Pillars (ICONS)
Mayor’s Office of Public Safety
Findings PILLAR #3 Improve and Advance Policing
PILLAR #1: PILLAR #2: PILLAR #3:
With a national spotlight placed on the relationship betweenEmpower
individuals and law enforcement
and Heal People in the
Protect and Secure Placeslast year, theand
Improve City hasPolicing
Advance
redoubled its commitment to increasing police legitimacy in communities where trust has eroded by ensuring humane, effective,
and constitutional law enforcement practices. Indicators for this pillar include the following: community perception of trust in law
enforcement; clearance rate for homicides and non-fatal shootings; use of force; guns recovered; police department staff who
completed Crisis Intervention Training; consent decree compliance; and staff recruited and promoted to meet diversity, equity, and
inclusion standards.
In partnership with ZenCity (previously Elucd), the Chicago Police Department gathers 1,500-2,000
PILLAR #4: survey responses
PILLAR #5: from Chicago
Affect Public Policy Plan and Coordinate
residents every month, across all 22 police districts in the City to better understand perceptions of safety and levels of trust in law
enforcement. On a scale of 1-10, individuals are asked to respond to questions regarding
•
- PILLAR CONCEPT (1st Proof)
Perception of safety in Chicago:
- “When it comes to the threat of crime, how safe do you feel in your neighborhood?”
• Trust in law enforcement (average taken for the following two items):
- “How much do you agree with this statement? The police in my neighborhood listen to and take into
account the concerns of local residents”
- “How much do you agree with this statement? The police in my neighborhood treat local residents with respect”26
Examination of these data revealed a steady decline in perception of safety which could be attributed to the rise in violent crimes.
However, perceptions of trust in law enforcement have fluctuated over the years. Although there was a decrease in the average
trust score in 2021 as compared to 2020, the longer-term trend shows a slight increase in overall trust scores during the 2018-21
period (Figure 19).
Figure 19. Average Perception of Trust in Law Enforcement and Average Perception of Safety, 2018-2021
70.0
Average Perception of Trust in Law EnforcementAverage
andof Perception of Safety
68.0
Average Perception of Safety, 2018-2021
66.0 Average of Perception of Trust
63.5
64.0 Linear (Average of Perception of
Safety)
61.4
62.0 Linear (Average of Perception of
59.1
59.8 Trust)
60.0 58.9
58.5
58.0
56.5
56.0
53.6
54.0
52.0
50.0
2018 2019 2020 2021
25One-Year Assessment of the Our City, Our Safety Violence Reduction Plan 2022
Pillars (ICONS)
Mayor’s Office of Public Safety
Findings PILLAR #3 Improve and Advance Policing
PILLAR #1: PILLAR #3:
The ability of police to clear cases in a timely manner can haveEmpower
impacts on residents’ trust
and Heal People
inPILLAR
law #2:
enforcement, actual
Protect and Secure Places
levels
Improve and ofPolicing
Advance
safety, and the reduction of violence. “Clearance by arrest” is defined as at least one person associated with a crime being arrested,
27
charged, and turned over to the court for prosecution. “Clearance by exception” refers to the scenario when elements beyond law
enforcement’s control prevent the agency from arresting and charging an offender. In order to clear an offense exceptionally, the
agency must meet all of the 4 following criteria: the agency must have a) identified the offender; b) gathered enough evidence to
support an arrest, make a charge, and turn over the offender to the court for prosecution; c) identified the offender’s exact location;
d) encountered a circumstance outside the control of law enforcement that prohibits arrest (e.g., death of offender).28
PILLAR #4: PILLAR #5:
Affect Public Policy Plan and Coordinate
Over the previous four-year period, annual clearance rates (which includes both clearance by arrest and exception) for homicides
were between 41.6% and 49.2%, with the highest rate being observed in 2019. Annual clearance rates for non-fatal shootings were
between 7.9% and 11.9%, with the lowest rate being observed in 2020 (Figure 20). - PILLAR CONCEPT (1st Proof)
Figure 20. Clearance Rate for Homicides and Non-fatal Shootings, 2018-2021
Clearance
Overall Rate,
Clearance 2018-21
Rate, 2018-21
60.0
49.2
50.0 45.5
41.6 41.8
40.0
Rate
30.0
20.0
11.9
9.0 9.3
10.0 7.9
0.0
2018 2019 2020 2021
Homicides Shootings
26One-Year Assessment of the Our City, Our Safety Violence Reduction Plan 2022
Pillars (ICONS)
Mayor’s Office of Public Safety
Findings PILLAR #3 Improve and Advance Policing
PILLAR #1: PILLAR #2: PILLAR #3:
As can be seen in Figure 21, there is stability over time for clearance by exception for non-fatal
Empower and Heal People
shootings. Comparatively,
Protect and Secure Places Improve clearance
and Advance Policing
by exception rates for homicides were more unstable; while there was a significant decrease in clearance by exception in 2020 as
compared to 2019, the rate increased again in 2021. The trends for clearance by arrest remained mostly stable for homicides and
shootings between 2018 and 2021 (Figure 22).
Figure 21. Clearance Rate by Exception for Homicides and Non-fatal Shootings, 2018-2021
Clearance Rate by Exception, 2018-21
Clearance Rate by Exception, 2018-21
PILLAR #4: PILLAR #5:
Affect Public Policy Plan and Coordinate
30.0 27.7
- PILLAR CONCEPT (1st Proof)
25.0 22.6
18.0
20.0 17.4
15.0
%
10.0
5.0
3.9 3.7
0.0 3.3 3.2
2018 2019 2020 2021
Homicides Shootings
Figure 22. Clearance Rate by Arrest for Homicides and Non-fatal Shootings, 2018-2021
Clearance
Clearance Rate
Rate byby Arrest,
Arrest, 2018-21
2018-21
30.0
24.5
23.7
25.0 21.5
23.0
20.0
15.0
%
10.0
5.0 8.0 5.7
5.7
4.7
0.0
2018 2019 2020 2021
Homicides Shootings
27You can also read