Palm Beach County, Florida Shore Protection Project Jupiter Carlin Segment - Integrated 934 Report & EA - Economics Appendix
←
→
Page content transcription
If your browser does not render page correctly, please read the page content below
Palm Beach County, Florida
                             Shore Protection Project
       Jupiter Carlin Segment – Integrated 934 Report & EA

                              Economics Appendix

US Army Corps of Engineers                              March 2017
Jacksonville District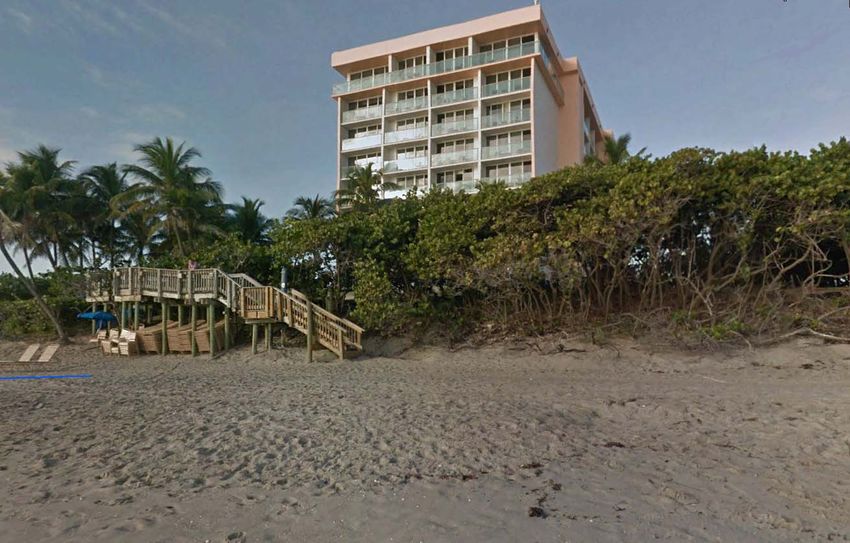
Table of Contents

Executive Summary ....................................................................................................................................... 4
1      Introduction .......................................................................................................................................... 5
    1.1       Purpose of Report ......................................................................................................................... 6
    1.2       Design of Document...................................................................................................................... 6
2      Existing Conditions ................................................................................................................................ 6
    2.1       Beach‐fx Economic Modeling Approach ....................................................................................... 6
    2.2       Overview of Existing Structures and Data Organization ............................................................... 7
       2.2.1          Existing Condition Structures and Contents ....................................................................... 10
       2.2.2          Armor .................................................................................................................................. 13
3      Future Without Project Condition (FWOP) ......................................................................................... 16
    3.1       Starting Shoreline Position .......................................................................................................... 16
    3.2       FWOP Economic Model Assumptions ......................................................................................... 17
    3.3       Beach‐fx FWOP Simulation Results ............................................................................................. 18
       3.3.1          Structure and Content Damages ......................................................................................... 18
       3.3.2          Armor Damages .................................................................................................................. 19
       3.3.3          Spatial Distribution of Damages.......................................................................................... 19
       3.3.4          Temporal Distribution of Damages ..................................................................................... 20
       3.3.5          FWOP Damages by Damage Driving Parameter ................................................................. 22
       3.3.6          FWOP Damages in alternative Sea Level Rise (SLR) scenarios ............................................ 23
    3.4       Beach‐fx FWOP Simulation Conclusion ....................................................................................... 23
4      Future With Project (FWP) Conditions................................................................................................ 23
    4.1       Existing Federal Project ............................................................................................................... 24
    4.2       Optimization of Federal Project .................................................................................................. 24
    4.3       Comparison and Evaluation of the initial array of alternatives .................................................. 25
    4.4       Alternative Comparison and Evaluation of the Final Array ........................................................ 25
5      Tentatively Selected Plan .................................................................................................................... 26
    5.1       Project Performance in the SLR scenarios .................................................................................. 27
    5.2       Refined Costs of the Recommended Plan................................................................................... 28
       5.2.1          Economic Cost of the Recommended Plan ......................................................................... 28
    5.3       Benefits of the Recommended Plan ........................................................................................... 29
       5.3.1          Storm Damage Reduction Benefits ..................................................................................... 29

                                                                                                                                                               2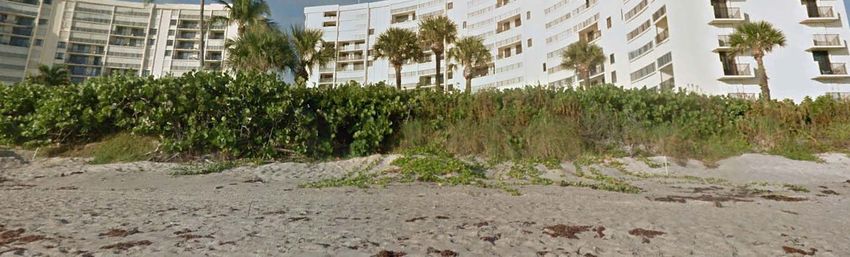
5.3.2 Land Loss Benefits ............................................................................................................... 29
5.3.3 Incidental Recreation Benefits ............................................................................................ 29
5.4 BCR and Net Benefits of the Recommended Plan ...................................................................... 33
5.5 Conclusion and Recommendations............................................................................................. 35
6 Addendum A: Alternate Modeling Approach ..................................................................................... 35
List of Figures
Figure 1 Project Vicinity Map ........................................................................................................................ 5
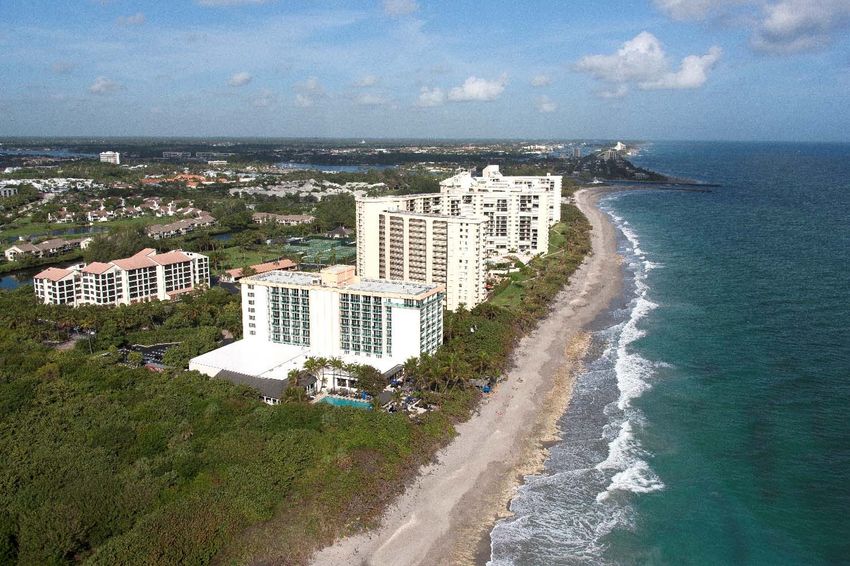
Figure 2 Aerial view of Reaches JC 13‐2 through JC 16‐1 with all lots and damage elements identified..... 9
Figure 3 Seaside view of the Ocean Trail Condominium complex ............................................................. 12
Figure 4 Seaside view of the Jupiter Beach Resort Condominium complex ............................................... 13
Figure 5 Coastal Amor in the Project Area as modeled in Beach‐fx .......................................................... 15
Figure 6 Starting Shoreline posistion: current vs. 1995 FWOP condition ................................................... 16
Figure 8 Damages and Armor Cost Incurred Over Time in Constant Dollars.............................................. 22
Figure 9: Jupiter Carlin Project Profle Comparison ..................................................................................... 24
Figure 10 Damages and Costs over time..................................................................................................... 27
Figure 11 Jupiter Carlin 934 Report: Overall Economic Summary .............................................................. 34
Figure 12 Amor Cost over time as modeled in Beach‐fx................................ Error! Bookmark not defined.
3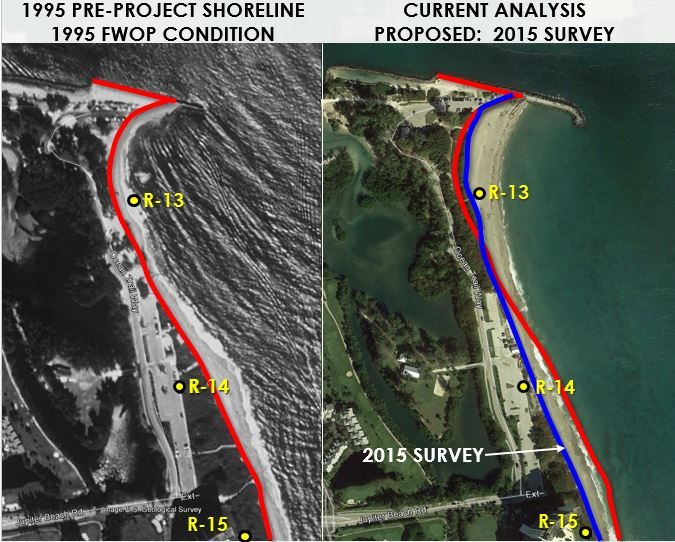
Executive Summary
The Federal Palm Beach County Shore Protection Project (SPP), Jupiter Carlin Segment is located in
Southeastern Florida (northern Palm Beach County). As originally authorized the project spans Florida
Department of Environmental Protection (FDEP) reference monuments R‐13 (just south of Jupiter Inlet)
to R‐19 (Carlin Park) and restores approximately 1.1 miles of beach. According to the authorization, and
as described in House Document 164/87/1, the project called for a seaward extension of approximately
100 feet from the mean high water (MHW) line, with a berm elevation of 10 feet above mean low water,
and a seven year nourishment interval. The design template is a 0‐foot berm extension of the 1990 MHW
line. Palm Beach County constructed the initial project in 1995 and renourished the beach in 2002.
In accordance with Section 934 of the 1986 Water Resources Development Act (WRDA) (Public Law 99‐
662), the purpose of this study consists of determining whether the authorized project is still economically
justified given current conditions and, if not justified, optimizing the authorized project.
In support of the 934 Report, economic analysis was completed to determine whether future
nourishments of this segment are economically justified and thus whether an extension of Federal
participation in cost sharing through the year 2045 is warranted. Because the project was originally
constructed in 1995 a full 50 year period of Federal participation, if approved, would end in 2045. Through
the analysis it was determined that the 100‐foot extension originally authorized is no longer economically
justified. However, an optimization of the originally authorized plan is proposed in the current document.
The specific purpose of this appendix is to describe the economic analysis of the 934 Report, including the
future without project (FWOP) and future with project (FWP) conditions as simulated by the Corps
certified model Beach‐fx. This appendix contains the approach, assumptions, and results of the economic
analysis. The economic analysis resulted in an optimized nourishment template that differs from the
authorized project. Based on existing conditions, the optimized project consists of a 10‐foot seaward
extension beyond the design berm, with a five year nourishment interval. The total cost of the first
renourishment is estimated to be $14.6 million. The average annual benefits and costs of the proposed
optimization are $2,509,000 and $1,546,000, respectively. The average annual net benefits of the
proposed optimization are $963,000, and the BCR is 1.62.
The analysis described above is based on a modeling approach in which both the future without project
condition and future with project condition use the same starting shoreline position. These results were
compared to an alternate approach, in which the FWOP condition used the 1995 shoreline as its starting
point. The alternate approach is fully consistent with 934 guidance, which states that the starting
shoreline used in the FWOP analysis should reflect the pre‐construction template. However, the alternate
approach creates illogical model results due to the differing starting shoreline positions in the FWP and
FWOP conditions.
The results of the alternate approach indicate that the project would still be economically justified when
recreation benefits are included, though the BCR and net benefits would be lower. When using the
alternate approach, the average annual net benefits of the proposed optimization are $883,000, and the
BCR is 1.57.

                                                                                                          4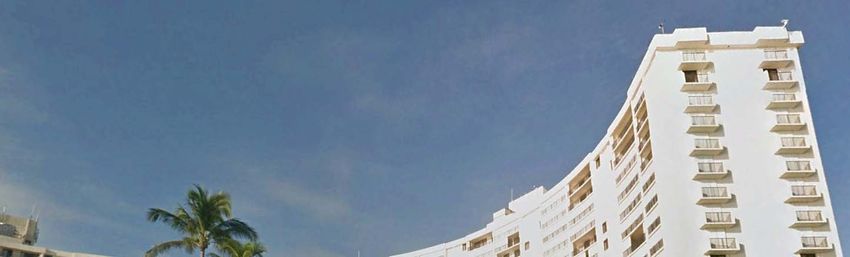
1    Introduction
The Jupiter/Carlin segment of the Palm Beach County Shore Protection Project is located in the north end
of Palm Beach County on the east coast of Florida. The project sits approximately 80 miles (mi) north of
Miami and approximately 250 mi south of Jacksonville, Florida. The authorized project extends from near
the south jetty of the Jupiter Inlet a distance of approximately 1.1 mi to Carlin Park at its southern limit.
The project spans Florida Department of Environmental Protection (FDEP) reference monuments R‐13 to
R‐19, a state‐designated critical erosion area. The project area is shown in Figure 1.

The authorized project provides for initial construction and periodic nourishment at seven‐year intervals
along 1.1 miles of shoreline. Palm Beach County constructed the initial project in 1995 and renourished
the beach in 2002. Federal participation in cost sharing expired in 2005, ten calendar years after initial
construction in 1995. Section 934 of the 1986 Water Resource Development Act (Public Law 99‐662)
provides discretionary authority to the Secretary of the Army, acting through the U.S. Army Corps of
Engineers Office of the Chief of Engineers, to extend federal participation to the 50th year after the date
of initial construction of a project (2045).

Figure 1 Project Vicinity Map

                                                                                                           5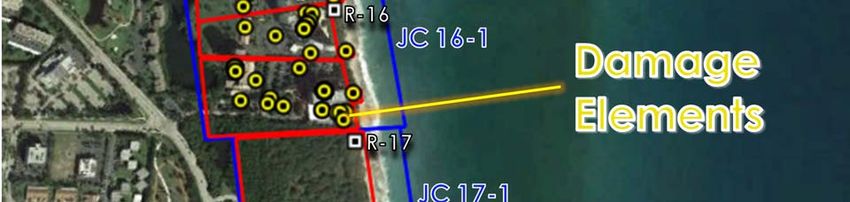
1.1 Purpose of Report
The Jupiter Carlin 934 Report is intended to investigate the feasibility of extending the period of Federal
participation for the authorized project to a full 50 years. This would add 27 years to the project life, from
2019 through 2045. The purpose of this document is to describe the economic analysis of the 934 Report,
including the future without project (FWOP) and future with project (FWP) conditions as simulated by the
Corps certified model Beach‐fx. It is intended to explain the approach, assumptions, and results of the
economic analysis.

    1.2 Design of Document
The purpose of the Section 934 Report is to tell the entire story of extending Federal participation in future
nourishments of the Jupiter/Carlin segment to the year 2045. The purpose of the economics appendix is
to provide a technical guide to methods, assumptions, and results of the economic analysis.
Section 1 of this Appendix provides an introduction, Section 2 provides a detailed description of the
existing condition and overall modeling approach; Section 3 provides detailed summary of the future
without project condition including information about the spatial and temporal distribution of estimated
damages. Section 3 also provides a summary of the sea level rise (SLR) analysis. Section 4 describes the
future with project (FWP) condition as simulated in Beach‐fx, as well as information about alternative
comparison and evaluation. Section 5 describes the Recommended Plan in more detail, including benefits,
refined costs, a benefit‐cost ratio (BCR), net benefits, and information about project performance in the
SLR scenarios. Section 5 also has a brief conclusion. After Section 5, an addendum has been added that
explains a potential alternate approach.

2     Existing Conditions
    2.1 Beach‐fx Economic Modeling Approach
Beach‐fx was developed by the USACE Engineering Research and Development Center (ERDC) in
Vicksburg, Mississippi. The model links the predictive capability of coastal evolution modeling with project
area infrastructure information, structure and content damage functions, and economic valuations to
estimate the costs and total damages under various shore protection alternatives. Beach‐fx fully
incorporates risk and uncertainty, and is used to simulate future hurricane and storm damages at existing
and future years and to compute accumulated present worth damages and costs. Storm damage is
defined as the damage incurred by the temporary loss of a given amount of shoreline as a direct result of
waves, erosion, and inundation caused by a storm of a given magnitude and probability. Beach‐fx is an
event‐driven life‐cycle model that estimates damages and associated costs over a 50 year period of
analysis based on storm probabilities, tidal cycle, tidal phase, beach morphology and many other factors.
Damages or losses to developed shorelines include buildings, pools, patios, parking lots, roads, utilities,
seawalls, revetments, bulkheads, replacement of lost backfill, etc. Beach‐fx also provides the capability
to estimate the costs of certain future measures undertaken by state and local organizations to protect
coastal assets.
It should be noted that the future structure inventory and values are the same as the existing condition.
This conservative approach neglects any increase in value due to future development. Due to the
uncertainty involved in projections of future development, using the existing inventory is preferable and
considered conservative for Florida where coastal development has historically increased in density and
value.

                                                                                                            6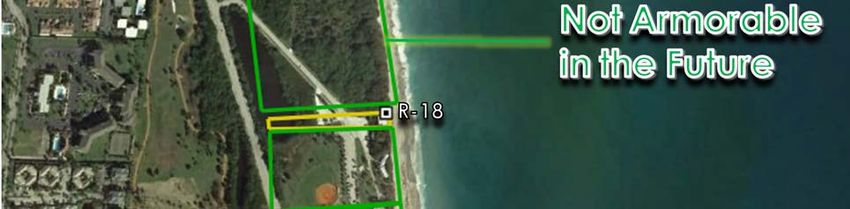
The Jupiter Carlin Beach‐fx model has been developed in close collaboration with the SAJ Engineering
Division. All coastal morphology inputs were developed by the SAJ engineering team (see engineering
Appendix). This model has been built in accordance with the Beach‐fx User’s Manual (August 2009); the
manual is referenced throughout this document.

  2.2 Overview of Existing Structures and Data Organization
Economists, real estate specialists, and engineers have collected and compiled detailed structure
information for the 1.1 mile stretch of shoreline authorized for the Jupiter Carlin Shore Protection Project
(FDEP Monuments R‐13 through R‐19), which includes:
    Six condominium buildings
    Parking lots, parking garages, access roads, pools, decks, tennis courts, guard/pool houses, and dune
    walkovers associated with the condominiums
    Three large public parking lots
    Public roadways
    Carlin Park Civic Center
    Lazy Loggerhead Café
    Several public pavilions, gazebos, bath houses, and dune walkovers.

In addition to structures located in the 1.1 miles of shoreline that comprise the authorized project,
structure information was compiled for the approximately 1.5 miles of shoreline down drift of the
authorized project area (FDEP Monuments R‐19 to FDEP Monuments R‐26). State Road A1A, the Jupiter
Beach Club Resort, a parking lot, and several dune walkovers are included in the down drift analysis.
Inclusion of this down drift shoreline is consistent with the economic analysis presented in the Palm Bean
County, FL Shore Protection Project General Design Memorandum Addendum for Jupiter/Carlin Segment.
In total, attribute information for 206 separate damage elements (151 damage elements within the
authorized project area and 55 damage elements down drift of the placement area) was populated for
economic modeling using Beach‐fx. The proximity of these buildings, roads, and other structures to the
beach makes them potentially vulnerable to erosion, wave, and flood damage.
The Jupiter Carlin project area, because of its relatively short length, is not broken out into separable study
reaches for incremental analysis. The project area was disaggregated into 7 profiles, 7 model (Beach‐fx)
reaches, and 19 lots, for economic modeling and reporting purposes. Similarly, the down drift shoreline is
made up of one profiles, 7 model (Beach‐fx) reaches, and 10 lots. Figure 2 shows an aerial view of the
Beach‐fx model features within the project area. This hierarchical structure is depicted as follows:

    Beach Profiles: Coastal beach profile surveys were analyzed by USACE Jacksonville District (SAJ)
    Coastal Engineering personnel to develop representative beach profiles that include the dune, berm
    and submerged portions of the beach. The representative beach profiles are used for shore response
    modeling in the SBEACH engineering numerical model, and only referred to in this section for
    informational purposes.
    Beach‐Fx (Model) Reaches: Quadrilaterals with a seaward boundary that is parallel with the shoreline
    that contain the Lots and Damage elements, and that are used to incorporate coastal morphology
    changes for transfer to the lot level. Model reaches are also useful for developing study reaches into
    more manageable segments for analysis. After the FWOP conditions are modeled, the Beach‐fx
    reaches will be grouped into “design reaches” to represent separable increments delineated based
    on shoreline condition and FWOP damages, where unique FWP alternatives could be implemented.

                                                                                                             7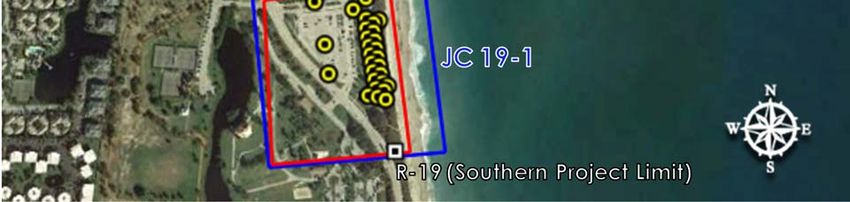
Lots: Quadrilaterals encapsulated within model reaches used to transfer the effect of coastal
   morphology changes to the damage element. Lots are also repositories for coastal armor costs,
   specifications, and failure threshold information.
   Damage Elements: Represents the smallest unit of the existing condition coastal inventory and a
   store of economic value subject to losses from wave attack, inundation, and erosion damages.
   Damage elements are a primary model input and the topic of focus in this discussion. The primary
   structure categories are coastal armor and coastal structures.

More details on the establishment of the Profiles and Beach‐fx Model Reaches, which is primarily based
on physical shoreline characteristics, can be found in the Appendix A ‐ Engineering.

Beach‐fx handles economic considerations at the Lot and Damage Element levels. These considerations
include armor construction costs at the Lot level, and the extent of damage and rebuilding costs at the
Damage Element level. When damages occur in Beach‐fx, Damage Elements may be partially rebuilt
depending on the extent of modeled damage. Beach‐fx calculates rebuild costs as the difference in the
structures depreciated replacement value before and after the damage occurs. Section Error! Reference
source not found. will provide further detail on the Lot and Damage Element attribute data that makes
up the structure inventory for this project area.

                                                                                                     8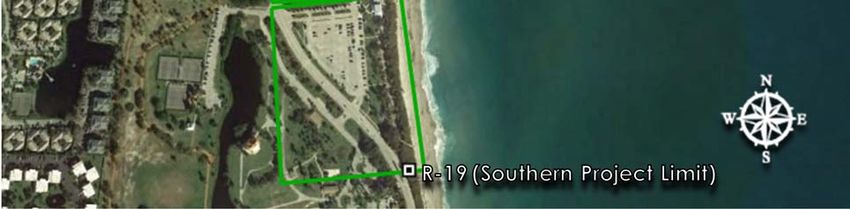
Figure 2 Aerial view of Reaches JC 13‐2 through JC 16‐1 with all lots and damage elements identified

                                                                                                       9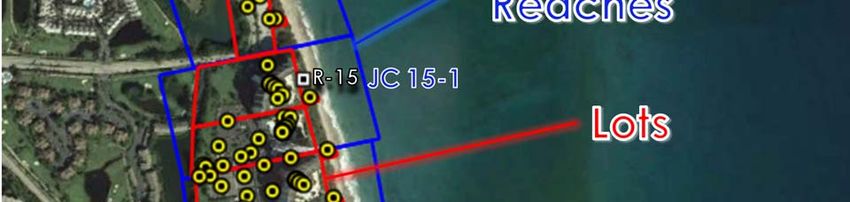
2.2.1 Existing Condition Structures and Contents
The economic value of the existing structure inventory represents the depreciated replacement costs of
damageable structures and their associated contents within the study area along the coastline. The
damage element inventory includes 206 damageable structures with an overall estimated value of $135
M, with structure and content valuations of $103 M and $32 M respectively.
Values aggregated by Beach‐fx Reach show variation due to differentiation between the type, magnitude,
and density of development. The two Beach‐fx Reaches (JC 15‐1 and JC 16‐1) that include the six
condominium structures account for 95% of the structure and content value of the entire study area. Of
all structures considered in the analysis, only approximately 3% of the total structure value lies down drift
of the project area. Table 1 provides the distribution of structure and content values broken down by
Beach‐fx Model Reach. Pictures of some of the condominium structures are provided in Figures 3, and 4.

Table 1: Distribution of Structures and Structure Values by Model Reach

    Beach‐Fx           DE                Structure          Content                Total           % of
      Reach           Count                Value              Value               Value         Total Value
     JC 13‐2            1         $             9,585.00 $           ‐       $         9,585              0%
     JC 14‐1            7         $           472,644.00 $           ‐       $       472,644              0%
     JC 15‐1            36        $        26,214,068.00 $ 7,901,250.00      $    34,115,318             25%
     JC 16‐1            68        $        71,457,187.00 $ 23,168,250.00     $    94,625,437             70%
     JC 17‐1            1         $            68,400.00 $           ‐       $        68,400              0%
     JC 18‐1            10        $           515,571.00 $     90,000.00     $       605,571              0%
     JC 19‐1            28        $         1,200,888.00 $ 183,750.00        $     1,384,638              1%
     JC 20‐1            10        $           335,385.00 $           ‐       $       335,385              0%
     JC 21‐1            21        $         1,618,119.00 $ 700,030.00        $     2,318,149              2%
     JC 22‐1            9         $           218,038.00 $           ‐       $       218,038              0%
     JC 23‐1            8         $           243,943.50 $           ‐       $       243,944              0%
     JC 24‐1            3         $           163,312.50 $           ‐       $       163,313              0%
     JC 25‐1            1         $           141,588.00 $           ‐       $       141,588              0%
     JC 26‐1            3         $            81,240.50 $           ‐       $        81,241              0%
           Total       206        $          102,739,970 $ 32,043,280        $   134,783,250       100%
Note: JC 20‐1 through JC 26‐1 make up approximately 1.5 miles of shoreline down drift of the project area.

A summary of the damage elements by Study Reach is provided in Table 2.

                                                                                                             10
Table 2: Distribution of Structures and Structure Values by Model Reach
# Structures Value
DE Type Project Reach Downdrift Reach DE Type Project Reach Downdrift Reach
CABANA 6 1 CABANA $212,190 $14,050
COMM 3 0 COMM $1,325,250 $0
DECKS 6 2 DECKS $335,155 $32,730
GARAGE 5 0 GARAGE $505,940 $0
GAZEBO 22 1 GAZEBO $468,000 $10,760
ISOLATED 6 0 ISOLATED $117,000 $0
MFR1 35 4 MFR1 $109,039,500 $1,397,080
MFR2 2 1 MFR2 $6,426,000 $702,980
MFR3 5 0 MFR3 $3,726,000 $0
PARKINGLOT 19 3 PARKINGLOT $1,161,957 $16,910
POOL 11 2 POOL $235,270 $25,370
ROAD1 6 0 ROAD1 $588,337 $0
ROAD2 1 10 ROAD2 $127,044 $1,224,882
SHOWER 1 15 SHOWER $600 $9,000
TENNIS 4 0 TENNIS $157,500 $0
UGPARK 5 0 UGPARK $6,300,000 $0
UTILITIES 5 0 UTILITIES $490,000 $0
WALK 9 16 WALK $65,850 $67,895
Total 151 55 Total $131,281,593 $3,501,657
As noted in both tables, the majority of structures and total value subject to damage are located in the
project reach. In addition to the Condos, the project reach includes Gazebos, roads, parking lots, pools,
tennis courts, and dune walks.
11Figure 3 Seaside view of the Ocean Trail Condominium complex
12Figure 4 Seaside view of the Jupiter Beach Resort Condominium complex
2.2.2 Armor
Beach‐fx handles coastal armoring parameters and condemnation at the lot level. Lots are designated as
being either armored, armorable in the future, or not armorable, based on coastal regulations that dictate
armor construction and local history on armor permitting and construction. Since armoring forms one of
the major roles of lots in Beach‐fx, the location and length of potential future armoring dictates the
seaward boundary of most lots.
Data on coastal armor within the project area was collected from a variety of sources including site visits,
aerial photography, and USACE SAJ Coastal Engineering personnel. Coastal armor value was determined
by USACE SAJ Cost Engineering personnel.
The project area contains only one instance of existing coastal armor. This is a 40 foot long steel sheet pile
seawall with a concrete cap that fronts the Jupiter Beach bath house. The location of this existing armor
is shown as the red lot in Error! Reference source not found., just north of R‐14. Lots that are already
armored are shown in red.
The downdrift area modeled in Bach‐fx includes an additional instance of existing armor located near R‐
21. This sheet pile seawall fronts the Jupiter Reef Club Resort complex.
The project area shoreline that is not currently armored has been categorized as being either armorable
in the future or not armorable. This categorization is based on the assumed likelihood that armor would
or would not be constructed by local interests in the future, should a Federal Project not be implemented.
Lots designated as armorable in the future are shown in yellow in Error! Reference source not found.. It
is assumed that the five condominiums along the shoreline and the Civic Center would be armored by
13local interests with steel sheet pile seawalls (similar to existing seawalls protecting the Jupiter Park bath
house and other condominiums within Palm Beach County, FL), once the shoreline eroded to within 30
feet of the structures. These structures would be eligible for armor permits under Florida’s Coastal
Construction Control Line (CCCL) program and local interests would likely be willing to incur the armor
costs in order to protect these valuable structures. As recently as 2014 several steel seawalls have been
permitted and constructed to protect shorefront condominiums in Palm Beach County, where erosion has
encroached to within approximately 30 feet of the structure. Without continued Federal participation
continued beach nourishment, a similar course of action will likely be taken for the Jupiter‐Carlin project
area in the lots designated as armorable in the future. SAJ Cost Engineering personnel estimate that future
sheet pile seawalls will cost $12,219 per linear foot.
Not armorable lots are shown in green in Figure 5. It is assumed that these lots would not be armored in
the future either because the property would not be eligible for armor construction under the CCCL
criteria or the property owner would likely find that armor is more costly that the infrastructure being
protected. In the area modeled, lots that are empty or contain only relatively low value structures such as
dune walks or gazebos along the shoreline are assumed to be not armorable in the future. Additionally,
all down drift areas that are not currently armored are specified as not amorable in the future for
modeling purposes. A1A south of R‐19 is County‐owned. The non‐federal sponsor, Palm Beach County,
has not considered armoring this area of A1A.
14Figure 5 Coastal Amor in the Project Area as modeled in Beach‐fx
153 Future Without Project Condition (FWOP)
This section documents the future without project condition in detail, including modeling assumptions
and results.
3.1 Starting Shoreline Position
According to Section 934 guidance, the starting shoreline used in the FWOP analysis should reflect the
pre‐construction template. A FWP condition can then be developed based on existing conditions (current
surveys). The logic behind this approach is that it should be possible to evaluate the entire life of the
project, including the proposed extension of Federal participation, by comparing it to an FWOP condition
in which the project had never been built. Current guidance likely presumed that for 934 studies, the
without project beach profile would be more eroded then the existing profile and that the physical
orientation (angle with respect to north‐south) of the shoreline would remain constant.
In this case, the pre‐construction template would be the 1995 shoreline before initial construction of the
project. Between 1995 and 2015 both the shoreline position and physical orientation changed
significantly (see below figure). In fact, the current condition of the Jupiter Carlin project is more
eroded in some portions of the project than the pre‐construction profile indicates and the overall
orientation of the shoreline between R‐monuments R‐13 and R‐15 has shifted. See Figure 6.
Figure 6 Starting Shoreline posistion: current vs. 1995 FWOP condition
16Because of these changes, it is not possible to make valid comparison by using the pre‐project shoreline.
Instead, both the FWOP and FWP conditions used in this analysis use the same 2018 starting profile.
This makes it possible to evaluate the costs and benefits of the proposed plan over the 27 year period
of analysis‐ a true “apples to apples” comparison. The model results described throughout the appendix
reflect this approach (i.e., the same 2018 starting profile). An alternate approach that is fully consistent
with the guidance is presented in Addendum A of this Appendix. More information about the two
approaches is provided in the official 2017 Jupiter Carlin Policy Interpretation Memo, also included as
part of the report materials.
3.2 FWOP Economic Model Assumptions
Start Year: The year in which the simulation occurs is 2018
Base Year: The year in which the benefits of a constructed federal project would be expected to begin
accruing is 2019
Period of Analysis: 27 years (FY2019 through FY2045)
Discount Rate: 2.875% FY2016 Federal Water Resources Discount Rate
Damage Functions:
Damage functions developed by the Institute for Water Resources (IWR), Coastal Storm
Damage Workshop (CSDW), Coastal Storm Damage Relationships Based on Expert Opinion
Elicitation in 2002, were used to the maximum extent possible.
Damage functions used for the high rise condominium structures were developed based on
their unique construction and foundation type, and are documented in a 2010 White Paper
titled “Large Building Flood Damage Functions”, by Christopher P. Jones, P.E.
Coastal Armor:
Existing armor set at the lot level will protect the damage elements in that lot until failure is
triggered. If the armor fails, structures will be subject to damages until the armor is rebuilt.
Armor failure thresholds for erosion, wave attack, and inundation have been set based on the
armor design and engineering judgment.
When erosion reaches the seaward edge of armorable in the future lots, armor will be
constructed at this location. Before the armor is built the damage elements are subject to
damages. Once construction of the armor is completed, armor will function normally.
Shorefront properties that are not armorable will not be armored in the future because of
either permitting restrictions, or the cost of armor would not likely be warranted to protect
the relatively low value structures on these properties.
Number of Times Rebuilding Allowed: The maximum number of structure rebuilds can be specified
for damage elements. Based on the assumed likeliness that certain types of damage elements will
eventually stop being rebuilt by property owners, the following are the number of times that
rebuilding is allowed for certain types of damage elements:
Dune Walks: 6X
Gazebos: 3X
Isolated Structures: 3X
Remaining: 99X
173.3 Beach‐fx FWOP Simulation Results
Over 100 iterations the future without project condition damages range between $1.172 M and $3.476
M in average annual terms. Descriptive statistics on the FWOP model results are as follows:
Mean Average Annual Damage: $1,737,189
Standard deviation: $352,302
Median: $1,432,041
The minimum iteration showed $1.172 million in average annual FWOP damage, while the maximum
showed $3.476 million in damage. A breakdown of the type of damage is provided in Table 3.
Table 3: Average Annual Damages by Category
Damages +
Damages Armor Costs Land Loss Armor Cost +
Land Loss
Updrift Reach $0 $0 $158,521.44 $158,521
Project Reach $204,715.07 $1,146,956.48 $16,512.56 $1,368,184
Downdrift Reach $170,035.01 $0 $40,448.34 $210,483
Total $374,750 $1,146,956 $215,482 $1,737,189
The breakdown makes it clear that the largest category of damage by far is armor damage in the main
project reach. In this reach, new armor is constructed relatively early in most simulations. The new armor
reduces or prevents future damage, but it also incurs its own cost.
3.3.1 Structure and Content Damages
Structure damages refer to economic losses resulting from the structures situated along the coastline
being exposed to wave attack, inundation, and erosion damages (not including armor damage or land
loss). Content damages refer to the material items housed within the aforementioned structures (usually
air conditioned and enclosed) that are potentially subject to damage. In the Jupiter Carlin FWOP condition,
structure damages (about $375,000 in average annual damages) account for approximately 21.6% of the
total FWOP damages. A summary of structure and content damages (by damage element type) is
provided in Table 4.
18Table 4: PV Structure and Content Damages by Damage Element Type (not including armor or land loss)
Type Project Reach Downdrift Reach
CABANA $2,549
COMM $1,107,527
DECKS $20,776 $5,607
Purpose: GARAGE $4,807
Show what is GAZEBO $278,407 $1,365
being
ISOLATED $1,303,308
damaged in
MFR2 $1,518
each model
reach in MFR3 $5,909
present value PARKINGLOT $208,381
dollars. POOL $14 $4,282
ROAD2 $389,739 $2,940,047
SHOWER $12,048
UGPARK $352,540
UTILITIES $610
WALK $132,013 $199,634
Total $3,808,099 $3,162,982
*Note: Armor damage is the most important category of overall damage, the purpose of this table is provide more information
about structure and contents damage.
The two largest categories of damage by far are commercial and isolated property damage in the project
reach, and road damage in the downdrift reach.
3.3.2 Armor Damages
Beach‐fx provides the capability to estimate the costs incurred from measures likely to be taken to protect
coastal assets and or prevent erosion in the study area. Armor “damage” is a broad category that includes
direct damage to existing armor, and the costs associated with erecting new armor. In the Jupiter Carlin
FWOP condition, armor damage (about $1.147 million in average annual terms) accounts for
approximately 66% of the total FWOP damages. Thus, it is the most important category of damage.
3.3.3 Spatial Distribution of Damages
There is a great deal of variability in the amount of damages amongst the Beach‐fx reaches. This is
explained by the large number of variables, all of which the Beach‐fx model takes into account. Examples
of variation between the reaches result from the following:
Density and amount of development
Typical size and value of structures
Typical distance between structures and mean‐high water
Size, shape and location of the dunes and coastal morphology
Rate of erosion for each reach
Amount and type of coastal armoring present
Timing that property owners construct coastal armoring in the future.
A spatial summary of the Gasparilla FWOP damages is presented in Table 5.
19Table 5: Average Annual Damages by Reach
Damages +
Damages Armor Costs Land Loss Armor Cost +
Land Loss
Updrift Reach $0 $0 $158,521.44 $158,521
Project Reach $204,715.07 $1,146,956.48 $16,512.56 $1,368,184
Downdrift Reach $170,035.01 $0 $40,448.34 $210,483
Total $374,750 $1,146,956 $215,482 $1,737,189
The results indicate that the majority of damage (about 78%) occurs in the project reach.
3.3.4 Temporal Distribution of Damages
The temporal distribution of damages is fairly front loaded. In most iterations, new armor construction is
triggered quickly (in the early years of the simulation). This new armor helps protect the inventory from
damage, but it incurs its own cost. Damages and costs that occur early in the simulation are not
discounted as heavily as those that occur later, thus they can have a disproportionately large impact on
average annual damage.
Later in the simulation, some of the unarmored lots begin to accrue increasing erosion and land loss
damage. These damages, while significant, are smaller in magnitude than the armor costs that tend to
accrue early on. The distribution of non‐present value damages is summarized in Table 6 and Figure 8.
20Table 6 Jupiter Carlin FWOP –Damages and Armor Costs over time in constant dollars
Damages +
CY Damages Armor Cost Land Loss Armor Cost +
Land Loss
2018 $0 $5,640,840 $0 $5,640,840
2019 $99,613 $1,805,848 $0 $1,905,462
2020 $80,396 $1,355,898 $1,050,422 $2,486,716
2021 $237,265 $2,509,284 $1,265,507 $4,012,056
2022 $335,653 $2,843,894 $820,918 $4,000,464
2023 $263,093 $1,988,249 $12,572 $2,263,915
2024 $127,595 $940,817 ‐$4,440 $1,063,972
2025 $119,622 $718,858 $220 $838,700
2026 $221,602 $772,507 $1,413 $995,522
2027 $131,243 $380,889 ‐$837 $511,295
2028 $251,195 $431,182 ‐$88 $682,288
2029 $161,892 $420,456 $0 $582,348
2030 $249,736 $679,296 ‐$192 $928,840
2031 $273,846 $621,627 $9,677 $905,149
2032 $306,088 $790,616 $121,585 $1,218,289
2033 $350,092 $751,048 $2,160 $1,103,300
2034 $372,294 $801,341 $4,591 $1,178,226
2035 $379,160 $711,486 $2,325 $1,092,971
2036 $390,000 $269,574 $10,049 $669,623
2037 $593,594 $129,424 $122,791 $845,810
2038 $662,365 $89,859 $7,682 $759,906
2039 $545,705 $0 ‐$639 $545,066
2040 $709,540 $10,729 $0 $720,269
2041 $686,728 $0 $46,618 $733,346
2042 $799,591 $0 $751,782 $1,551,373
2043 $1,119,058 $21,459 $793,416 $1,933,933
2044 $864,623 $0 $32,503 $897,126
2045 $598,622 $0 $28,084 $626,706
2046 $460,158 $0 $1,628 $461,786
21Figure 7 Damages and Armor Cost Incurred Over Time in Constant Dollars
Land Loss Damages Armor Cost
$4,500,000
$4,000,000
$3,500,000
$3,000,000
$2,500,000
$2,000,000
$1,500,000
$1,000,000
$500,000
$0
2019
2020
2021
2022
2023
2024
2025
2026
2027
2028
2029
2030
2031
2032
2033
2034
2035
2036
2037
2038
2039
2040
2041
2042
2043
2044
2045
2046
These results indicate that the primary source of FWOP condition damages are armor costs triggered early
in the period of analysis. Damage to the structure inventory is small in comparison to the construction of
armor, and appears to accelerate later in the period.
3.3.5 FWOP Damages by Damage Driving Parameter
Within the beach‐fx model environment, damage to structures and contents can be caused by three
different damage driving parameters: flooding (inundation), wave attack, and erosion. The results of
damage to structures and contents are broken out by parameter in the following Table 7.
Table 7: PV Damages by Damage Driving Parameter
ReachGroup FloodLoss ErosionLoss WaveLoss
Project Reach 0.1% 53.9% 0.7%
Downdrift Reach 0.0% 45.2% 0.1%
Total 0.1% 99.0% 0.8%
ReachGroup FloodLoss ErosionLoss WaveLoss
Project Reach $8,653 $3,758,590 $49,246
Downdrift Reach $0 $3,153,094 $9,893
Total $8,653 $6,911,684 $59,139
22Typically, in Florida coastal studies, the vast majority of damage (as estimated by Beach‐fx) is caused by
erosion. This appears to also be the case in Jupiter Carlin, where an overwhelming majority is caused by
erosion.
3.3.6 FWOP Damages in alternative Sea Level Rise (SLR) scenarios
The FWOP condition was modeled for three sea level rise (SLR) scenarios. ER 1165‐2‐211 provides both
a methodology and a procedure for determining a range of sea level rise estimates based on the local
historic sea level rise rate, the construction (base) year of the project, and the design life of the project.
The Beach‐fx results presented above refer to the baseline scenario, which is based on the historic
erosion rate. The results associated with the other two SLR scenarios are presented in Table 8.
Table 8: Simulated FWOP damages in the Sea Level Rise scenarios
SLR1 (Baseline) SLR2 (Intermediate) SLR3 (High)
Damage $374,750 $511,212 $799,876
Armor Cost $1,146,956 $992,376 $1,156,090
Land Loss $215,482 $293,948 $459,930
Total $1,737,188 $1,797,536 $2,415,896
The results are largely what might be expected, with FWOP damages increasing at an increasing rate
with greater rates of SLR. The intermediate scenario only produces damages that are slightly higher
than the baseline (approximately 3.5%), while the high scenario produces damages that are significantly
higher than the baseline (approximately 39.1%).
3.4 Beach‐fx FWOP Simulation Conclusion
The future without project condition simulated here suggests that the study area may be subject to
considerable storm and erosion damage throughout the period of analysis. In particular, there are three
important conclusions:
1.) Most of the FWOP damages consist of new armor construction for maintaining and protecting
condominiums.
2.) The overwhelming majority of the damage and new armor is caused by erosion.
3.) Damages in the future without project condition increase in the accelerated sea level rise
scenarios
4 Future With Project (FWP) Conditions
As noted in Section 1.1, the purpose of the 934 Report is to investigate and evaluate the feasibility of
extending the period of Federal participation for the authorized project to a full 50 years. In this case, a
full 50 years would add 27 years to the project life, from 2018 through 2045.
In order to evaluate the additional 27 years of Federal participation, a future with project (FWP) condition
must be developed in Beach‐fx to compare to the FWOP. The purpose of this section is to describe the
methods, assumptions, and results of the FWP modeling effort.
234.1 Existing Federal Project
As noted above and in Section 1, the Jupiter Carlin project was constructed in 1995 and renourished in
2002. The authorized project provides for initial construction and periodic nourishment at seven‐year
intervals along 1.1 miles of Atlantic shoreline with a seaward extension of approximately 100 feet from
the mean high water (MHW) line and a berm elevation of 10 feet above mean low water. The design
template is a 0‐foot berm extension of the 1990 MHW line. Figure 17 shows a generalized cross section
view of the project.
Figure 8: Jupiter Carlin Project Profle Comparison
4.2 Optimization of Federal Project
The purpose of the 934 Report is to evaluate the feasibility of continued Federal participation throughout
an additional 27 years of analysis (2018‐2046). Unlike a full feasibility study, a full suite of potential
alternatives has not been considered. However, planning guidance does have a provision for optimization
of the Federal project, including a modification of the berm width and the renourishment interval to make
it more efficient. Therefore, in order to optimize the project, different FWP conditions were developed
within Beach‐fx. Specifically, a whole range of different advance fill widths were simulated: 20 feet to 100
feet (in ten foot increments).
Changes to the design berm were not evaluated. Other FWP nourishment specifications, all of the
modeling assumptions and parameters are the same in the FWP condition as they were in the FWOP
condition. It should be noted that the alternative comparison is based on screening level mobilization and
placement cost estimates. These estimates should be considered “rough order of magnitude” costs (ROM
costs). Once the project is optimized in Beach‐fx, a refined cost estimate can be developed.
244.3 Comparison and Evaluation of the initial array of alternatives
In order to identify the most efficient plan, an initial array of alternatives was developed that included a
full range of variations in the advance fill, from 10 feet to 100 feet. The results of the preliminary screening
is provided below in Table 9.
Table 9: Alternative comparison using screening level costs
1st Screening (AAEQ Dollars)
Benefits Cost BCR Net Benefits
10ft $946,391 $2,181,151 0.43 ‐$1,234,760
20ft $964,812 $1,936,150 0.50 ‐$971,338
30ft $995,902 $1,921,212 0.52 ‐$925,311
40ft $996,643 $1,955,278 0.51 ‐$958,635
50ft $995,710 $2,030,226 0.49 ‐$1,034,516
60ft $988,722 $2,134,872 0.46 ‐$1,146,150
70ft $984,359 $2,233,829 0.44 ‐$1,249,470
80ft $983,980 $2,344,679 0.42 ‐$1,360,699
90ft $983,081 $2,455,625 0.40 ‐$1,472,544
100ft $986,916 $2,553,038 0.39 ‐$1,566,121
110ft $970,681 $2,666,886 0.36 ‐$1,696,205
120ft $969,154 $2,778,725 0.35 ‐$1,809,572
The preliminary screening suggested that none of the alternatives would be economically justified based
on primary benefits alone. However, the smaller variations of the project appeared to more promising
(i.e., closer to economic justification). For any alternative larger than 40 feet, the net benefits become
increasingly negative with increasing project size. Therefore, the first four alternatives in the initial array
(10 feet to 40 feet) were carried forward to the final array.
4.4 Alternative Comparison and Evaluation of the Final Array
Ultimately four different variations of the authorized project were included in the Final Array and
simulated in Beach‐fx with full 100 iteration runs. The results of this analysis are summarized in the below
table. It should be noted that for Alternative 1, the total volumes of future resnousihsments would be
small enough that a different construction method, truck haul delivery of sand, could be used (as opposed
to dredging). As a result of this change the costs of Alterative 1 are somewhat less than previously
estimated.
Table 10: Final Array Alternative comparison using screening level costs
Alternative Berm Annual
Annual Cost Net Benefits
Width Benefits
1 10ft $946,391 $1,670,189 ‐$723,799
2 20ft $964,812 $1,784,456 ‐$819,645
3 30ft $995,902 $1,964,581 ‐$968,679
4 40ft $996,643 $2,165,180 ‐$1,168,537
*Average Annual Costs and Benefits computed at the FY17 water resourced discount rate (2.875%).
25Of the alternatives analyzed, none of them appear to economically justified with primary benefits alone
(damage reduction and land loss). However, three of them have a BCR greater than 0.5 with, which
indicates that they could be justified when incidental benefits (recreation) are included. Recreation
visitation numbers are large in the study area, and recreation benefits were a significant portion of total
benefits in the authorizing document.
Of the alternatives analyzed, the alternative that closest to justification is Alternative 1. It the highest BCR
and the lowest magnitude of negative net benefits. It also has the lowest overall cost. Therefore, it has
been selected as the Tentatively Selected Plan (TSP).
5 Tentatively Selected Plan
As noted in Section 4.2, the TSP is a modified version of the authorized project extended through a full 50
year period of analysis (2046). The project template is smaller than the authorized project (including the
10 foot advance fill extension beyond the design berm), as is the average fill density (approximately 108
cubic yards per linear foot). The renourishment interval has also been optimized through the Beach‐fx
analysis. Rather than seven years, the optimized renoursihment interval is five years. Based on the Beach‐
fx analysis, the average number of renourishment events throughout the remaining period of analysis is
five: 2018, 2023, 2028, 2032, and 2037. Beach‐fx analysis suggests that this modified version of the
project would be the most efficient plan and have the greatest net benefits. The purpose of this section
of the report is to describe the recommended plan in more detail, including refined costs, net benefits,
and project performance.
As noted in Section 2, the total average annual damage in the FWOP condition was estimated to be. In
the FWP project, the total is 754,215, indicating that the TSP is expected to reduce about 56% of total
damage and cost. A breakout of the FWP damages is provided in Table 11. A visual representation of the
damages over time is provided in Figure 10.
Table 11: Damages in the FWP condition
Damages +
Damages Armor Costs Land Loss Armor Cost +
Land Loss
Updrift Reach $0 $0 $158,019.78 $158,020
Project Reach $47,309.55 $395,953 $0.00 $443,262
Downdrift Reach $132,053.54 $0 $20,879.13 $152,933
Total $179,363 $395,953 $178,899 $754,215
26Figure 9 Damages and Costs over time
Damages and Armor Cost incurred over Time in Constant Dollars
$1,800,000
$1,600,000
$1,400,000
$1,200,000
$1,000,000
$800,000
$600,000
$400,000
$200,000
$0
2019
2020
2021
2022
2023
2024
2025
2026
2027
2028
2029
2030
2031
2032
2033
2034
2035
2036
2037
2038
2039
2040
2041
2042
2043
2044
2045
2046
Damages Armor Cost Land Loss
5.1 Project Performance in the SLR scenarios
As noted in Section 4, Corps guidance requires the analysis of three sea level scenarios. Therefore, it is
important to consider the performance of the selected plan in these scenarios. Most of the information
in this document describes results associated with baseline SLR scenario (SLR1). A sensitivity analysis was
conducted in Beach‐fx for the other two SLR scenarios. For the 60 foot project, the SLR Beach‐fx analysis
results are summarized in the below table (Table 12).
Table 12: Project Performance of the Recommended Plan in the SLR scenarios
SLR2 (Intermediate) SLR3 (High)
AAEQ FWOP Damage $1,797,536 $2,415,896
AAEQ FWP Damage $611,674 $670,980
AAEQ Benefits $1,185,862 $1,744,916
AAEQ Cost $2,509,797 $2,916,832
AAEQ Net Benefits ($1,323,935) ($1,171,916)
BCR 0.47 0.60
27The results indicate that while the FWOP damages increase in the accelerated SLR scenarios, the benefits
and costs also increase. Of the three scenarios analyzed, none of them appear to economically justified
with primary benefits alone (damage reduction and land loss). However, two of the three (including the
baseline) have a BCR greater than 0.5 with, which indicates that they could be justified when incidental
benefits (recreation) are included. The only scenario that appears to have a BCR less than 0.5 is the
Intermediate scenario. In this case, annual benefits only increase slightly, but annual costs increase
significantly.
5.2 Refined Costs of the Recommended Plan
After a plan is selected, a fully refined cost estimate can be developed. The alternative comparison used
screening level costs, which should be considered rough order of magnitude estimates. The fully refined
cost estimate includes a number of other costs, including PED, construction management, and a cost
contingency. As a result of these factors, the fully developed cost of the recommended plan is much
higher than the screening level estimate. Table 10 summarized the refined costs. The estimates assumes
an initial construction events: 2019, and four additional renouishment evets: 2019, 2023, 2028, 2033, and
2038. A summary of the refined project cost is provided in the table below. More information about the
cost estimate is provided in the cost appendix.
Table 13: Refined Project Costs for the Recommended Plan
Construction Cost (mobilization and placement) $21,954,000
Lands and Damages $153,000
Preconstruction, Engineering, and Design (PED) $3,701,000
Construction Management $1,150,000
Subtotal $26,958,000
Contingency $7,240,000
Total Project Cost $34,198,000
*Costs reflect the grand total for all renourishment events.
5.2.1 Economic Cost of the Recommended Plan
The Economic cost of the project must also account for the time value of money. Per planning guidance,
the costs and benefits of the NED Plan should be compared in average annual equivalent (AAEQ) terms.
It should be noted that, in this case, interest during construction (IDC) is not applicable because the project
has already been constructed and is already generating benefits. The total economic cost of the
recommended plan is summarized in Table 14.
Table 14: Economic Costs of the Recommended Plan
Total First Cost $34,198,000
IDC $0
Total Investment Cost $34,198,000
Present Value of Investment Cost $18,109,287
AAEQ of Investment Cost $799,360
285.3 Benefits of the Recommended Plan
5.3.1 Storm Damage Reduction Benefits
The recommended plan prevents about 56.6% of the without project damages. This reduction
is the source of primary project benefits. The benefits are summarized in Table 12.
Table 15: Storm Damage Reduction Benefits of the Recommended Plan
AAEQ Damages FWOP $1,521,707
AAEQ Damages FWP $575,316
AAEQ Benefits (damages reduced) $946,391
5.3.2 Land Loss Benefits
Typically, in shore protection studies, prevention of land loss is also part of the primary project
benefits. These benefits arise from preventing permanent loss of the upland (areas landward
of the existing dune). Upland has economic value, as it is the location of current and future
development (residential, commercial, etc). Beach‐fx estimates net shoreline changes over
time, including changes to the upland width. However, as noted in Section 2, many lots are
defined as currently armored or amorable in the future. The armor prevents erosion damage
to the upland in both the FWOP and FWP conditions. Therefore, land loss benefits do not
apply to some of the lots. For the remaining lots, land loss benefits have been computed. The
land loss benefits of the Recommended Plan are summarized below.
Table 16: Storm Damage Reduction Benefits of the Recommended Plan
AAEQ Value of Land Lost FWOP $215,482
AAEQ Value of Land Lost FWP $178,899
AAEQ Benefits (damages reduced) $36,583
5.3.3 Incidental Recreation Benefits
According to ER‐1105‐2‐100, incidental recreation benefits can be calculated in shore protection studies.
While recreation benefits cannot make up more than 50% of the total benefits needed for project
justification, the guidance states that “if the criterion for participation is met, then all recreation benefits
are included in the benefit to cost analysis.”
Additionally, ER‐1105‐2‐100 specifies that benefits arising from recreation opportunities created by a
project be measured in terms of willingness to pay. Three acceptable calculation methods are outlined:
(a) the travel cost method (TCM), (b) the contingent valuation method (CVM), and (c) the unit day value
method (UDV).
The unit day value method estimates a user’s willingness to pay for a given recreational opportunity by
assigning ratings to five criteria designed to measure the quality of the overall recreation experience
provided in the project area. According to ER‐1105‐2‐100 Appendix E, UDV may be used to account for
visitations of up to 750,000 per year. Historical data provided by Palm Beach County lifeguard counts
reported visitations to the public parks at the northern and southern extents of the project area as
29706,860 in 2016. The average growth rate between 2010 and 2016 was 2.03% annually, leading to an
estimated 750,793 visitations by 2019 (the project base year). Due to the efficiency of the UDV method,
the method was selected and visitations were capped at 750,000 throughout the period of the analysis.
Such a conservative visitation estimate means that recreation benefits are likely understated.
As mentioned above, the UDV method uses five criteria to gauge the overall quality of the recreation
experience, availability, carrying capacity, accessibility, and environment in the project area. Each
criterion can be assigned to one of five possible scoring ranges rated from low to high. Within each range
a specific point value is also chosen. These point values are summed together and applied a dollar day
value based on the current UDV guidance. The current unit day values, provided by USACE Economics
Guidance Memo #17‐03, Unit Day Values for Recreation for Fiscal Year 2017 (25 October 2016), are
presented in Table 17. Linear interpolation was used to estimate the dollar value of point scores not
published. For example, a point score of 2 corresponds with a dollar value of $4.11.
Table 17: Current Unit Day Values for Recreation (FY17)
General Recreation
Point Values Values (FY17)
0 $ 3.96
10 $ 4.70
20 $ 5.20
30 $ 5.94
40 $ 7.43
50 $ 8.42
60 $ 9.16
70 $ 9.66
80 $ 10.65
90 $ 11.39
100 $ 11.89
The point assignments are based on qualitative criteria and depend on best professional judgment (also
referred to as “judgment criteria”) and knowledge of the project area. In order to learn more about
recreation in Palm Beach County’s (PBC) Jupiter Carlin segment, SAJ economists met with members of
PBC, Department of Environmental Resources Management on February 9, 2016. This collaboration
helped in the assignment of the following judgment criteria applied to the project footprint.
Recreation Experience: A score of 16 representing “several general activities: one high quality value
activity” was assigned to the future with project condition in 2020 (the year after the initial beach
nourishment) and held constant throughout the remaining period of federal participation (through
2045). In the without project condition, the assigned score starts at 14 in the project base year
(2019) but drops to 8 over the planning time horizon, which is the low end of “Several general
activities”.
In both the future‐with and without project conditions, surfing, paddle boarding, surf fishing,
snorkeling, and sunbathing are general activities occurring in the study area. The quality of on‐beach
activities enjoyed by families, such as sunbathing and playing games, is expected to improve in the
with project condition compared to the without project condition due to the difference in the size of
sandy beach area available for recreation between the two scenarios. The combined berm and dune
30You can also read