PCN Dashboard - Northern Cancer Alliance
←
→
Page content transcription
If your browser does not render page correctly, please read the page content below

NHS England and NHS Improvement

               PCN Dashboard
                              User Guide v1.0
                               11 March 2021

ViewPoint
ViewPoint Contents & quick reference Topic Slide Number(s) About the PCN dashboard 3 to 16 How to register access 17 to 19 Providing feedback 20 to 23 About NHS ViewPoint 24 to 27
ViewPoint

About the
PCN
Dashboard
ViewPoint

Problem statement – what it is trying to solve?

Provide all PCNs with a standardised view of information to:

• help them understand their patient populations’ health needs
  and access to services

• support local quality improvement through monitoring, tracking
  and delivery on DES network service specifications, Impact
  Investment Fund, manifesto commitments and LTP objectives
ViewPoint

The Primary Care Network dashboard - what it should do…
WHO IT IS FOR
PCNs, CCG, ICS/STP and NHSI/E staff who work with PCNs and make decisions in relation to service provision for their populations

WHAT IT IS and WHAT IT SHOULD DO?
An interactive report that presents data across IIF and DES service specifications, population health and prevention, urgent care and
anticipatory care, prescribing and hospital use to give an overview of key indicators for an organisation of interest and provides the ability
to compare against other organisations e.g. similar 20 PCNs (see next slide) and parent organisations (i.e. PCN to region/national).

OUR SOLUTION
Provides a standard view across all PCNs that supports and enables investigation of how PCNs are
progressing against the individual indicators and links to other reports within NHS ViewPoint to enable
further investigation into specific areas of interest
• Does not require manual generation
• Is updated automatically when data sources are updated, providing a consistent, current view and is
  accessible by all PCNs
• Generates shared and comparable views across the country
• Supports the implementation of the long-term plan
• Saves seeking out of nationally available data
ViewPoint

‘PCN Similar 20’ benchmarking methodology
Your PCN is compared to its 20 most similar PCNs. This is used to identify realistic
opportunities to improve health and healthcare for your population. Demographic factors
have been used to compare PCNs with similar populations to account for potential factors
which may drive variation. The demographic factors include:
•   Deprivation
•   Population size
•   Rural-urban population
•   Age
•   Ethnicity
Please note, the use of the PCN similar 20 aims to compare like with like as much as
possible. Some local interpretation will still need to be applied to the data.

ViewPoint

   What’s happened so far?
    We’ve taken an agile iterative design and development approach

               Stage 1: Scoping                                    Stage 2: Refining and early development                                                              Stage 3: Building
                                                                                                                 Minimum
                                                                                 NHS E&I SMT Feedback              viable
                                                                                                                                      On-                                        UAT testing   Prioritise
   Initial          Early              Indicators                                                                 product                                       Build                                        MVP
                                                                                                                                    boarding                                     of Minimum    feedback
  request        engagement             research                                                                  content                                   visualisation                                   Release
                                                                                                                                      data                                          Viable      round 1
                                                     High level                                                 refinement
                                                                                                                                                                                   Product
                                                       themes                                                                                                                                                          Prioritise
                                                                         Engagement:
Request from    Based on           Collated all       & content
                                                                         •    RCGP                                            • Workforce                                                                              feedback
                                                                                                                                                         • Summary page
                                                       for PCN
                                                                         •    Primary Care PCN regional Leads                 • Prevention
Primary Care    engagement         available data    dashboard                                                  Landing and
                                                                                                                              • Activity
                                                                                                                                                         • Table view                                                 for further
                                                                         •    PCN Confed                                                                 • Indicator page
team to         with a PCN         and commonly       identified                                                  indicator
                                                                                                                              • Wider System                                                                            releases
develop the     reference          used primary                                                                     page                                 • Indicator deep dive
                                                                                                                              • Impact and
                                                                                                                 wireframes
PCN             group and NHS      care indicators                                                              development
                                                                                                                              Investment Fund
dashboard       E&I SMTs           that can be                                                                                • Service specifications
                                                                                   SME conversations                 and
against the     develop first      calculated at                                                                 refinement
LTP             iterations of      PCN level as
commitment      possible user      well as new
                journey            indicators
                through            agreed through                                                               Feasibility
                themed key         contract                                                                     prototyping
                lines of enquiry   negotiations.
                and desired
                insights
ViewPoint

How the PCN report is structured (1)
                                       Summary page

‘Impact and Investment Fund’ tab   ‘Service specifications’ tab   ‘Context & Delivery’ tab
ViewPoint

How the PCN report is structured (2)

     Table View page     Indicator page

                                          Deep dive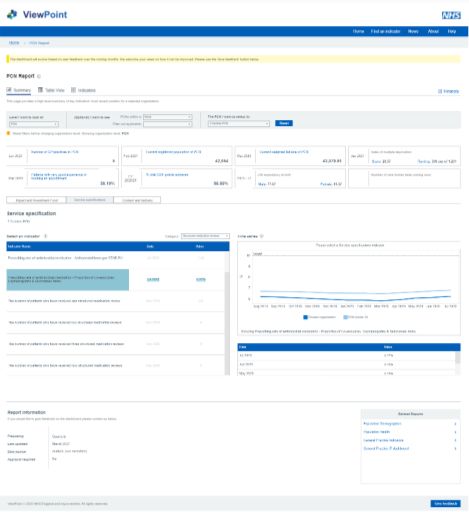
ViewPoint

                                         Report navigation icons:
                                         •  Summary page
                                         •  Table view                         Link to report
How the                                  •  Indicator page                     metadata

summary page
is structured
                                               Organisation
                                               selection filters      Tabs to navigate
Contains a series of visualisations to                                between 3 themes
show current position and trends.

Tabs to change between three
themes: Impact and Investment
Fund, Service Specifications and                     Indicator           Time series
Context and Delivery.                                selector table

Filters to change between
                                                                       Table of data
organisational levels of analysis                                      points over time

Navigation to further detailed
information and metadata views
ViewPoint
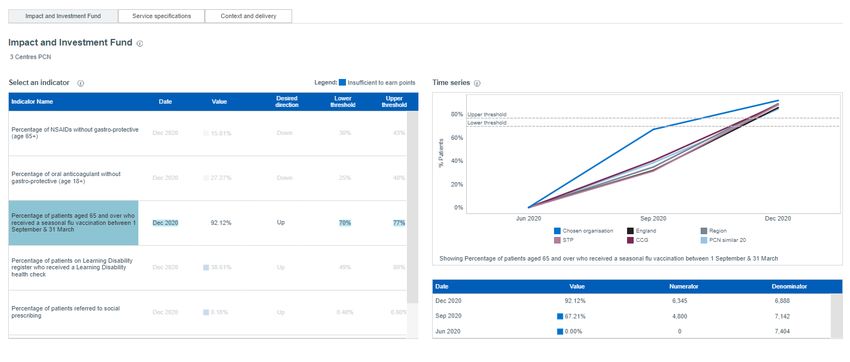
Summary page: Impact and Investment Fund tab
The user can select one of the indicators
from the table and the following graph will
update to display the trend over time for the
selected PCN and compared with Parent
geographies and Similar 20 PCNs
The table shows the
latest value for each
of the IIF indicators
and the relevant
thresholds.
Final PCN achievement and associated payment levels for the IIF will be collected and calculated as detailed in the Network Contract DES and accompanying IIF guidance. Performance as displayed in the PCN Dashboard is indicative only, but uses the same
data sources that will be used for achievement calculation.
https://www.england.nhs.uk/wp-content/uploads/2020/03/Network-Contract-DES-Specification-PCN-Requirements-and-Entitlements-2020-21-October-FINAL.pdf
Section 9.9 and Annex C and D
https://www.england.nhs.uk/wp-content/uploads/2020/09/IIF-Implementation-Guidance-2020-21-Final.pdfViewPoint
Summary page: Context and Delivery tab – Workforce and Access
Reports the latest FTE and
change from previous period
for PCN and GP practice staff
as captured by the National
Workforce Repository System
Shows the proportion of
patients registered at the GP
practices with access to online
servicesViewPoint
Summary page: Context and Delivery tab – Prevention and Wider System
Selected indicators identify the latest
number and proportion of patients
who have received a preventative
immunisation/screening
A number of indicators highlight the
usage of the wider health care
system by patients registered at GP
practices related to the selected PCNViewPoint
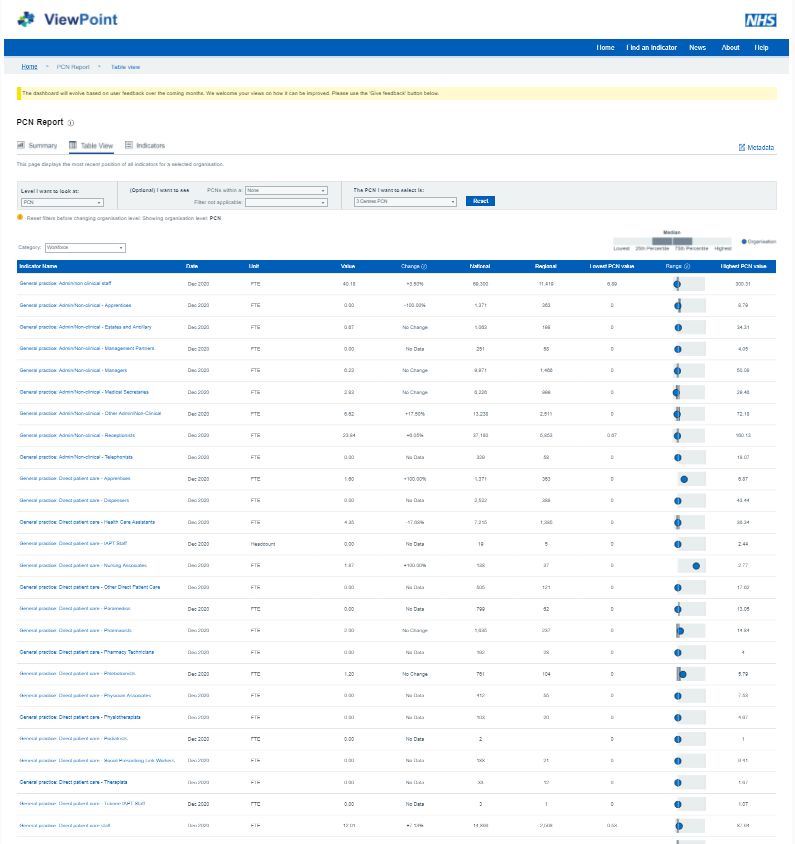
How the table Report navigation icons
view page is
structured Organisation
selection filters
Provides detail on all the
National
available indicators in the PCN average for
Category filter to show
dashboard for a selected indicators from one indicators
organisation. category at a time
Each indicator will display the
most recent data point.
Lowest/highest
values for selected
area type i.e. if a is
selected CCG this will
reflect lowest and
highest of all other
CCG valuesViewPoint
Report navigation icons
How the Indicator search/list
Indicator
description and
indicator source information
page is Select organisational
Filter to group
organisations
structured level of interest within select table
Filter to order
Provides additional information for Organisation select table organisations in
Individual row using table
all indicators within the PCN mouse click
dashboard
Navigation to Deep
Table - showing indicator value, dive page at PCN
numerator and denominator. organisation level
Ranked bar chart/thematic map for
selected organisational level.
Ranked bar chart,
Line chart - time series analysis thematic map, time
series and outlier
Box & whisker chart – inter quartile chart to reflect
selections made in
range outlier analysis above table.ViewPoint
Indicator Deep dive – GP practice focus
Shows the value for the
relevant indicator for all the Identifies the location of the
GP practices included in the relevant GP practices on a map
currently selected PCN
Allows comparison across the
GP practices within the PCN Show trends across the GP
practices within the PCNViewPoint How to register Regional Performance and Quality Dashbo ard
ViewPoint

       How to register an account for NHS ViewPoint

                                                       2                                                                3
                                                                                                                                  Scroll through the list of

   1
           Visit the following link:
                                                                 Complete the                                                     products and services
           Register | Insights
                                                                 registration process.                                            available and request
           Platform (model.nhs.uk)
                                                                                                                                  access to NHS ViewPoint

NHS ViewPoint is located in the NHS Insights Platform where other NHS data and analytical products can also be found. If you already have an OKTA account you can directly
sign onto the https://apps.model.nhs.uk and request access to NHS ViewPoint or register for the Insights Platform and then request access. NHS ViewPoint can be directly
accessed at www.viewpoint.nhs.uk. If you have any problems registering please email england.viewpoint@nhs.net and we will endeavour to resolve the issue.
ViewPoint
How to register an account for NHS ViewPoint
4 Once access has been
granted navigate to
NHS ViewPoint 5
Select ‘PCN Report’ under
the list of reports on the
NHS ViewPoint landing page
6 Explore the ‘PCN Report’
NHS ViewPoint is located in the NHS Insights Platform where other NHS data and analytical products can also be found. If you already have an OKTA account you can directly
sign onto the https://apps.model.nhs.uk and request access to NHS ViewPoint or register for the Insights Platform and then request access. NHS ViewPoint can be directly
accessed at www.viewpoint.nhs.uk. If you have any problems registering please email england.viewpoint@nhs.net and we will endeavour to resolve the issue.ViewPoint Providing Regional Feedback Performance and Quality Dashbo ard
ViewPoint

User acceptance testing (UAT)
We asked subject matter experts and end users to test and feedback on the
functionality, design and direction of the PCN dashboard during a user testing
phase earlier this year.

Some of the feedback has been actioned with improvements being made to
the following:

    •   New layout of organisational filters across all views
    •   Additional fields in the Impact and Investment Fund (IIF) table
    •   Additional descriptions and tooltips to aid interpreting IIF indicators
    •   Tooltips and messaging to aid overall navigation

We are continuing to work through this feedback and will make improvements
to the dashboard on an ongoing basis. If you’d like to provide feedback, please
see slide 23.
ViewPoint
What should I know before looking at the PCN dashboard?
Known issues:
• Summary page – Service specification category filter is not defaulting by
alphabetical order.
• Indicator page user interface bug – the mouse pointer does not change to a
hand cursor when hovering over some active buttons.
• Indicator page deep dive - the reset button on the Deep Dive does not reset the
highlight in visualisations.
If you discover a bug not referenced above, please use the report a bug form.
Click here for the
'Report a bug' formViewPoint
How to provide feedback
The link below will take you to a feedback form.
If you are reporting a specific issue then please provide
as much detail as possible so that we can identify and
replicate the problem i.e. filter(s) selected,
visualisation(s) affected, button(s) being used that don't
provide expected navigational behaviour.
Click here to
provide feedback
If you have any queries regarding specific indicators,
please contact england.gpcontracts@nhs.net.ViewPoint About NHS ViewPoint
ViewPoint About NHS ViewPoint NHS ViewPoint is part of a wider NHSE/I strategy being developed to form an ‘ecosystem’ of digital, analytical and insight products that will support health and care systems with both population health management and the improvement of their service delivery and patient outcomes. The NHS ViewPoint analytical product is a series of linked intelligence tools providing a shared view of performance and population health data for people working at all levels within the health and social care system. It can help users to understand their system and identify where there are opportunities to improve service delivery and health outcomes. As the product develops it will highlight an increasing number of areas that warrant further examination and identify additional opportunities that can improve population health outcomes. NHS ViewPoint is being developed iteratively following agile scrum principles and user-centred design. It will continue to evolve as new asks for content, data and functionality are considered, tested and released.
ViewPoint

About NHS ViewPoint

The NHS ViewPoint analytical product will:

 • Hold a collection of different dashboards
 • Have the ability to cross navigate between different dashboards
   within the portal
 • Have the ability to triangulate data and look at 'key lines of
   enquiry' across the full indicator library
 • Have specialised deep dives on an individual indicator that can
   be navigated to from a report or an indicator index
ViewPoint

            www.viewpoint.nhs.uk
You can also read