Performance comparison between the high-speed Yokogawa spinning disc confocal system and single-point scanning confocal systems
←
→
Page content transcription
If your browser does not render page correctly, please read the page content below

Journal of Microscopy, Vol. 218, Pt 2 May 2005, pp. 148 – 159
Received 16 November 2004; accepted 27 February 2005

Performance comparison between the high-speed Yokogawa
‘Blackwell Publishing, Ltd.

spinning disc confocal system and single-point scanning
confocal systems

E . WA N G , C . M . B A B B E Y & K . W. D U N N
Department of Medicine, Division of Nephrology, Indiana University Medical Center, Indianapolis, IN
46202–5116, U.S.A.

Key words. Photobleaching, single-point scanning confocal, spinning disc
confocal.

                                                                                   of living cells and tissues. Studies of the dynamics of fluores-
Summary
                                                                                   cently tagged molecules have emphasized the need for high-
Fluorescence microscopy of the dynamics of living cells presents                   resolution imaging systems capable of collecting images
a special challenge to a microscope imaging system, simulta-                       rapidly, but with illumination levels low enough to avoid
neously requiring both high spatial resolution and high temporal                   damaging light-sensitive fluorophores and cells. The difficulty
resolution, but with illumination levels low enough to prevent                     of imaging cellular dynamics is further exaggerated in studies
fluorophore damage and cytotoxicity. We have compared the                          of thick cells and tissues, which require that multiple focal
high-speed Yokogawa CSU10 spinning disc confocal system with                       planes be collected for each time point, incurring proportional
several conventional single-point scanning confocal (SPSC)                         increases in photobleaching, and decreases in temporal resolu-
microscopes, using the relationship between image signal-                          tion. Thus three-dimensional (3D) imaging over time places
to-noise ratio and fluorophore photobleaching as an index of                       the strictest requirements on an imaging system, simultaneously
system efficiency. These studies demonstrate that the efficiency                   requiring high lateral and axial resolution, high speed and
of the CSU10 consistently exceeds that of the SPSC systems. The                    efficiency sufficient to provide usable images with minimal
high efficiency of the CSU10 means that quality images can be                      illumination.
collected with much lower levels of illumination; the CSU10                           Three-dimensional imaging is typically conducted using con-
was capable of achieving the maximum signal-to-noise of an                         focal microscopy based upon a single-point scanning confocal
SPSC system at illumination levels that incur only at 1/15th of                    (SPSC) design in which a point of laser illumination is rapidly
the rate of the photobleaching of the SPSC system. Although                        raster-scanned across a sample, sequentially building up a 2D
some of the relative efficiency of the CSU10 system may be                         image as the emissions are simultaneously collected through
attributed to the use of a CCD rather than a photomultiplier                       a confocal pinhole. In most systems this scanning process is
detector system, our analyses indicate that high-speed imaging                     slow, with images collected at around one frame per second,
with the SPSC system is limited by fluorescence saturation at                      a rate too slow to capture dynamics in a 3D volume consisting
the high levels of illumination frequently needed to collect images                of 15–30 optical sections. High-speed scanning systems are
at high frame rates. The high speed, high efficiency and freedom                   capable of increasing frame rates of SPSC systems to 30 frames
from fluorescence saturation combine to make the CSU10 effec-                      per second (Tsien & Bacskai, 1995), but the rate of image
tive for extended imaging of living cells at rates capable of captur-              acquisition by SPSC systems is ultimately limited by the number
ing the three-dimensional motion of endosomes moving up to                         of photons of fluorescence that can be collected from a diffraction-
several micrometres per second.                                                    limited area in pixel dwell times lasting fractions of a microsecond.
                                                                                   Fluorescence may be increased with more illumination, but
Received 16 November 2004; accepted 27 February 2005

                                                                                   only to an upper limit defined by fluorescence saturation, a
Introduction
                                                                                   condition in which the excitation photon flux is high enough
The development of genetically engineered fluorescent pro-                         to deplete the electronic ground state of the fluorophore,
teins has resulted in a renaissance in fluorescence microscopy                     effectively decreasing the amount of ‘excitable’ fluorophore in
                                                                                   the volume.
Correspondence to: Dr Kenneth W. Dunn. Tel.: +1 317 278 0436; fax: +1 317             One way of rapidly collecting confocal images without
274 8575; e-mail: kwdunn@iupui.edu                                                 fluorescence saturation is to parallelize confocal image collection.

                                                                                                                      © 2005 The Royal Microscopical Society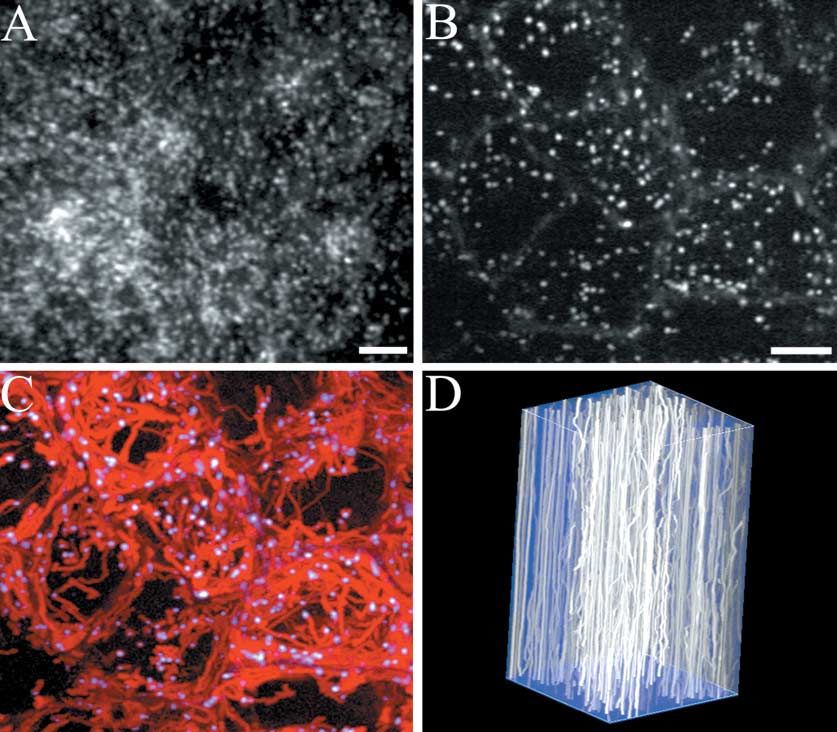
P E R F O R M A N C E O F C O N F O CA L S YS T E M S   149

By collecting a number of points simultaneously, high frame
                                                                              Methods and materials
capture rates can be obtained without resorting to very brief,
very intense illuminations. For example, much higher frame
                                                                              Microscope systems
capture rates can be attained by scanning a line across a
sample and collecting fluorescence through a confocal slit.                   The Yokogawa CSU10 spinning disc confocal scanner system was
With small image sizes, line-scanning systems are capable of                  evaluated using a Perkin-Elmer Ultraview system mounted on
collecting images at hundreds of frames per second. However,                  a Nikon TE 2000U inverted microscope, using Nikon 60× or
these systems offer poorer axial resolution and background                    100× NA 1.4, oil-immersion planapochromatic objectives. The
rejection (Amos & White, 1995).                                               system is equipped with a Hamamatsu Orca-ER CCD system
   Confocal imaging can also be conducted by simultaneously                   (Bridgewater, NJ, U.S.A.). Comparison studies were conducted
scanning an array of diffraction-limited points across a                      on several SPSC systems, including a Bio-Rad MRC-1024
sample, and collecting fluorescence emissions through a set of                confocal scanner mounted on a Nikon Eclipse 200 inverted
confocal pinholes. Generally this approach has been imple-                    microscope, using the same Nikon 100× or 60× NA 1.4 oil-
mented by illuminating a spinning, perforated disc (Nipkow                    immersion objectives, a Zeiss LSM-510 confocal scanner attached
disc) that rotates rapidly enough that the points of fluores-                 to a Zeiss Axiovert 100M inverted microscope, a Zeiss LSM-510-
cence effectively merge into a 2D image that can be collected                 META confocal scanner mounted on a Zeiss Axioplan upright
with a CCD. The first versions of this design suffered from the               microscope using a Zeiss 100×, NA 1.4 oil-immersion plana-
poor transmission of illumination through the disc; however,                  pochromatic objective and an Olympus FV1000 system, using
this problem has been alleviated by a recent design that utilizes             a 60×, NA 1.4 oil-immersion objective.
microlenses to focus 40% of the illuminating light through the
pinholes (Tanaami et al., 2002). This system, the Yokogawa
                                                                              Live cell microscopy
CSU10, has found wide utility among cell biologists (Inoue &
Inoue, 2002; Nakano, 2002; Adams et al., 2003; Maddox                         Fluorescence studies were conducted using the PTR clone of
et al., 2003).                                                                strain II cells, transfected with both the human transferrin
   Some investigators have noted that extended imaging                        receptor (TfR) and the rabbit polymeric immunoglobulin receptor
studies using the CSU10 system are remarkably free of                         (pIgR) or with Madin-Darby Canine Kidney (MDCK) strain II cells
photobleaching and have suggested that its superior per-                      stably transfected with both rabbit pIgR and green fluorescent
formance results from the high efficiency of its CCD detector or              protein (GFP)-Rab25 (Wang et al., 2001). Endosomes were
from the low illumination dosage of a spinning disc system                    labelled by incubation in 20 µg mL−1 TexasRed-transferrin in
(Inoue & Inoue, 2002; Maddox et al., 2003). We have applied                   Medium 1 (150 mm NaCl, 20 mm HEPES, 1 mm CaCl2, 5 mm
an assay of the photon economy of a confocal microscope                       KCl, 1 mm MgCl2, 10 mm glucose, pH 7.4) on the microscope
system, as measured by the image signal-to-noise ratio (SNR)                  stage maintained at 37 °C with a microscope stage heater, using
returned for a given level of photobleaching, to compare quan-                either a Warner Instruments TC324B (Hamden, CT, U.S.A.)
titatively the efficiency of the Yokogawa system against several              or Medical Systems Corp. PDMI-2 (Greenvale, NY, U.S.A.).
SPSC microscope systems. These studies demonstrate that,                      TexasRed-transferrin was prepared from the succinimidyl
when imaging at moderately high rates, the CSU10 system is                    ester of Texas Red, obtained from Molecular Probes (Eugene,
capable of reproducing the highest SNR measured for an SPSC                   OR, U.S.A.), as described previously (Wang et al., 2001).
system at approximately 1/15th of the rate of the photo-
bleaching. At higher levels of illumination, the Yokogawa system
                                                                              Measurements of resolution
is capable of collecting images with SNRs four-fold higher
than the highest observed with the SPSC systems. Our ana-                     Subresolution fluorescent beads, 0.1 µm (Molecular Probes),
lyses also demonstrate significant fluorescence saturation                    were diluted in 0.1 mg mL−1 poly-d-lysine solution. A dilute
in the SPSC system, but not in the CSU10 system. These                        solution of beads was spread evenly on a cover slip, air-dried at
observations support the hypothesis that the high-speed                       room temperature and mounted in ∼5 µL glycerol. SPSC images
performance advantage of the CSU10 at least partially                         were Kalman averaged for four frames, and images from the
derives from the low photon dosage of its illumination                        CSU10 were integrated for 300 ms. Vertical stacks of images
system, which limits peak illumination to a small fraction                    were collected on both systems at an interval of 0.1 µm, with a
of that of the SPSC systems. Thus the superior performance of                 pixel size of 0.067 µm for 100× objectives, and 0.112 µm for
the CSU10 results not only from a more efficient mechanism                    the 60× objective.
of fluorescence collection, but also a more efficient
mechanism of fluorescence excitation. These characteristics,
                                                                              Measurements of SNR and photobleaching rates
together with the high frame rate of the system, combine to
make the CSU10 particularly effective for 4D imaging of living                InSpeck Green (505/515) Microscope Image Intensity Calibra-
cells.                                                                        tion Kit, 2.5-µm fluorescent beads (Molecular Probes) were

© 2005 The Royal Microscopical Society, Journal of Microscopy, 218, 148–159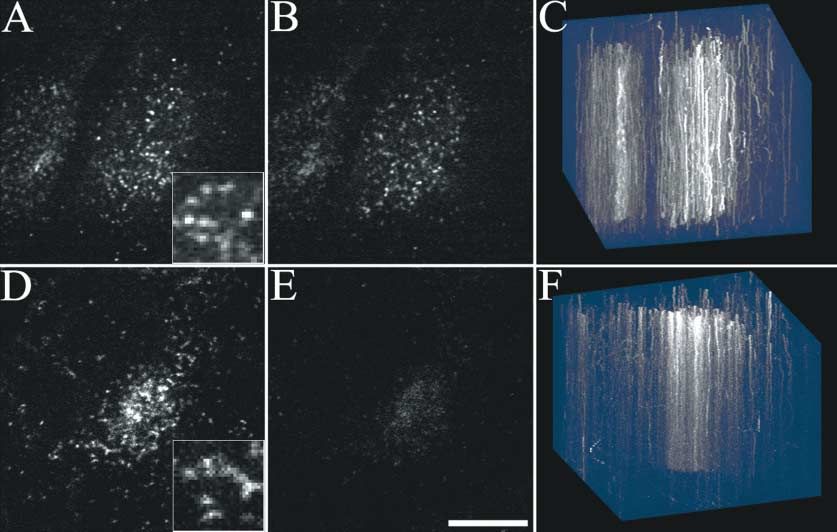
150   E . WA N G E T A L .

spread evenly onto cover slips. The spread beads suspension          samples, this method yielded noise estimates similar to
was air-dried at room temperature and the cover slip was then        those in which noise is measured from field-wise spatial
placed on top of an 8-µL glycerol droplet on a slide.                variability.
   Images were collected with acquisition settings as compara-          Photobleaching rates were obtained by fitting the single
ble as possible for the CSU10 and SPSC systems. In both cases,       exponential curve to the signal values of the first 20 images in
100× NA 1.4 planapochromatic objectives were used. The same          each time series. The SNR value for the bead prior to photo-
pixel size was achieved by adjusting the zoom of the SPSC            bleaching was obtained by extrapolating the exponential
system to yield 0.067-µm pixels, the fixed pixel size of the CSU10   curve back to the 0th exposure point.
with a 100× objective (measured with a stage micrometer).               Our approach to measuring system SNR follows that of Murray
The pinhole was set to 1 Airy unit on the SPSC system to match       (1998), with one exception. In order to incorporate image
the CSU10 system. For both systems, 512 × 512-pixel, 12-bit          resolution into the system efficiency measurement, Murray
images were collected at 1.66 frames per second, the maxi-           analysed SNR in subresolution sized fluorescent beads. We
mum speed of the SPSC system for this frame/pixel size. For          analysed images of 2.5-µm beads, which we found provided
both systems, illumination was provided by the 488-nm                more consistent measurements, and separately verified that
line of an Ar laser, and the same type of emission filter (500–      the resolution of the two systems was similar.
550 nm) was used.
   The camera gain of the Orca-ER CCD of the CSU10 system
                                                                     Calculations of pixel dwell times and peak illumination intensities
was set at minimum, and images were collected without
binning, integrated for 573 ms, at a readout rate of 14.75           Our calculations of instantaneous illumination levels are
MHz pixel−1. The photomultiplier tube voltage of the SPSC sys-       based upon the following calculations. The disc of the CSU10
tems was set within the range in which image SNRs were               is perforated with 12 sets of pinholes arranged in a constant
found to be constant and maximal. As SNRs were found to be           pitch helical pattern so that when the disc is rotated at 30 revo-
independent of camera gain of the CCD on the CSU10 and               lutions per second, a given point in the sample is illuminated
independent of PMT gain on the SPSC systems, the SNR per-            360 times per second. Because only 4% of the disc is perforated
formance of each system was determined only by illumination          (Inoue & Inoue, 2002; Maddox et al., 2003), this point actu-
level and system design. A series of 100 images was collected        ally spends 96% of the time between illuminations. Thus, in
for each over a range of illumination levels. Throughout the         the case of an image collected for 1 s, the point is illuminated
collection, detector saturation was avoided.                         for a total of 40 ms. As there are 360 illuminations per second,
   SNR and photobleaching measurements were made using               the duration of each illumination is 40/360 or 111 µs. In
Metamorph software (Universal Imaging, Downington, PA,               contrast to the CSU10 system, the pixel dwell time in an SPSC
U.S.A.) and a custom-written program, following a procedure          system is varied to achieve a particular frame rate. For the
developed by Murray (1998). For measurements of signal, the          signal-to-noise studies described here, images were collected
original image is first smoothed using a 3 × 3 low-pass filter. A    at a rate of one every 590 ms. At this rate, the pixel dwell time
threshold was determined to create a bead mask and signal            of the SPSC system was 0.96 µs, or 116 times shorter than
was measured from the mean intensity of pixels within the            that for the CSU10. In the course of collecting a single image,
mask, after subtracting the background.                              each pixel was illuminated once for the SPSC system, whereas
   The conventional method for estimating image noise is             each pixel was illuminated 212 times (0.59 × 360) for the
based upon the variation of pixel intensities around a mean          CSU10 system. Thus, for this frame rate and pixel dwell time of
in a homogeneous field. As the design of our studies required        the SPSC, the instantaneous illumination level is 212 × 116,
imaging a heterogeneous sample of fluorescent beads, we              or 24 592-fold higher on the SPSC for an equivalent total
used the equivalent procedure in which noise is estimated            illumination.
from the variation around a local mean, as defined by a 3 × 3           Illumination power measurements were made in triplicate
mean filter. In this calculation the 3 × 3 mean filtered image       measurements at the back aperture of the objective, using a
provides the local mean value for each pixel. The departure          13PDC001 power meter and 113PDH003 integrating sphere
of each pixel from this local mean reflects pixel noise. A ‘noise    from Melles Griot (Carlsbad, CA, U.S.A.).
image’ is created by subtracting the local mean value from
the original value for each pixel in the image. The intensity
                                                                     Image processing for presentation
of each pixel in the noise image is then squared, and noise
estimated as the square root of the sum of these squared             The images shown here were contrast stretched to enhance
values (root mean square). This noise estimate is based upon         the visibility of dim structures using Photoshop (Adobe,
the assumption that intensity variations on the scale of single      Mountain View, CA, U.S.A.). Specific care was taken never to
pixels are determined by noise, a reasonable assumption              enhance the contrast in such a way that dim objects were
as the 0.067-µm pixel size is small relative to the resolution       deleted from an image. Images to be compared were always
of the system. In separate measurements of homogeneous               processed identically.

                                                                         © 2005 The Royal Microscopical Society, Journal of Microscopy, 218, 148– 159
P E R F O R M A N C E O F C O N F O CA L S YS T E M S 151
Volume renderings were conducted using Voxx, a PC-based
High-speed confocal microscopy
image analysis program developed at the Indiana Center for
Biological Microscopy (Clendenon et al., 2002) and available Because the spinning disc of the CSU10 scans the field 360
free from http://nephrology.iupui.edu/imaging/voxx. times per second, the system has the potential to collect
images at very high rates. In practice, the rate of image
acquisition is limited by both the pixel clock rate of the CCD
Results
and the amount of available signal. The 14.75-MHz band-
width of the system used here limits image transfer rates to
Resolution
nine full frames (1344 × 1024 pixels) per second, or 23 frames
We first verified the resolution of our confocal microscopes per second when the image size is reduced to 256 × 256.
by collecting image volumes of subresolution fluorescent These are theoretical upper limits, as they do not include time
microspheres. As the pinholes of the CSU10 system are sized to integrate the fluorescent signal. Although image capture
to approximately 1 Airy diameter for a 100× NA 1.4 objective rates will obviously slow as integration times increase to
lens at 500 nm (according to the manufacturer’s specifica- accommodate weak signals, actual image capture rates can
tions), the pinhole of the SPSC system was adjusted to a dia- approach these values because image integration can occur
meter of 1 Airy unit, and images were collected using the same simultaneously with data transfer in the interline-transfer
100× objective lens. The two systems showed nearly identical CCD used here.
horizontal resolution (the full-width of half-maximal profile For example, in many of our samples, adequate signal is
intensity was 0.21 µm for the SPSC vs. 0.23 µm for the CSU10, obtained with integrations of 36 ms, allowing us to collect
Fig. 1A), while the CSU10 system provided somewhat worse 256 × 256-pixel images at 20 frames per second. An example
axial resolution, with a half-maximal intensity extending is shown in Fig. 2(A), which shows the first of 600 images of
0.71 µm vs. 0.60 µm for the SPSC system (Fig. 1B). We can living MDCK cells expressing a chimera of GFP and the vesicle-
detect no differences between the two systems in the tails of associated protein Rab25. Two versions of this time series may
these profiles, which decline together to background levels be viewed as movies at http://www.nephrology.iupui.edu/
with distance from the bead. wang_etal. The first, Movie 2A-actual, shows the first 200
Because the size of the pinholes is fixed in the CSU10 system, frames of the time series, displayed at the same rate at which
resolution is necessarily worse when using lower power objec- the images were collected (20 frames per second). The second,
tives for which the pinholes are oversized. As expected, when Movie 2A-3X, shows the entire 600-frame time series displayed
images were collected with a 60× NA 1.4 objective, the axial at 3× the actual rate. The first animation demonstrates the actual
resolution of the CSU10 system decreased, with half-maximal speed with which the Rab25-associated endosomes move
intensity approaching 0.85 µm (Fig. 1C). In contrast, when the through the cells in the field. The second animation emphasizes
size of the adjustable pinhole of the SPSC system was reduced the activity, but is more noteworthy for the fact that the
to accommodate the smaller Airy disc of the 60× objective, the fluorescence of the endosomes is largely undiminished. Quan-
system provided axial resolution of 0.52 µm. tifications of images at the beginning and end of the time series
Fig. 1. Comparison of the resolution of the CSU10 system and a conventional single-point-scanning system. (A) Horizontal resolution of the CSU10
(closed circles) and conventional SPSC (open circles) systems. For each system a stack of images of 0.1-µm-diameter fluorescent beads were collected with
an axial spacing of 0.1 µm and a pixel width of 0.067 µm using the same 100×, NA 1.4 Planapo oil-immersion objective. (B) Axial resolution of the CSU10
(closed circles) and conventional SPSC (open circles) systems. (C) Axial resolution of the CSU10 (closed circles) and conventional SPSC (open circles)
systems using the same 60×, NA 1.4 oil-immersion objective.
© 2005 The Royal Microscopical Society, Journal of Microscopy, 218, 148–159152 E . WA N G E T A L .
Fig. 2. High-speed imaging of endosomes in living MDCK cells. (A) The first frame of a time series of images of a field of cells expressing GFP-Rab25,
a vesicle-associated protein, collected at 20 frames per second over a period of 30 s. Animations of this time series may be found at
www.nephrology.iupui.edu/wang_etal. The entire time series is replayed at 3× its actual rate in Movie 2A-3X, and Movie 2A-actual shows an abbreviated
time series played at the actual rate. 252 × 256-pixel images, binned 2 × 2, were collected with a 60×, NA 1.2 water-immersion objective. (B) The first
frame of a time series of images of a field of cells incubating in a solution of TexasRed-labelled transferrin, a protein that is internalized into endosomes,
collected at 11 frames per second over a period of 100 s. The entire time series is replayed at 3× its actual rate in Movie 2B-3X, whereas the Movie 2B-actual
shows an abbreviated time series played at the actual rate. This time series is summarized in C, where the original endosome positions are shown in blue,
and the subsequent trajectories in the image plane shown in red. D presents another summary of the endosome trajectories of B and C in a 3D volume in
which the vertical axis represents time. Different perspectives of this volume can be viewed on the accompanying animation (Movie 2D). 256 × 224-pixel
images, binned 2 × 2, were collected with a 100×, NA 1.4 oil-immersion objective. Scale bars = 5 µm.
demonstrate that fluorescence is decreased by only 7% over system is such that bright images of endosomes are obtained,
the collection of 600 images. and the background fluorescence of transferrin in the medium
The first image of a similar time series is shown in Fig. 2(B), is suppressed. Two versions of this time series are presented at
which shows a field of living MDCK cells incubating in a medium the website. The first, Movie 2B-actual, is replayed at its true
containing TexasRed-labelled transferrin, a protein that is rate, 11 frames per second, whereas in the second, Movie
internalized into endosomes. The optical sectioning of the 2B-3X, the entire 1110-frame time series is displayed at 3× the
© 2005 The Royal Microscopical Society, Journal of Microscopy, 218, 148– 159P E R F O R M A N C E O F C O N F O CA L S YS T E M S 153
actual speed. The motion of the endosomes is summarized
Photobleaching and sensitivity analyses
in Fig. 2(C), in which the original endosome positions are
displayed in blue, and the trajectories of the endosomes The time series shown in Fig. 2 indicate that the CSU10 system
over the 100-s period of imaging are shown in red. As in is capable of extended image collection with minimal damage
the field shown in Fig. 2(A), this time series is noteworthy to the cells or to the fluorophore. We compared the perform-
for the minimal effect of protracted illumination on endosome ance of the CSU10 system with an SPSC system, by collecting
fluorescence. In fact quantifications of endosome fluorescence time series of fluorescence images of GFP-Rab25 in transfected
show a small increase (2%), a result that may reflect the MDCK cells. A series of 200 images were collected at 2 frames
continuous turnover of fluorescent transferrin in the per second (the highest speed at which the SPSC system could
endosomes. The relatively constant endosome fluorescence collect 256 × 256-pixel images with sufficient signal) using
is more apparent in Fig. 2(D) (and its accompanying anima- 100× NA 1.4 oil-immersion objectives. Figure 3(A,B) show
tion, Movie 2D), in which the entire time series is displayed the first and last frames, respectively, collected with the CSU10
as a 3D volume, with the vertical axis representing time system, and Fig. 3(D,E) show the first and last frames, respec-
(an xyt volume). The lack of photobleaching in the field is tively, collected with the SPSC system. Whereas the level of
apparent from the constant intensity of the individual endosome fluorescence is relatively unaffected by repeated
endosome traces. imaging by the CSU10 system, the endosomes are essentially
Fig. 3. High-speed time series imaging of MDCK cells stably expressing GFP-Rab25; comparison of the CSU10 spinning disc system with a conventional
SPSC system. (A) The first of a time series of images collected with the CSU10; (B) the 200th image. Comparison of the two panels reveals minimal
photobleaching over the interval, an impression more directly demonstrated in C (and its accompanying animation, Movie C), which represents the time
series of images as a volume in which time is represented as the vertical axis. (D – F) The corresponding images collected with a conventional single-point-
scanning system. Comparison of D and E, and inspection of F (and its accompanying animation, Movie 3F) shows that the intensity of the endosome
fluorescence is obviously diminished by the 200th image collected with this system. Animations of the time series (Movies 3A and D) are shown at 8× their
actual rates. For both systems, images were collected at 2 frames per second, with a pixel size of 0.13 µm, and a frame size of 256 × 256 pixels, using a
100×, NA 1.4 Planapo oil-immersion objective, with the confocal pinholes set at 1 Airy diameter. Scale bar = 10 µm. Insets, showing magnified portions
of A and D, are 4 µm across.
© 2005 The Royal Microscopical Society, Journal of Microscopy, 218, 148–159154 E . WA N G E T A L .
invisible by the end of the time series collected with the SPSC two systems (Fig. 4C,D). Photobleach decay rates were meas-
system. The difference in photobleaching between the two ured from a single exponential decay curve fit to the first 20
systems is also apparent in the animations of the time series time points of each time series and plotted against the original
(Movies 3A and D), or in the xyt image volumes shown in SNR, as estimated by extrapolating the SNR curve back to the
Fig. 3(C,F) (and their accompanying animations, Movies 3C 0th exposure point (Fig. 4E). This analysis demonstrates
and F). that although the two systems have similar SNR values at
The comparison shown in Fig. 3 is compelling but not extremely low illumination levels, with increasing illumina-
rigorous. Although images were collected with comparable tion the SNR of the CSU10 system increases much more
settings as far as possible (with the same pinhole size, pixel size rapidly than the SPSC system, such that at the highest levels of
and frame rate), it is possible that this test underestimated the illumination the SNR of the CSU10 is more than four times
performance of the SPSC system by utilizing too high a level that of the SPSC system.
of illumination. Although this is unlikely, given that the It should be emphasized that the SPSC system used for this
highmagnification insets shown in Fig. 3(A,D) suggest better analysis had a theoretical advantage over the CSU10 as it was
signal-to-noise in the CSU10 image, we next conducted a more attached to an upright microscope stand, whose more direct
rigorous comparison of the two systems, following a modified lightpath to the detector should be more efficient than that of
version of the protocol described by Murray (1998) (see the inverted stand-mounted CSU10 system. Consistent with
Methods). this, slightly worse performance was measured in an otherwise
In this analysis, the efficiency of a microscope system can be identical SPSC system mounted on an inverted microscope
evaluated from the signal-to-noise of its images attained from stand (with a maximum SNR of 17). Similar tests were performed
a given level of illumination, as estimated from the rate of fluo- with SPSC systems from two other manufacturers, but neither
rescence photobleaching. Time series of images of fluorescent performed better than the SPSC system characterized in Fig. 4.
microspheres were collected at various levels of illumination Thus the SNR performance of the CSU10 was significantly
using either the CSU10 or an SPSC system set with comparable better than that of four different SPSC systems from three
imaging parameters as much as possible (see Methods), with different manufacturers.
each system collecting 1.66 images per second. For each bead
image, signal was estimated from the mean pixel fluorescence
The role of fluorescence saturation in high-speed confocal
in a threshholded region, and noise was measured as the root
microscopy
mean square deviation of the individual pixel intensities from
a 3 × 3 low-pass filter. Some of the performance disparity between the systems evalu-
The results of these studies are summarized in Fig. 4. ated here may result from the higher quantum efficiency of
Figure 4(A,B) each show horizontal intensity profiles through the ORCA-ER CCD of the CSU10 as compared with PMT detec-
one particular bead initially and after collection of 100 frames tors of the SPSC systems evaluated here. However, quantum
at the highest levels of illumination for the SPSC and CSU10, efficiency of the CCD system would have to be 16 times that of
respectively. Filled circles show the region of the bead used to the PMT systems to explain the four-fold difference in signal-to-
quantify the total summed fluorescence of the bead, and the noise performance. In addition, our data suggest that the per-
3 × 3 low-pass filtered images are shown as solid lines. In both formance of the SPSC system is not determined simply by the
figures the pixel values of the original image fluctuate around sensitivity and noise characteristics of its detector system. For
the values of its smoothed version. However, the fluctuation shot-noise-limited imaging, such as that here, signal-to-noise
with the SPSC system is substantially more than with the should increase as the square root of signal. Although this is
CSU10. true for the CSU10, it is true only at the lowest levels of illumina-
The mean pixel fluorescence of approximately 30 beads was tion for the SPSC system, suggesting additional limiting factors.
quantified for each point in the time series for each level of illu- The bulk of the difference in performance may result from
mination, resulting in a set of photobleaching curves for the the difference in how the two systems collect fluorescence
Fig. 4. Comparison of the efficiency of the CSU10 system and a conventional single-point-scanning system. For both systems a series of images of 2.5-µm-
diameter fluorescent beads were collected at 1.66 frames per second with a pixel size of 0.067 µm, and a frame size of 512 × 512 pixels, using a 100×, NA
1.4 Planapo oil-immersion objective. For the conventional SPSC system, the confocal pinhole was set at 1 Airy diameter and PMT voltage was set in the range
where image SNR is independent of voltage. (A) Representative intensity profiles across the image of a bead after the first and 100th frames, collected with
the single-point-scanning system. (C) Decay of the mean fluorescence of fields of fluorescent beads (each containing approximately 30 beads) imaged at
varying levels of illumination over the course of 100 frames. The corresponding data collected with the CSU10 system are shown in B and D. For each bead
a mean signal was calculated from the mean intensity of a masked region of the bead (filled circles), a root-mean-squared noise was calculated from the
deviations of the detected pixel intensities from the corresponding values after applying a 3 × 3 mean smoothing filter (solid lines), and a photobleaching
rate was determined from a single-exponential fit to the first 20 points of the fluorescence decay curve. The results of this analysis are presented in E, which
shows the relationship between image SNR and photobleaching rate for the CSU10 (squares) and the conventional SPSC system (triangles).
© 2005 The Royal Microscopical Society, Journal of Microscopy, 218, 148– 159P E R F O R M A N C E O F C O N F O CA L S YS T E M S 155 © 2005 The Royal Microscopical Society, Journal of Microscopy, 218, 148–159
156   E . WA N G E T A L .

                                                                                        Fig. 5. Fluorescence saturation in SPSC, but not
                                                                                        CSU10 systems. (A) The relationship between signal
                                                                                        and illumination power for the CSU10 (solid circles)
                                                                                        and the SPSC system (open circles) when imaging at
                                                                                        1.66 frames per second. Whereas signal increased
                                                                                        linearly with power for the CSU10, the SPSC system
                                                                                        clearly saturates at high power levels. (B) Relationship
                                                                                        between SNR and illumination power for the CSU10
                                                                                        (closed circles) and the SPSC systems (open circles).
                                                                                        Smooth curves were fit by hand.

images, specifically from the greater susceptibility of the SPSC     individual endosomes in three dimensions, but also collects
system to fluorescence saturation (Inoue & Inoue, 2002;              high-quality images even after the hundreds or thousands of
Maddox et al., 2003). The high-speed performance of SPSC             illuminations needed for 3D imaging over time.
systems is limited by the fact that in order to collect sufficient      Figure 6(A) shows a stereo anaglyph of the first of 49 image
fluorescence in pixel dwell times lasting only microseconds          volumes collected from a 9-µm-high field of cells incubating
(0.96 µs in the case shown here), SPSC systems will frequently       in fluorescent transferrin. This time series was captured at
need to be operated with very high levels of illumination, levels    9 frames per second, or one 18-section volume every 2 s.
that can be sufficient to saturate fluorophore fluorescence          Despite the relatively coarse temporal sampling (one volume
(Sandison et al., 1995; Sheppard et al., 1995). In contrast, the     every 2 s), the individual endosome motions are clear in the
illumination of the CSU10 system is spread over a large              animation of the time series (Movie 6A, replayed at 16× actual
number of relatively long illuminations. For the specific case       rate). That this sampling frequency is sufficient is also evi-
shown here, illumination is spread over 212 doses, each last-        denced in Fig. 6(B), which shows a projection of all of the
ing 116 times as long as the single illumination of the SPSC         time points in a single volume, showing the largely unbroken
system. In this case, for the same total integrated illumination,    trajectories of the endosomes over the entire 100-s interval
the peak illumination of the Yokogawa system is less than 1/         of collection.
24 000th that of the SPSC system.                                       A similar volume of MDCK cells incubating in fluorescent
   Fluorescence saturation can be detected as a departure            transferrin is shown in Fig. 6(C), which shows a stereo
from a linear relationship between fluorescence and illumina-        anaglyph of the first of 113 image volumes collected over
tion power. In order to evaluate the significance of fluores-        100 s. Brighter labelling in this sample supported an image
cence saturation in the performance of the SPSC system, we           acquisition rate of 18 frames per second, or slightly more than
repeated the studies described above, measuring bead signal          one 16-plane volume per second. Because of the higher
levels and illumination power over the same range of illumina-       acquisition rate, endosome motion is smoother, as shown in
tion levels. As shown in Fig. 5(A), we found that whereas fluo-      the accompanying animation of the time series (Movie 6C,
rescence increases linearly with power for the CSU10 system,         replayed at 8× actual rate), and in the projected time series
the rate of fluorescence excitation clearly slows with increas-      (Fig. 6D).
ing power in the SPSC system. Note that although it appears in
this plot as if the SPSC is returning a higher signal for a given
                                                                     Discussion
power level, these values are compensated for by higher noise
levels, as in the previous analysis. The resulting relationships     The analysis of living cells is a powerful but challenging appli-
between SNR and illumination (Fig. 5B) are nearly identical to       cation of fluorescence microscopy. Fluorescence microscopy is
those of SNR and photobleaching rate shown in Fig. 4. These          nearly always signal-limited, but the problem is exaggerated
results indicate that the performance of the SPSC is at least        in studies of living cells, which severely limit the typical solu-
partially limited by fluorescence saturation when imaging at         tions to low SNR. Whereas SNR can be improved by increasing
moderately high frame rates.                                         illumination in fixed cells, the level of illumination that may be
                                                                     used for living cells is limited by phototoxicity, and photobleach-
                                                                     ing of fluorophores. Photobleaching is especially problematic
Four-dimensional microscopy with the CSU10 – 3D imaging over
                                                                     because living cells do not tolerate the chemical singlet oxygen
time
                                                                     quenchers typically used to reduce photobleaching. Longer
The combined speed and efficiency of the CSU10 makes it              image integrations will also improve SNR, but may also render
uniquely suitable for collecting 3D image volumes over time.         the system incapable of resolving the dynamics that probably
The system not only collects images rapidly enough to follow         motivated the studies in the first place.

                                                                         © 2005 The Royal Microscopical Society, Journal of Microscopy, 218, 148– 159
P E R F O R M A N C E O F C O N F O CA L S YS T E M S 157 Fig. 6. High-speed 3D imaging of endosomes in living MDCK cells. (A) A stereo anaglyph image of the first volume of a time series of image volumes of a field of cells incubating in a solution of TexasRed-labelled transferrin, collected at 0.5 volumes per second (9 frames per second) over a period of 100 s. For each volume, images were collected every 0.5 µm through a depth of 9 µm. The accompanying animation (Movie 6A) is replayed at 16× its actual rate. 256 × 224-pixel images, binned 2 × 2, were collected with a 100×, NA 1.4 oil-immersion objective. (B) A stereo anaglyph image of the trajectories of the endosomes over the entire interval. (C) A stereo anaglyph image of the first volume of a time series of image volumes of a field of cells incubating in a solution of TexasRed-labelled transferrin, collected at 1.1 volumes per second (18 frames per second) over a period of 100 s. For each volume, images were collected every 0.6 µm through a depth of 9.6 µm. The accompanying animation (Movie 6C) is replayed at 8× its actual rate. (D) A stereo anaglyph image of the trajectories of the endosomes over the entire interval. 256 × 256-pixel images, binned 2 × 2, were collected with a 60×, NA 1.2 water-immersion objective, with a 1.5× magnifying lens. Scale bars = 5 µm. Numerous studies have demonstrated the capability of the 2002), calcium transients (Ishida et al., 1999), microvascular CSU10 system for imaging living cells. Applications blood flow (Oyanagi-Tanaka et al., 2001) and microtubule include studies of vesicular transport (Nakano, 2002; dynamics (Adams et al., 2003; Canman et al., 2003; Hwang Kreitzer et al., 2003), actin dynamics (Pelham & Chang, et al., 2003). © 2005 The Royal Microscopical Society, Journal of Microscopy, 218, 148–159
158   E . WA N G E T A L .

   Some of these investigators have found the CSU10 remarkable         electrons in the excited state, the significance of the triplet
for its ability to support extended imaging of living cells with       state is less clear.
strikingly little photobleaching (Inoue & Inoue, 2002; Maddox             Another advantage of the CSU10 is that, in the course of
et al., 2003). Our studies demonstrate that this relative free-        integrating many observations, noise is effectively averaged,
dom from photobleaching derives from the high efficiency of            reducing it by 1/√n. For shot noise, integrating many observa-
the CSU10 system, which supports collection of high-SNR                tions results in a noise estimate that is mathematically
images with very low levels of illumination. The CSU10 is              equivalent to that for a single observation of the integrated
capable of reproducing the highest SNR measured for an SPSC            sum. However, multiple sampling can statistically reduce
system at approximately 1/15th the rate of photobleaching.             other sources of noise such as that resulting from laser power
At higher levels of illumination the Yokogawa system is cap-           fluctuations. For example, the power output of Ar lasers may
able of collecting images with SNRs four-fold higher than the          vary by 1% or more at megahertz frequencies and thus can
highest observed with the SPSC systems.                                substantively contribute to variations between adjacent pixels
   Although the higher efficiency of the CSU10 may partially           in SPSC systems (Swedlow et al., 2002).
reflect the inherently better signal-to-noise performance of              Although the spinning disc design of the CSU10 has signifi-
CCD-based vs. PMT-based detector systems, much of the                  cant advantages over SPSC systems for high-speed imaging,
advantage appears to derive from its freedom from fluores-             SPSC systems have several advantages over the CSU10, mak-
cence saturation. When imaging at moderately high speeds               ing it more suitable for many applications. First, whereas
(1.66 frames per second) fluorescence scaled linearly with             we have found that the CSU10 provides similar background
illumination power for the CSU10, but the rate of fluorescence         rejection for thin specimens, it is less successful with thicker
excitation declined with illumination in the SPSC system.              samples with significant amounts of out-of-focus fluorescence,
These observations support the hypothesis that the high-               for which crosstalk between adjacent pinholes on the disc
speed performance advantage of the CSU10 at least partially            becomes significant (Reichelt & Amos, 2001; Egner et al.,
derives from the low photon dosage of its illumination system,         2002). SPSC systems are also far more flexible. Whereas the
which limits peak illumination to a small fraction of that of the      size of the confocal apertures of the CSU10 is fixed, limiting
SPSC systems. Whereas the illumination of the SPSC systems             truly confocal operation to a 100×, NA 1.4 objective, the
is limited to a single, very brief exposure, the CSU10 system          pinhole size of SPSC systems can be varied to suit different
spreads illumination out over a large number of relatively long        microscope objectives and different experimental needs.
exposures. When collecting images at 1.66 frames per second,           Unlike the CSU10, SPSC systems offer the capability of altering
this amounts to 24 000-fold lower peak illumination in the             the size of the scanned area. This capability supports flexible
CSU10 system. Thus if illumination levels are increased to             sizing of pixels to optimize digital sampling, and is also neces-
compensate for the shorter pixel dwell times necessary for high-       sary for studies of the dynamics of photobleaching recovery.
speed imaging with SPSC systems, they can rapidly reach                Unlike SPSC systems that can simultaneously collect multiple
levels that saturate fluorescence.                                     channels in perfect registration, multicolour images must be
   Thus the minimal photobleaching seen in extended studies            collected in series with the CSU10 system, or by using optically
using the CSU10 system may reflect not only the higher effi-           complex image-splitting systems. Finally, quantitative studies
ciency of CCD-based systems, but also the freedom of this              are complicated in the CSU10 by a field of illumination that
system from the effects of fluorescence saturation, which              is less homogeneous than that for SPSC systems, due to the
limits SNRs, decreases resolution, increases background                difficulty of homogeneously illuminating the disc with an
and perhaps accelerates destructive higher order interactions          expanded laser beam.
(Sandison et al., 1995). In practice, fluorescence saturation can         Thus, depending upon the application, SPSC systems will
be detected in a particular study by increasing illumination           frequently provide more capabilities than the CSU10. Insofar
and evaluating whether signal increases linearly with illumina-        as the CSU10 is limited to relatively thin samples, wide-field
tion power.                                                            microscopy should likewise be considered as an alternative
   Collecting signal over multiple illuminations gives the CSU10       which would provide the same speed, and would enjoy the
additional potential advantages. First, the intervals between          same advantages from CCD detection and low photon dosage.
illuminations provide fluorophores with multiple opportunities         A quantitative comparison of confocal and wide-field micro-
to return to the ground state, effectively increasing the con-         scope systems found that wide-field systems are better capable
centration of ‘excitable’ fluorophore. For each second of image        of resolving dim objects, apparently because of their superior
collection, fluorophores are given 360 dark intervals (without         noise performance (Swedlow et al., 2002). Optical sectioning
illumination), each lasting 2.7 ms. This is more than sufficient       equivalent to that found in confocal microscopes can be pro-
time for all electrons in the excited state and most (if not all) of   vided through digital deconvolution (Swedlow & Platani,
those in the long-lived triplet state to return to the ground          2002), which also has the effect of increasing the signal-to-
state. While, as discussed above, the levels of illumination           noise of dim objects (Swedlow et al., 2002). However, relatively
used for the CSU10 will seldom induce an accumulation of               high levels of fluorescence are needed to make this approach

                                                                           © 2005 The Royal Microscopical Society, Journal of Microscopy, 218, 148– 159
P E R F O R M A N C E O F C O N F O CA L S YS T E M S 159
practical, as image deconvolution is very sensitive to image Ishida, H., Genka, C., Hirota, Y., Nakazawa, H. & Barry, W.H. (1999)
noise (van Kempen et al., 1997; Verveer et al., 1999), which Formation of planar and spiral Ca2+ waves in isolated cardiac myocytes.
invariably accompanies imaging at high speed. Biophys. J. 77, 2114–2122.
van Kempen, G.M.P., van Vliet, L.J., Verveer, P.J. & van der Voort, H.T.M.
In summary, by implementing a system of microlenses on a
(1997) A quantitative comparison of image restoration methods for
spinning disc, Yokogawa has realized the potential of the Nipkow-
confocal microscopy. J. Microsc. 185, 354 –365.
based confocal microscope system for biological microscopy.
Kreitzer, G., Schmoranzer, J., Low, S.H., Li, X., Gan, Y., Weimbs, T.,
Not only is the CSU10 capable of collecting images much more Simon, S.M. & Rodriguez-Boulan, E. (2003) Three-dimensional ana-
rapidly than SPSC systems, it does so with much higher lysis of post-Golgi carrier exocytosis in epithelial cells. Nature Cell Biol.
efficiency. The performance advantage of the CSU10 system 5, 126–136.
derives not only from its more efficient collection, but also from Maddox, P.S., Moree, B., Canman, J.C. & Salmon, E.D. (2003) Spinning
more efficient excitation made possible by an illumination disk confocal microscope system for rapid high-resolution, multimode,
system that maximizes the population of fluorophores in the fluorescence speckle microscopy and green fluorescent protein imag-
ground state, effectively optimizing the amount of fluorescence ing in living cells. Methods Enzymol. 360, 597– 617.
stimulated from a given number of fluorophore molecules. Murray, J.M. (1998) Evaluating the performance of fluorescence micro-
scopes. J. Microsc. 191, 128–134.
Together, these characteristics support extended 4D imaging
Nakano, A. (2002) Spinning-disk confocal microscopy – a cutting-edge
of living cells at rates sufficient to capture the 3D motion of
tool for imaging of membrane traffic. Cell Structure Function, 27, 349–
intracellular vesicles moving up to several micrometres per
355.
second. Oyanagi-Tanaka, Y., Yao, J., Wada, Y., Morioka, T., Suzuki, Y., Gejyo, F.,
Arakawa, M. & Oite, T. (2001) Real-time observation of hemodynamic
changes in glomerular aneurysms induced by anti-Thy-1 antibody.
Acknowledgements
Kidney Int. 59, 252–259.
This research was supported by NIH grants RO1 DK51098 Pelham, R.J. & Chang, F. (2002) Actin dynamics in the contractile ring
and P50 DK 61594–01 (K.W.D.) and a grant (Indiana during cytokinesis in fission yeast. Nature, 419, 82– 86.
Genomics Initiative) from the Lilly Endowment to the Indiana Reichelt, S. & Amos, W.B. (2001) SELS: a new method for laser scanning
University School of Medicine. The studies were conducted at microscopy of live cells. Microsc. Anal. November, 9 –11.
Sandison, D.R., Williams, R.M., Wells, K.S., Strickler, J. & Webb, W.W.
the Indiana Center for Biological Microscopy.
(1995) Quantitative Fluorescence confocal laser scanning microscopy
(CLSM). Handbook of Biological Confocal Microscopy (ed. by J. B. Pawley),
References pp. 39 –53. Plenum, New York.
Sheppard, C.J.R., Gan, X., Gu, M. & Roy, M. (1995) Signal to noise in
Adams, M.C., Salmon, W.C., Gupton, S.L., Cohan, C.S., Wittmann, T., confocal microscopes. Handbook of Biological Confocal Microscopy (ed. by
Prigozhina, N. & Waterman-Storer, C.M. (2003) A high-speed multi- J.B. Pawley), pp. 363–388. Plenum, New York.
spectral spinning-disk confocal microscope system for fluorescent Swedlow, J.R., Hu, K., Andrews, P.D., Roos, D.S. & Murray, J.M. (2002)
speckle microscopy of living cells. Methods, 29, 29 – 41. Measuring tubulin content in Toxoplasma gondii: a comparison of
Amos, W.B. & White, J.G. (1995) Direct view confocal imaging systems laser-scanning confocal and wide-field fluorescence microscopy. Proc.
using a slit aperture. Handbook of Biological Confocal Microscopy (ed. by Natl Acad. Sci. USA, 99, 2014–2019.
J.B. Pawley), pp. 403– 415. Plenum, New York. Swedlow, J.R. & Platani, M. (2002) Live cell imaging using wide-
Canman, J.C., Cameron, L.A., Maddox, P.S., Straight, A., Tirnauer, J.S., field microscopy and deconvolution. Cell Structure Function, 27, 335–
Mitchison, T.J., Fang, G., Kapoor, T.M. & Salmon, E.D. (2003) Determin- 341.
ing the position of the cell division plane. Nature, 424, 1074 –1078. Tanaami, T., Otsuki, S., Tomosada, N., Kosugi, Y., Shimizu, M. & Ishida, H.
Clendenon, J.L., Phillips, C.L., Sandoval, R.M., Fang, S. & Dunn, K.W. (2002) High-speed 1-frame/ms scanning confocal microscope with a
(2002) Voxx: a PC-based, near real-time volume rendering system for microlens and Nipkow disks. Appl. Optics, 41, 4704 – 4708.
biological microscopy. Am. J. Physiol. – Cell Physiol. 282, C213– C218. Tsien, R.Y. & Bacskai, B. (1995) Video-rate confocal microscopy. Hand-
Egner, A., Andresen, V. & Hell, S.W. (2002) Comparison of the axial reso- book of Biological Confocal Microscopy (ed. by J. B. Pawley), pp. 459–478.
lution of practical Nipkow-disk confocal fluorescence microscopy with Plenum, New York.
that of multifocal multiphoton microscopy: theory and experiment. J. Verveer, P.J., Gemkow, M.J. & Jovin, T.M. (1999) A comparison of image
Microsc. 206, 1–32. restoration approaches applied to three-dimensional confocal and
Hwang, E., Kusch, J., Barral, Y. & Huffaker, T.C. (2003) Spindle orienta- wide-field fluorescence microscopy. J. Microsc. 193, 50 – 61.
tion in Saccharomyces cerevisiae depends on the transport of microtu- Wang, E., Pennington, J.G., Goldenring, J.R., Hunziker, W. & Dunn, K.W.
bule ends along polarized actin cables. J. Cell Biol. 161, 483– 488. (2001) Brefeldin A rapidly disrupts plasma membrane polarity by
Inoue, S. & Inoue, T. (2002) Direct-view high-speed confocal scanner: the blocking polar sorting in common endosomes of MDCK cells. J. Cell Sci.
CSU-10. Methods Cell Biol. 70, 87–127. 114, 18 –21.
© 2005 The Royal Microscopical Society, Journal of Microscopy, 218, 148–159You can also read