Plant responses to heterogeneous salinity: agronomic relevance and research priorities - Oxford Academic
←
→
Page content transcription
If your browser does not render page correctly, please read the page content below
Annals of Botany 129: 499–517, 2022
https://doi.org/10.1093/aob/mcac022, available online at www.academic.oup.com/aob

                                                           INVITED REVIEW

     Plant responses to heterogeneous salinity: agronomic relevance and research
                                      priorities
      Francisco Jose Valenzuela1, Daniela Reineke1, Dante Leventini1, Christopher Cody Lee Chen1,
Edward G. Barrett-Lennard2,3, Timothy D. Colmer4,5, Ian C. Dodd6, Sergey Shabala7,8, , Patrick Brown1,* and
                                          Nadia Bazihizina9,*,

                                                                                                                                               Downloaded from https://academic.oup.com/aob/article/129/5/499/6529474 by guest on 11 June 2022
 Department of Plant Sciences, University of California, Davis, CA, USA, 2Land Management Group, Agriculture Discipline,
 1

College of Science, Health, Engineering and Education, Murdoch University, WA, Australia, 3Department of Primary Industries
   and Regional Development, South Perth, WA, Australia, 4UWA School of Agriculture and Environment, The University of
    Western Australia, Crawley, WA, Australia, 5Institute of Agriculture, The University of Western Australia, Crawley, WA,
   Australia, 6The Lancaster Environment Centre, Lancaster University, Lancaster, UK, 7Tasmanian Institute of Agriculture,
 University of Tasmania, Hobart, TAS 7001, Australia, 8International Research Centre for Environmental Membrane Biology,
  Foshan University, Foshan 528000, China, and 9Department of Agriculture, Food, Environment and Forestry, University of
                                                  Florence, Florence, Italy
                      * For correspondence. E-mail nadia.bazihizina@unifi.it or phbrown@ucdavis.edu

        Received: 18 November 2021    Returned for revision: 2 February 2022 Editorial decision: 8 February 2022 Accepted: 14 February 2022
                                                      Electronically published: 16 February 2022

              • Background Soil salinity, in both natural and managed environments, is highly heterogeneous, and under-
              standing how plants respond to this spatiotemporal heterogeneity is increasingly important for sustainable agricul-
              ture in the era of global climate change. While the vast majority of research on crop response to salinity utilizes
              homogeneous saline conditions, a much smaller, but important, effort has been made in the past decade to under-
              stand plant molecular and physiological responses to heterogeneous salinity mainly by using split-root studies.
              These studies have begun to unravel how plants compensate for water/nutrient deprivation and limit salt stress by
              optimizing root-foraging in the most favourable parts of the soil.
              • Scope This paper provides an overview of the patterns of salinity heterogeneity in rain-fed and irrigated sys-
              tems. We then discuss results from split-root studies and the recent progress in understanding the physiological
              and molecular mechanisms regulating plant responses to heterogeneous root-zone salinity and nutrient conditions.
              We focus on mechanisms by which plants (salt/nutrient sensing, root-shoot signalling and water uptake) could
              optimize the use of less-saline patches within the root-zone, thereby enhancing growth under heterogeneous soil
              salinity conditions. Finally, we place these findings in the context of defining future research priorities, possible
              irrigation management and crop breeding opportunities to improve productivity from salt-affected lands.

              Key words: Irrigation, nutrient heterogeneity, phytohormones, root foraging, root-to-shoot signalling, salt sensing,
              stomatal conductance, water uptake.

                       INTRODUCTION                                        occurs as a result of using irrigation water containing elevated
                                                                           levels of ions (e.g. Na+ and Cl−) without adequate, periodic
The world’s population is expected to increase to 9.9 billion              leaching of the accumulated salts from the soil. Secondary dry-
by 2050 (Liu et al., 2020a), prompting a need to double annual             land salinization can also occur in non-irrigated areas due to
food production within the next 30 years (Razzaq et al., 2021).            changes in the hydrological balance of a landscape and rising
To achieve this production goal, agriculture will inevitably ex-           water tables (e.g. as a result of replacing deep-rooted vegeta-
pand further into marginal lands (Pancaldi and Trindade, 2020;             tion with annual crop and pasture species, which results in a
Ahmadzai et al., 2021; Khanna et al., 2021; Razzaq et al.,                 higher proportion of incoming rain entering the groundwater;
2021), which often suffer from poor soil structure and low fer-            Pannell and Ewing, 2006; McFarlane et al., 2016). The problem
tility (Mantovani et al., 2015; Shukla et al., 2017). Many of the          is often exacerbated by decreases in soil permeability caused
marginal areas are also affected by soil salinity.                         by sodicity (i.e. when the accumulation of Na+ exceeds that of
    Soil salinity, both naturally occurring (i.e. primary saliniza-        other cations) and over-exploitation of groundwater, which ex-
tion) and as a consequence of human activities (i.e. secondary             haust high-quality water resources, resulting in water extrac-
salinization), is a threat to agriculture and a major limitation to        tion from less favourable groundwater that may be brackish or
food production. The salinization of agricultural land commonly

                                     © The Author(s) 2022. Published by Oxford University Press on behalf of the Annals of Botany Company.
                                                          All rights reserved. For permissions, please e-mail: journals.permissions@oup.com.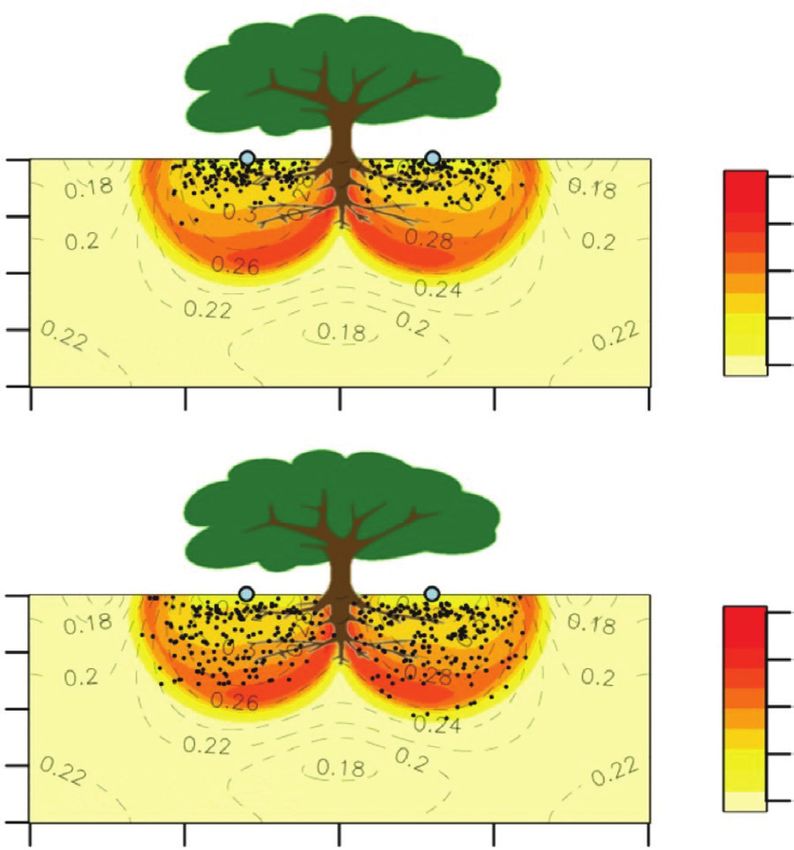
500 Valenzuela et al. — Plant responses to heterogeneous salinity
saline (Ruto et al., 2021). Increases in salinity can also be ex- ones, ranging from a few millimolar to several times seawater
pected in low-lying coastal areas associated with sea-level rise (Bazihizina et al., 2012a). The magnitude of this heterogeneity
due to climate change and salinization of groundwater due to varies in time and space depending upon soil parent material,
salt water intrusion into depleted aquifers (Vellinga and Barrett- landscape position (Aldabaa et al., 2015), soil physical and
Lennard, 2021). chemical characteristics (e.g. texture, sodicity and alkalinity;
While the vast majority of research on crop responses to sal- Hillel, 1980; Robbins et al., 1980), surface runoff and subsur-
inity has been conducted under homogeneous saline conditions, face lateral flow of water, intrusion by saline groundwaters or
root-zones of plants in both natural and managed environ- seawater (Tiggeloven et al., 2020; Choukr-Allah, 2021), and
ments can commonly experience spatial and temporal hetero- root water extraction (Heuperman, 1995; Barrett-Lennard and
geneity in soil salinity (Yakir and Yechieli, 1995; Bleby et al., Malcolm, 2000; Alharby et al., 2014, 2018). Climatic condi-
1997; Davidson et al., 1996; Silvestri et al., 2005; Xing et al., tions also affect the temporal and spatial heterogeneity of soil
2019; Zhang et al., 2019). The nature of soils and irrigation salinity, with rainfall leading to soil leaching events while
practice, crop type and phenology, climate-type and seasonal droughts and heatwaves concentrate solutes depending on soil
Downloaded from https://academic.oup.com/aob/article/129/5/499/6529474 by guest on 11 June 2022
weather, and the duration of crop exposure, together deter- features and topography, and differences in radiation and re-
mine the extent and impact of salinity and its heterogeneity on sulting evaporation due to aspect and slope (Schwantes et al.,
plant growth and crop productivity (Bazihizina et al., 2012a; 2018).
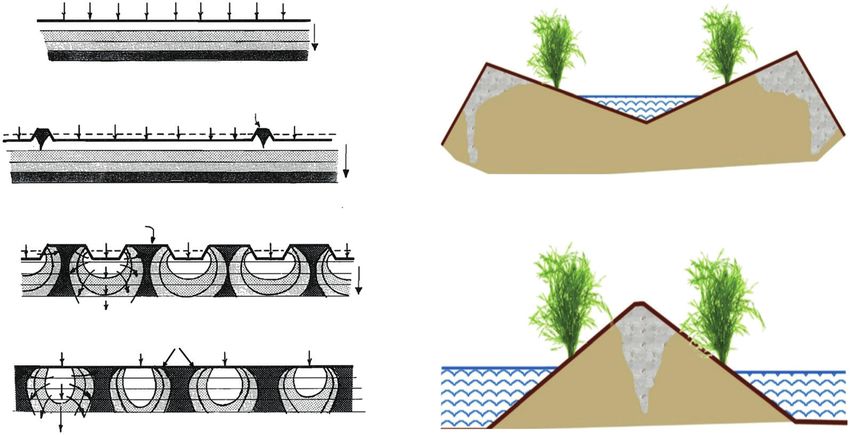
Northey et al., 2006; Bogunovic et al., 2017; Xing et al., 2019; Irrigation also dramatically influences soil salinity (Figs 2
Xu et al., 2019). Despite this complexity, most experiments on and 3). Irrigation-induced heterogeneity can commonly re-
the impacts of salinity on plants have imposed homogeneous sult in differences in soil ECe greater than 10-fold (Bernstein
root-zone salinity, which does not represent saline agricultural et al., 1955; Bernstein and Fireman, 1957; Bernstein,
settings. The extent of the temporal heterogeneity in soil sal- 1975). An extremely heterogeneous distribution of salinity
inity in the field is illustrated within an irrigated wheat trial in in irrigated systems makes it difficult to design a soil sam-
China (Fig. 1A) and a rain-fed wheat trial in Western Australia pling regime to determine the truly effective root-zone sal-
(Fig. 1B). These patterns of saline heterogeneity can be con- inity (Bernstein et al., 1955). This effect is highly relevant
trasted with the near homogeneous conditions commonly im- to modern drip and micro-irrigated agriculture (see Box 1
posed in controlled-environment research trials (Fig. 1C). Since for definition of terms) in arid regions (Fig. 2), which are
complex multi-faceted traits (developmental, physiological, the most common irrigation strategies in many areas of the
anatomical, morphological and biochemical) are involved in world. While micro-irrigation is generally considered a valu-
plant tolerance of salinity, this raises the question of whether able way to improve water use efficiency and allows con-
trials conducted under near-uniform soil (or root-zone) salinity trolled fertigation strategies, these systems may complicate
are indeed optimal for identifying and selecting traits of most salinity management, generating highly non-uniform salt and
value to increasing plant tolerance to the common reality of disparate nutrient deposition patterns below the irrigation
heterogeneous salinity. emitter (Bar-Yosef, 1999). These salt/nutrient deposition pat-
The generic guidelines used to predict crop response to soil terns below the micro-irrigation emitter directly impact root
and water salinity, produced under near homogeneous condi- growth, root activity, and nutrient and salt movement in the
tions, are generally described by crop yield curves that consist soil within the root zone, with effects strongly determined
of a threshold value at which salinity induced damage first oc- by crop placement, soil preparation, irrigation design and
curs, and a linear percentage yield reduction with every incre- management.
ment in the electrical conductivity of the saturated soil extracts Bar-Yosef (1999) further discussed the risk of salt accumula-
(ECe) thereafter (Maas and Hoffman, 1977; Maas and Grattan, tion in the root-zone under drip irrigation, suggesting that salts
1999). Such static diagnostic criteria do not reflect soil salinity are not efficiently displaced to the periphery of the wetted soil
under realistic field conditions that are highly spatially and tem- volume as might occur under a full surface irrigation system.
porally heterogeneous (Chen et al., 2019). Thus, the prevailing Under drip irrigation, salts can accumulate in the wetting front
standard of describing plant response to salinity is both inad- after several irrigation cycles but this wetting front will shrink
equate and generally overestimates crop response (Tanji & and swell with subsequent irrigation events and root water con-
Kielen, 2002), is not relevant nor easily interpreted under field sumption. Varying the frequency and volumes of irrigation
reality, and may not adequately inform irrigation practice, crop events can manipulate this salt displacement and represents a
selection or salinity mitigation strategies (Ayars, 2012). In the management strategy. Salts can also accumulate at the upper
following, we summarize the pattern of occurrence of salinity margin of the wetted soil volume (close to the soil surface)
heterogeneity in rain-fed and irrigated systems, and discuss re- due to capillarity driven by soil evaporation. This effect is par-
sults from studies of plant responses to heterogeneous root-zone ticularly marked with buried drip irrigation systems where the
salinity. We then discuss the mechanistic understanding of root depth of irrigation tubes, shape of the furrow, plant and envir-
physiological and morphological adaptations to heterogeneous onmental water use patterns (Fig. 3) influence the ultimate salt
conditions, and place these findings in the context of defining distribution.
future research priorities and possible management and crop Based upon current understanding, irrigation system place-
breeding opportunities to improve productivity in saline lands. ment and operation could theoretically be managed to ensure
that the deposition of salinity is largely restricted to the outer
margins of the wetted root-zone, thereby providing a zone of
SOIL SALINITY HETEROGENEITY lower inner salinity with abundant plant root activity. A better
understanding of soil processes and plant responses under het-
In naturally saline environments, within the rooting zone of a erogeneous conditions may therefore allow us to mitigate the
single plant, non-saline patches can coexist with nearby saline adverse effects of salinity (Lycoskoufis et al., 2005). Although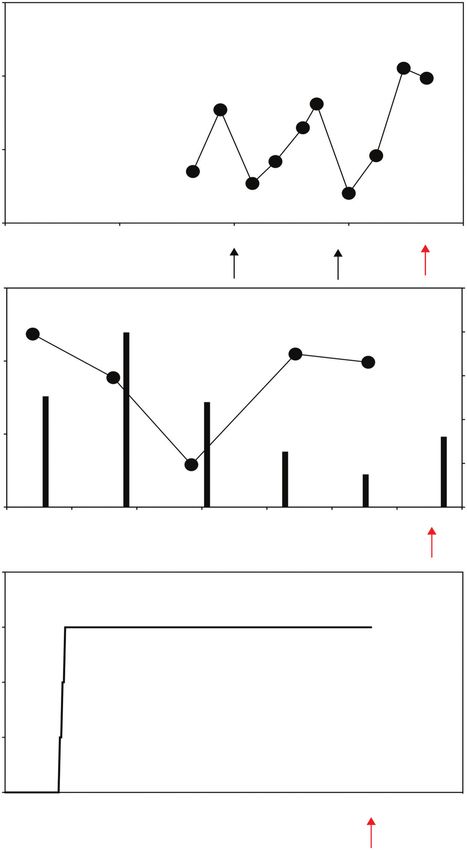
Valenzuela et al. — Plant responses to heterogeneous salinity                                      501

                                                          400
                                                                    A    Irrigated spring wheat

                            Salinity soil solution (mM)
                                                          300

                                                          200

                                                          100

                                                                                                                                                                                  Downloaded from https://academic.oup.com/aob/article/129/5/499/6529474 by guest on 11 June 2022
                                                                0                    25                   50                 75               100

                                                          600                                                                                    100
                                                                    B    Rainfed winter wheat
                            Salinity soil solution (mM)

                                                                                                                                                 80

                                                          400

                                                                                                                                                       Rain (mm)
                                                                                                                                                 60

                                                                                                                                                 40
                                                          200

                                                                                                                                                 20

                                                            0                                                                                     0
                                                                0            25           50         75         100       125        150       175

                                                          200
                                                                    C    Typical experimetanl setup in irrigated
                                                                         sand culture pots
                            Salinity soil solution (mM)

                                                          150

                                                          100

                                                           50

                                                            0
                                                                0            25           50         75         100       125        150       175
                                                                                                  Days after sowing

Fig. 1. Temporal variations in soil salinity measured in irrigated and rain-fed wheat in saline land compared with the typical experimental setup used to assess salt
tolerance. In (A) the crop was irrigated with water diverted from the Yellow River that had an average electrical conductivity of 0.75 ds m−1. Crops were planted in
a field with shallow saline groundwater. The electrical conductivity (EC) and depth of the groundwater varied from 0.5 to 3 ds m−1 and 80 to 200 cm, respectively.
Irrigation events are indicated with black arrows. Red arrows indicate the crop harvest (date of crop harvest is assumed based on the maturation days generally
required for spring wheat). Data modified from Xu et al. (2013). In (B) field trials to evaluate the salinity tolerance of wheat accessions under rain-fed conditions
were conducted on saline sites in Western Australia. Data modified from Setter et al. (2016). (C) Diagram showing a typical experimental protocol used to assess
salt tolerance in irrigated sand culture in pots, where the salinity of the soil solution is increased gradually to achieve the desired concentration, which then remains
constant throughout the experimental period (Hussain et al., 2021). After an initial trial in hydroponics to evaluate salt tolerance at the seedlings stage, the protocol
shown in (C) was used to screen the salt tolerance in different wheat germplasm grown in sand irrigated with a saline Hoagland solution. Depending on the irrigation
schedule (not indicated), the salinity of the soil solution is expected to have varied depending on the evapo-transpiration and the decline in water content in the pots.

very few field experiments have tested this theory that drip ir-                                               average root-zone salinity (Sonneveld and Voogt, 1990; Zekri
rigation can be optimized to minimize the impacts of salinity,                                                 and Parsons, 1990; Flores et al., 2002; Mulholland et al., 2002;
several studies of split-root plants showed greater plant growth                                               Tabatabaei et al., 2004; Attia et al., 2009; Kong et al., 2012;
under heterogeneous salinities than uniform salinity, at the same                                              Sun et al., 2016; Zhang et al., 2019). This suggests that
502 Valenzuela et al. — Plant responses to heterogeneous salinity
A B
Salinity
increases
with
depth
Sprinkling or surface flooding Salts
Water
Salt accumulates between checks
Salinity
increases
with
depth
Border check irrigation
Salt accumulates in the
Downloaded from https://academic.oup.com/aob/article/129/5/499/6529474 by guest on 11 June 2022
ridges between furrows
Salinity
C
increases
with
depth
Furrow irrigation
Salt accumulates between emitters Salts
at the outside fringes of the wetted area Emitter
Emitter
Water
Localized irrigation (drip or trickle)
Fig. 2. Irrigation induced heterogeneity in root-zone salinity. (A) Typical salt accumulation patterns in surface soils for various methods of water application.
Salinity ranges from low (unshaded) to high (darkened). Arrows indicate the direction of soil water flow. Reproduced with permission from Ayers and Westcot
(1985). (B, C) Examples of sloping bed irrigation style and their impact on localized salt deposition around sloped furrow irrigation. Reproduced with permission
from Zaman et al. (2018).
further developing these irrigation strategies should be fruitful. Split-root experiments indicate a more nuanced plant re-
Understanding the nature of plant responses to heterogeneous sponse to saline environments than commonly recognized. As
salinity is therefore essential to develop and implement im- summarized in Bazihizina et al. (2012a), key features of plants
proved irrigation practices for saline systems. In particular, exposed to heterogeneous salinities are: (1) shoot water poten-
this opens an excellent opportunity to improve production by tials are determined by the salinity level of the low-salinity zone,
manipulating the heterogeneity in the salinity of the soil solu- (2) water uptake occurs predominantly from the low-salinity
tion, thereby harnessing the abilities of plants to make optimum medium and (3) greater maintenance of shoot growth even when
use of less-saline patches within root-zones. a large proportion of the root system is exposed to high NaCl
concentrations that would greatly inhibit growth if applied uni-
formly to the roots. Transcriptome profiling of plants exposed
ROOT RESPONSES TO HETEROGENEOUS SOILS for 6–9 h to heterogeneous salinities indicated that improved
performance under heterogeneous conditions compared to uni-
Under naturally occurring and agriculturally induced salinity, form salinities is related to the rapid activation of salt resistance
plant growth is affected by the salinity of the soil solution or the genes and crosstalk between the non-saline and high-saline
ratio of salt (of which the ECe or EC1:5 are measures) and the water root sides (Kong et al., 2016; Xiong et al., 2018; Zhang et al.,
content of the soil. Soil salinities vary on spatial scales of micro- 2019). This suggests that roots operate as the central hub that
metres to metres, and on temporal scales ranging from seconds to control: (1) how stress is perceived, (2) long-distance commu-
seasonal changes (Bazihizina et al., 2012a; Rellán-Álvarez et al., nication with the shoots and (3) the integration of long-distance
2016; Dinneny, 2019). Thus, roots of a single plant will be ex- systemic signals with local root-based ones. Furthermore, sal-
posed to a range of soil water salinity levels that vary temporally inity heterogeneity is inevitably linked to temporal and spatial
and spatially, with differential effects depending upon the stage variation in the distribution and biological availability of water,
of plant growth. Nevertheless, while heterogeneous salinities essential nutrients and soil pH (Li et al. 2011; Feng et al., 2018;
typically occur in salt-affected soils, experiments have almost ex- Zhang et al., 2019), with the latter having a major impact on
clusively imposed homogeneous salinity or highly manipulated root membrane potential, thus affecting both a plant’s ability to
experimental conditions such as split-root systems, which expose acquire essential nutrients and exclude toxic Na+ and Cl− ions
a portion of a root system to salinity while the remainder receives (Babourina et al., 2001; Zhang et al., 2018). Thus, responses at
non-saline conditions. Although split-root experiments may not the root level also play a critical role in: (4) how plants com-
adequately mimic a complex field condition, these have provided pensate for water/nutrient deprivation and limit salt stress by
valuable insights by demonstrating how plant responses to het- optimizing root-foraging in the most favourable part of the soil.
erogeneous conditions differ markedly from those of homoge- Understanding how roots respond to heterogeneous salinities
neous saline conditions. is therefore of utmost importance and is needed to developValenzuela et al. — Plant responses to heterogeneous salinity 503
Greater than 10 dS/m
Greater than 10 dS/m
Drip tape 20 in. Drip tape 20 in.
5 to 10 dS/m (0.5 m) (0.5 m)
3 to 5 dS/m 5 to 10 dS/m
Less than 1.5 dS/m
2 to 3 dS/m 3 to 5 dS/m 2.5 to 2.5 dS/m
1.5 to 2 dS/m 2.5 to 3.0 dS/m
38 inches (0.96 m) 38 inches (0.96 m)
Salt pattern, August 1992 Salt pattern, October 1992
3.0 to 3.3 dS/m
Downloaded from https://academic.oup.com/aob/article/129/5/499/6529474 by guest on 11 June 2022
3 to 4 dS/m Less than Greater than 10 dS/m
2 dS/m
Drip 20 in. 20 in.
(0.5 m) Drip
tape (0.5 m)
tape
5 to 10 dS/m
2.5 to 3.0 dS/m
2.0 to 2.5 dS/m 3 to 5 dS/m 1.4 to
1.5 dS/m
3.0 to 3.5 dS/m 2.0 to 3.0 dS/m
2.5 to 3.0 dS/m 1.5 to 2.0 dS/m
38 inches (0.96 m) 38 inches (0.96 m)
Soil salinity after 356 mm of rainfall Salt pattern, September 1993
Fig. 3. Depiction of salt accumulation patterns from subsurface irrigation in a lettuce crop in the Santa Maria Valley (California, USA). While a low EC zone is
formed beneath the emitter, salts can accumulate above and require rain or other surface irrigation to percolate salts beneath the emitter for leaching. Soil types
were a clay loam and a fine sand. Reproduced with permission from Hanson and Bendixen (1995).
efficiently resources are captured. These are fundamentally
Box 1. Irrigation system terminology controlled at variable spatial scales, from the single cell to the
entire organ.
Term explanation
All formats of irrigation which rely on gravity
(rather than pressurized conveyance systems) to
distribute water across a field. Examples include Salinity sensing
flood and furrow irrigation. It is important to note
that while these systems are collectively referred to Local patches of high salinity are sensed in individual cells,
Surface Irrigation and then integrated into organ-scale processes. After sal-
as surface irrigation, they are not the only irrigation
systems which apply water to the soil surface; inity increases, plants experience multiple constraints ranging
overhead sprinkler, micro-sprinkler and surface drip from reduced water availability, disturbance to cytosolic ion
also irrigate the soil surface but are not generally
categorized as traditional ‘surface irrigation’.
homeostasis, and dramatic increases in reactive oxygen spe-
Drip cies (ROS) accumulation. The emerging picture suggests that
Highly local, small volumes of water emanating more than one sensory mechanism may operate in the same cell
from points along a pressurized plastic pipe at the same time, with some common downstream signalling
(‘drip line’) which is installed either on the soil pathway(s) (Shabala et al., 2015; Feng et al., 2018; Niu et al.,
surface (surface drip) or buried beneath the crop
(‘subsurface drip’/‘subirrigation”) with very little 2018; Fichman and Mittler, 2020, 2021; Peck and Mittler,
loss to evaporation. 2020).
Micro-irrigation
Micro-sprinkler Calcium and ROS signals are amongst the first signals
Any small, stationary sprinklers which are commonly evoked upon biotic and abiotic stressors. Ca2+ and
installed near the soil’s surface and irrigate the
soil’s surface without applying water to the
ROS signals are established second messengers involved in
canopy. Micro-sprinkler irrigation is more targeted most (local) stress responses, and increasing evidence sug-
than overhead sprinkler irrigation, particularly gests that these act in tandem, interacting and amplifying each
with orchard crops which are widely spaced and other during root salt sensing (Dodd et al., 2010; Choi et al.,
have high canopies which can lose large fractions 2014; Shabala et al., 2015; Evans et al., 2016; Niu et al., 2018;
of overhead irrigated water to evaporation.
Pottosin and Zepeda-Jazo, 2018). Several molecular compo-
nents underlying Ca2+ and ROS signalling (including MOCA1,
OSCA1 and RBOHs) have been identified and are currently
management strategies to optimize resource use and crop prod- being considered as potential salt sensors (Yuan et al., 2014;
uctivity in saline soils. Different processes enable roots to inte- Jiang et al., 2019; Liu et al., 2020b). Interestingly, local salt
grate fluctuating soil conditions into appropriate developmental stress at the root apex triggers immediate cytosolic Ca2+ in-
and physiological responses that ultimately determine how creases at the point of application, leading to propagation of504 Valenzuela et al. — Plant responses to heterogeneous salinity
a TPC1- (‘two-pore channel 1’) dependent Ca2+ wave to distal the non-saline areas was associated with increased lateral root
shoot tissues, passing through cortical and endodermal cell growth, which doubled compared to plants with both root halves
layers (Choi et al., 2014). By combining experimental analyses in non-saline conditions (Feng et al., 2017). However, root pro-
and mathematical modelling, Evans et al. (2016) also clearly liferation in the non-saline compartment does not always occur,
linked the [Ca2+]cyt wave triggered by a localized salt applica- with several studies showing no differences, or even a decline,
tion with systemic ROS waves. Additional salt sensors (exten- in root growth compared to measurements under uniform non-
sively reviewed in Shabala et al., 2015, 2016; Byrt et al., 2018; saline conditions (see references in Table 1). This highlights the
Rui and Dinneny, 2020; Gigli-Bisceglia et al., 2020) include: complexity of interpreting how heterogeneous conditions alter
(1) cell walls, and in particular the salt-induced alterations root growth, because responses depend on timescale, salt con-
in cell wall integrity and composition that are sensed by the centration and species sensitivity to salinity.
receptor-like kinase, FERONIA (FER) (Feng et al., 2018); (2) To understand root foraging it will be necessary to deter-
mechanosensory channels and transporters (e.g. OSCA1, MSLs, mine whether heterogeneous salinities (and the associated vari-
MCAs) that sense the mechanical force exerted on the plasma ability in water availability and nutrient distribution) affect root
Downloaded from https://academic.oup.com/aob/article/129/5/499/6529474 by guest on 11 June 2022
membrane due to the osmotic component of salinity and trans- anatomical features, in addition to any effects on root morph-
late hydraulic cues into chemical signals (Yuan et al., 2014; ology. The section below considers suberin deposition in root
Yoshimura et al., 2021); and (3) Na+ transport systems and cell walls. Even when heterogeneous salinities do not alter root
proteins with regulatory Na+ binding sites (e.g. MOCA1; Jiang architecture, it remains possible that traits that reduce the meta-
et al., 2019). bolic cost of soil exploration, such as cortical cell enlargement
While it is becoming increasingly clear that plant cells sense and cortical senescence, could be beneficial. This has yet to be
and respond to salinity stress by activating multiple sensing tested. Nevertheless, the anatomical traits that reduce the meta-
networks, much of our knowledge on root salt sensing and bolic cost of root soil exploration are currently considered an
signalling has utilized uniform conditions, with no such studies advantage in water-, nitrogen- and O2-limited soils as these im-
attempted for heterogeneous salinities. Such experiments will prove water and nutrient uptake per unit investment in roots
generate valuable information on how salt sensing at the single (Lynch, 2018, 2019; Schneider and Lynch, 2020; Colombi
cell level is integrated into organ-scale processes, revealing et al., 2022). This topic therefore merits greater research efforts
how the signal propagates and its effects on root system archi- to identify key root traits that maximize soil resource capture
tecture, developmental trade-offs and root plasticity. under heterogeneous salinity.
Root foraging Water uptake
Scaling up to the whole root level, the root system is a highly Irrespective of environmental heterogeneity within the root-
dynamic physical network that enables a plant to forage for re- zone, plant water uptake is essential to maintain photosyn-
sources and rapidly explore favourable soil patches. Under spa- thesis. Typically, water uptake from the non-saline side of the
tially heterogeneous soil salinities, preferential root growth can root system increases significantly, which is not always accom-
occur in the least (or non-) saline compartment, compensating panied by increased root biomass (Fig. 4A). Roots can dynam-
to different degrees for root growth inhibition in the saline ically alter their water transport capacity to acclimate to the
patches (Bazihizina et al., 2009, 2012b; Feng et al., 2017; Sun ever-changing soil conditions and rapidly explore favourable
et al., 2016; Xiong et al., 2018; Table 1, Fig. 4). A split-root ex- soil patches. Under heterogeneous salinity, preferential water
periment that closely examined root morphology under hetero- uptake from the regions with the least negative water potentials
geneous salinities revealed that compensatory root growth in are mediated by changes in root hydraulic conductivity that
Table 1. Root distribution in different species under horizontally heterogeneous salinities as percentage of dry mass in control plants
with low or no-salt media
Species Salinity (mm NaCl) Duration Root biomass (% control) Ratio L : H Reference
L H
Atriplex nummularia 10/500 3 weeks 88 87 1.0 Bazihizina et al. (2012b)
Atriplex nummularia 10/1500 3 weeks 153 32 4.8 Bazihizina et al. (2012b)
Hibiscus moscheutos 0/200 2 months 72 57 1.3 Feng et al. (2021)
Hibiscus moscheutos 0/200 2 months 79 20 4.0 Feng et al. (2021)
Medicago sativa 0/200 15 d 140 56 2.5 Xiong et al. (2018)
Medicago sativa 50/200 15 d 131 61 2.1 Xiong et al. (2018)
Medicago sativa 0/75 9d 99 90 1.1 Sun et al. (2016)
Medicago sativa 0/150 9d 113 82 1.4 Sun et al. (2016)
Medicago sativa 0/225 9d 118 56 2.1 Sun et al. (2016)
Medicago sativa 75/150 9d 82 60 1.4 Sun et al. (2016)
Medicago sativa 75/250 9d 72 55 1.3 Sun et al. (2016)
Sorghum bicolor 0/200 2 weeks 100 49 2.0 Zhang et al. (2019)Valenzuela et al. — Plant responses to heterogeneous salinity 505
A Spatial heterogeneity B Temporal heterogeneity
Almond rootstock Atriplex nummularia Soil water potential, MPa No. of new roots
“Nemaguard” seedlings –12 –9 –6 –3 0 1 2 3 4 5
25 1.5
a a
0.1
a
20 a
a,c 0.2
Root DM (g)
Root DM (g)
1.0
a
15 b,c
0.3
a,b a,b
*
b
10 b 0.4
b 0.5
Downloaded from https://academic.oup.com/aob/article/129/5/499/6529474 by guest on 11 June 2022
Soil depth (m)
5 0.5
GW* End of summer 0.6
0 a 0.0
a
*
0.1
20 1.5
Water uptake (mL g–1 h–1)
a
Water uptake (mL h–1)
0.2
a
15
a 1.0 0.3
b a
10
b b 0.4
b
b b 0.5
5 0.5
GW* End of winter 0.6
0 0.0
0/0 0/60 60/60 10/10 10/670 670/670
Low/no salt side
High salt side
Fig. 4. Taking advantage of the patch. Plants use the most accessible water source under spatially and temporally variable salinity. The datasets in (A) show water
uptake and root growth in the non-halophytic almond rootstock ‘Nemaguard’ (Prunus persica × P. davidiana) and the halophyte Atriplex nummularia, after 28
and 21 d of heterogeneous salinity treatment respectively. The data shown for almond rootstock and Atriplex nummularia are modified from Valenzuela (2018) and
Bazihizina et al. (2009), respectively. Values are mean (n = 4) ± SE and different letters indicate a significant difference (P < 0.05) between treatments and root
sides. The dataset in (B) shows temporal changes in soil water potentials and number of new roots in Melaleuca halmaturorum in response to fluctuating saline
groundwater. The data shown in the upper two panels refer to soil water potentials and new roots observed at the end of summer, while those shown in the bottom
two panels refer to soil water potentials and new roots at the end of winter. The red asterisks indicate the location of main water uptake (based on the uptake of
stable isotope data). The figure is modified from Mensforth and Walker (1996).
occur within hours of salt exposure (Kong et al., 2016). These were largely inhibited in the high-salinity side (Kong et al.,
are achieved through changes in the abundance or activity of 2017).
water channel proteins named aquaporins that facilitate water The deposition of hydrophobic lignin and suberin in the cell
diffusion across cell membranes (Maurel et al., 2008; Gambetta walls of the exo- and endodermis also alters root hydraulic con-
et al., 2017; Kong et al., 2017; Maurel and Nacry, 2020). The ductivity and restricts the free diffusion of solutes and water,
activity of aquaporins is regulated at many levels, including including restricting entry of Na+ and Cl− from the soil into the
altered transcription levels, channel gating between an open/ vascular stream with high root-zone salinity (Krishnamurthy
closed state by various mechanisms including phosphoryl- et al., 2011; Barberon et al., 2016; Wang et al., 2019; Cui et al.,
ation, pH or Ca2+, and changed cellular trafficking (Maurel 2021). Accordingly, dynamic regulation of root hydraulic con-
et al., 2008; Gambetta et al., 2017; Maurel and Nacry, 2020). ductivity under heterogeneous salinities was also associated
Under heterogeneous conditions, increased water uptake from with altered expression of genes associated with cutin, suberin
the non-saline roots has largely been attributed to changes in and wax biosynthesis in the salinized root portions (Xiong
aquaporin expression levels (Kong et al., 2017). After applying et al., 2020). This could potentially explain decreased endo-
200 mm NaCl to one root half in split-root cotton seedlings dermal and exodermal permeabilities, which limit water and
(with 0 mm NaCl to the other half), gene expression profiling solute transport from the highly saline areas.
revealed several aquaporin genes were up-regulated within 3 h The ability of plants to acquire and transport water from the
in the non-salinized root half, resulting in 16 % higher root hy- roots to the leaves also depends on root anatomy and archi-
draulic conductivity when measured against NaCl-free controls tecture, and the combined hydraulic conductivities among root
(Kong et al., 2017). By contrast, both root hydraulic conduct- types and along the root length (Meunier et al., 2017; Ahmed
ivity and most of the differentially expressed aquaporin genes et al., 2018). Thus, over the longer term (days), increases in new506 Valenzuela et al. — Plant responses to heterogeneous salinity
root growth and altered root architecture (i.e. root proliferation is generally determined by the non-salinized part of the root-
and increased lateral root formation) and anatomy may have a zone under heterogeneous salinities (Bazihizina et al., 2009,
more significant effect than localized changes in root hydraulic 2012a, b; Feng et al., 2021). Considerable stomatal closure
conductivity at the single root level. Nevertheless, our under- of these plants (Fig. 5) suggests non-hydraulic mechanisms
standing of the timescale and concentration-dependent drivers of stomatal closure. Homogeneous salinity induced multiple
of the long- and short-term responses of roots to localized sal- phytohormonal changes in salinized roots, according to the
inity is inadequate. As highlighted in the following sections and duration of exposure, with phytohormones such as abscisic
above, responses are expected to become increasingly complex acid (ABA), auxin and cytokinins (Albacete et al., 2008), and
when heterogeneous salinity interacts with other environmental their crosstalk, mediating the balance between growth and sal-
factors, such as heterogeneous nutrients as discussed below, inity stress responses (Yu et al., 2020). The same applies to
and their impacts on plant nutrient and water acquisition. heterogeneous salinities. In cotton grown with heterogeneous
salinity (0/200 mm NaCl), 200 mm NaCl induced only tran-
sient (within 3–12 h of treatment) increases in root ABA con-
Downloaded from https://academic.oup.com/aob/article/129/5/499/6529474 by guest on 11 June 2022
centration. Root ABA levels were similar to controls after 24 h,
Phytohormone root–shoot communication
presumably as sustained up-regulation of ABA catabolism
Heterogeneous salinity can induce variable degrees of sto- (CYP707A) genes influenced root ABA concentrations more
matal closure, with stomatal conductance similar to uniform than concurrent up-regulation of ABA biosynthesis (NCED)
salinity in some studies (Lycoskoufis et al., 2005; Fig. 5). genes (Kong et al., 2016). Paradoxically, root ABA concen-
However, most split-root studies indicate greater plant water trations of the non-salinized roots exceeded those of salinized
use under heterogeneous than uniform salinity, at the same roots throughout the experiment, despite a limited and transient
average root-zone salinity. This is mostly because plant water (3–6 h) up-regulation of (NCED) genes, implying considerable
uptake from the non-salinized part of the root system substan- ABA transport into these non-salinized roots. Further studies
tially increases, even exceeding water uptake from roots of non- are needed to elucidate the source of this additional ABA, since
salinized plants (see section above). Long-distance signalling the shoot can regulate root ABA concentration (Manzi et al.,
in planta is implicated in regulating these plant water rela- 2015; McAdam et al., 2016), which in turn upregulates root
tionships under heterogeneous salinity by modulating root hy- hydraulic conductance (Thompson et al., 2007).
draulic conductivity and stomatal conductance. Heterogeneous salinity also altered the concentrations of
Although leaf water status is regarded as an important other phytohormones in the non-salinized portion of split-root
regulator of stomatal responses (Christmann et al., 2007), it cotton plants: with indole acetic acid, isopentenyladenine and
1.2
Uniform salinity
Heterogeneous salinity
Stomatal conductance
% uniform control
0.8
0.4
0
os r se ia
um ut lo um ar
ic e co en ut ul
er
s
ch bi hi
n irs m
c h
co
p os um m m nu
m
Iy m h u u
s rg ci pi le
x
um is
cu So Ly sy rip
la
n ib os At
G
So H
Fig. 5. Stomatal conductance of salinized plants (expressed as a percentage of non-salinized controls) exposed to heterogeneous (hollow symbols) and homoge-
neous (filled symbols) salinity at the same average root-zone salinity. Original papers were from: Solanum lycopersicum (Wang et al., 2021), with plants grown
with uniform (0 and 50 mm NaCl) and heterogeneous salinity (17/85 mm NaCl); Hibiscus moscheutos (Feng et al., 2021), with plants grown with uniform (0 and
200 mm NaCl) and heterogeneous salinity (0/400 mm NaCl); Sorghum bicolor (Zhang et al., 2019), with plants grown with uniform (0 and 100 mm NaCl) and
heterogeneous salinity (0/200 mm NaCl); Lycium chinense (Feng et al., 2017), with plants grown with uniform (0 and 170 mm NaCl) and heterogeneous salinity
(0/340 mm NaCl); Gossypium hirsutum (Kong et al. 2012), with plants grown with uniform (0 and 100 mm NaCl) and heterogeneous salinity (0/200 mm NaCl);
and Atriplex nummularia (Bazihizina et al., 2009), with plants grown with uniform (10 and 230 mm NaCl) and heterogeneous salinity (10/450 mm NaCl).Valenzuela et al. — Plant responses to heterogeneous salinity 507
zeatin riboside concentrations increasing compared to their and nutrient distribution. The following discussion first con-
concentrations in plants that were not exposed to salinity (Kong siders experiments with only nutrient heterogeneity, before dis-
et al., 2016). In this case, increased root cytokinin concentra- cussing the integration of nutrients with salinity heterogeneity.
tions correlated with increased expression of IPT genes, which In tomato, preferential nitrate (NO3−) uptake was found to
were maximal 3 h after salinizing the other part of the root occur from areas of the root-zone with higher (1.6- to 3.3-fold
system. Measuring root water potential in a transpiring plant greater, with 10 ds m−1 being the highest EC) electrical con-
(Adeoye and Rawlins, 1981) may help determine whether this ductivity (or more negative osmotic potential) generated by lo-
was a transient response to altered root water relationships cally high nutrient concentrations (Sonneveld and Voogt, 1990),
in the non-salinized roots. Such measurements (along with suggesting a local response of roots exposed to high concen-
root gene expression) are required in girdled and non-girdled trations probably due to their enhanced NO3− uptake kinetics.
plants (since girdling at the root–shoot junction blocks phloem Mathematical simulations of nutrient uptake under hetero-
transport to the roots) to determine whether local root water geneous conditions of NO3− and phosphate (PO43−) using the
relationships and/or a cumulative message from other parts of Barber–Cushman model found a greater impact of soil hetero-
Downloaded from https://academic.oup.com/aob/article/129/5/499/6529474 by guest on 11 June 2022
the plant regulate gene expression. Under heterogeneous sal- geneity and root plasticity, with NO3− uptake increasing 7–20
inity, Na+ accumulation in the non-salinized portion of the root times under heterogeneous conditions (Jackson and Caldwell,
system doubled compared to roots from non-salinized controls. 1996). Root proliferation and increased uptake kinetics from the
Such Na+ accumulation depended on phloem transport from enriched root-zones accounted for up to 75 % of NO3− supply
the salinized roots, as girdling prevented Na+ transport to these of a plant and over 50 % of PO43− acquired from enriched soil
roots (Kong et al., 2012). Whether girdling eliminates changes patches. Simulations demonstrated that plants lacking plasticity
in root phytohormone concentration in non-salinized roots, of root growth or uptake always acquired less nutrients under
when the other part of the root system is exposed to salinity, heterogeneous NO3− and PO43− distributions.
needs to be addressed. In a split-root solution culture experiment on Lolium
Irrespective of whether changes in root phytohormone con- multiflorum, less than 24 h after depriving NO3− from half the
centration occur, it is uncertain whether they actually affect shoot root volume, net NO3− influx to roots in the nitrate-rich area
phytohormone concentrations and physiological responses, increased, with root growth increments observed only after
since root-to-shoot signalling under heterogeneous soil condi- 1 week (Lainé et al., 1998). Brassica napus responded simi-
tions depends on relative sap flow from different parts of the larly (Lainé et al., 1995). This rapid variation in NO3− uptake
root system (Dodd et al., 2008). Under heterogeneous salinity, was strongly associated with altered root hydraulic conductiv-
changes in root phytohormone concentration in the salinized ities, with a sudden increase in NO3− concentration around the
root system may have little impact on shoot physiology since roots almost simultaneously increasing root hydraulic conduct-
these roots contribute relatively little to total transpirational flow ivity and preferential water uptake from the nitrate-rich patch
(Kong et al., 2012). Interestingly, changes in root phytohormone (Gorska et al., 2008). Split-root experiments applying NO3− to
concentration in the non-salinized roots may have a greater in- a portion of the root system demonstrated a localized and re-
fluence on shoot physiology, since these roots contribute most of versible response, with N starvation on one side of the root
the total water flux. Grafting techniques allow the relative contri- system leading to compensatory and enhanced NO3− uptake in
bution of different parts of the root system to root phytohormone the other root portion (Tabata et al., 2014).
export to be evaluated (Dodd et al., 2008), but to date this has Heterogeneous NO3− distribution to split-root Acer rubrum and
only been attempted in plants exposed to different soil moisture Betula papyrifera plants demonstrated a species-dependent re-
levels and such experiments should be applied to plants with sponse, with two-fold more fine roots measured for B. papyrifera
heterogeneous root-zone salinity. in the high NO3− portion than A. rubrum, yet similar total NO3−
uptake rate (Gloser et al., 2008). Under heterogeneous condi-
tions, A. rubrum had smaller leaves and N deficiency symptoms
HETEROGENEOUS SALINITY AND NUTRIENT in the shoot portion directly above the nutrient-deficient root por-
tion, while B. papyrifera had regular leaves with no visible defi-
DISTRIBUTION: THE MISSING LINK?
ciency symptoms. Vascular system architecture may explain this
In both natural and managed systems, a variable distribution of differential response (Orians and Jones, 2001). In species with
nutrients (and salinity) in soils is inevitable. This is associated sectored vascular systems (e.g. A. rubrum), in which contiguous
with differential ion mobility and solubility, localized decom- and largely exclusive vascular traces occur from a specific root to
position of organic matter, or applying soluble nutrients through a specific branch, N deficiencies occurring in isolated parts of the
a fertigation system. Furthermore, considerable evidence sug- canopy reflect the nutritional status of the specific root that feeds
gests that nutrient ‘patches’ can influence root foraging, lateral that branch. In contrast, other species (B. papyrifera) have an in-
root formation and root hair formation. Thus, the mutual effects tegrated vascular system allowing nutrient transfer from an indi-
of salinity and nutrient heterogeneity are relevant. vidual root to the canopy as a whole, avoiding the consequences
of patchy nutritional deficiencies.
Root physiological responses to nutrient heterogeneity in
fertigated crops Root morphological responses to nutrient heterogeneity
Though probably a common occurrence in drip irrigated In Betula pendula, dry matter allocation to roots can be
crops, very few studies have simultaneously varied both salinity modified in three different ways when the availability of508 Valenzuela et al. — Plant responses to heterogeneous salinity
mineral nutrients is limited: (1) increased root growth in N-, not the patchiness per se. The differential response of roots to
P- or S-limited soils; (2) decreased root growth when K+, Mg2+ nutritional patchiness is probably a consequence of complex
and Mn2+ is limited; and (3) no effect on root growth when nutrient-specific signal transduction pathways (López-Bucio
Ca2+, Fe2+ and Zn+ are limited (Ericsson, 1995). Root growth et al., 2003).
plasticity in patchy soil enhances the ability of plants to fill
the soil volume rich in nutrients and was the most important
trait influencing species success (Hodge, 2006; Rajaniemi,
Impacts of simultaneous salinity and nutrient heterogeneity
2007). The ability of a plant to ‘find’ the nutrient-rich patch
is essential if morphological/physiological root responses are To investigate the effects of heterogeneous root salinity and
to be expressed. For instance, while nutrient (N) heterogen- nutrient conditions, several split-root tomato experiments were
eity in Lolium perenne did not lead to preferential root growth conducted (Fig. 6; Valenzuela et al., 2021). Water uptake from
in the nutrient-rich soil patches (suggesting the patch was not the saline root-zone dramatically decreased within 8 h of treat-
explored to any greater extent than the bulk soil), there were ment (Fig. 6A, B) in contrast to the non-saline root-zone, with
Downloaded from https://academic.oup.com/aob/article/129/5/499/6529474 by guest on 11 June 2022
overall increases in specific root length (length/biomass) and a more pronounced effect when nutrients were provided only to
root elongation throughout the entire soil profile compared to the non-salinized root-zone (Fig. 6A, B). This reduction in water
the uniform N treatment (Nakamura et al., 2008). This suggests uptake did not correlate with decreased root growth (which was
that the overall plant N deficiency induced root elongation and maintained during Days 1–3), with the saline root-zone only
Treatments of reference
( ) Side A: Nutrient Nutrient/NaCI
A
( ) Side B: NaCI
100
75
50 T-test, p = 6.8e-08
25 ****
0
( ) Side A: Nutrient Nutrient/Nutrient + NaCI
B
( ) Side B: Nutrient + NaCI
Percentage of water uptake per treated root (%)
100
75
50 T-test, p = 0.0015
25 **
0
Nutrient depleted versus
saline root sub-zones
( ) Side A: K-depleted Nutrient-K/Nutrient + NaCI
C ( ) Side B: Nutrient + NaCI
100
75
50
25 T-test, p = 0.00091
0 ***
( ) Side A: N-depleted
D Nutrient-N/Nutrient + NaCI
( ) Side B: Nutrient + NaCI
100
75
T-test, p = 1.6e-05
50
****
25
0
–3 0 3 6 9
Time (day) 0 0.25 0.50 0.75 1.00
Root allocation
Fig. 6. Daily measurement of the percentage of water consumption per root side in a split-root system under hydroponics. The vertical dashed line shows the
time when salinity application was initiated. Dots represent treatments applied to side A and triangles to side B. The saline agent was NaCl with a concentration
of 50 mm. Bar graphs, at the right, show the root biomass allocation for each treatment. In these experiments, tomato (Lycopersicon esculentum) seedlings were
grown in a hydroponic split-root method for 9 d under heterogeneous saline and nutritional conditions applied separately and in combination. Root activity was
monitored by directly measuring root uptake of water and nutrients, biomass allocation and total nutrient uptake. The short experimental time frame and modest
salinity concentrations were selected to minimize ionic toxicity and plant growth effects. Reproduced with permission from Valenzuela et al. (2021).Valenzuela et al. — Plant responses to heterogeneous salinity 509
showing significantly less root growth towards the end of the (e.g. halophytes vs. non-halophytes)? (3) How do the local con-
experiment (Day 9). The rapidity and consistency of decreased ditions (salinity vs. nutrient vs. water availability) and whole
water uptake by roots in the saline zone, from treatment impos- plant status (e.g. shoot Na+, Cl− and/or nutrient concentrations)
ition through to Day 9, suggests that a primary physiological modulate the response? Interestingly nutrient availability alters
response (possibly due to reduced aquaporin activity) was fol- the endodermal specific ABA signalling in roots that modulates
lowed by a morphological response. lateral root formation and root system architecture in response
To further explore the role of heterogeneous nutrient provi- to salinity stress (Duan et al., 2013). As demonstrated above,
sion on root activity, complete nutrient solutions were select- this suggests that the ‘nutrient signal’ might eventually over-
ively depleted of either N or K+ in the non-saline root half while ride, or at least affect, the ‘salinity signal’ in regulating root
the other root half received a saline, complete nutrient solution growth and functions under heterogeneous conditions.
(Fig. 6C, D). These treatments provoked a ‘two-phase-response’.
Immediately upon treatment application, the saline conditions
given to one side of the roots dominated, immediately decreasing IMPLICATIONS FOR CROP MANAGEMENT
Downloaded from https://academic.oup.com/aob/article/129/5/499/6529474 by guest on 11 June 2022
water uptake of those roots. Subsequently, water uptake from the
saline-treated, nutrient-supplied roots proportionally increased, When considering crop responses to salinity, two parameters
probably in response to the nutrient deficiency induced by the define salt tolerance: (1) the threshold salinity that causes the
omission of the nutrient on the non-saline side. This effect was initial significant reduction in the maximum expected yield,
marked when K+ was only present in the saline root half and and (2) the rate of yield decline as salinity increases beyond
slight in the case of N. The presence of K+ in the nutrient solution the threshold (i.e. slope; Maas and Hoffman, 1977; Maas and
was the most important determinant of root activity even when Grattan, 1999). However, the important underlying assump-
coinciding with salinity, resulting in a notably higher shoot tissue tion of the threshold model by Maas and Hoffman (1977) is
Na+ and Cl− concentration when the sole source of K+ was to the that steady-state conditions exist in the root-zone, with water
saline root volume (Valenzuela et al., 2021). content and salt concentration remaining constant in time and
This experiment and others described herein suggests that space. Since these conditions rarely exist in crop root-zones in
interpreting root responses to heterogeneous conditions de- the field (e.g. Fig. 1), conclusions from steady-state analyses
pends markedly on context, time, salinity concentrations and can be questionable (Letey and Feng, 2007). This has critical
plant nutrient status: repercussions when defining the salinity experienced by the
roots when identifying breeding targets and soil management
• Immediate (within hours) reductions in water uptake in salt-
practices.
exposed root-zones commonly occur and are expected to
be determined by the relative difference in salinity between
root parts. Subsequently, relative nutrient availability affects
root activity, with responses to K+ depletion perceived within Re-defining soil salinity
days. In the longer term, ionic stress and changes in relative
One valuable tool in categorizing and quantifying genetic
root growth may further alter relative root activity in each
variation in salt tolerance has been to define crop relative yield
root-zone.
responses in terms of threshold salinities up to which yields are
• Plant responses to the relative distribution of nutrients in the
unaffected and linear decreases in relative yield with increasing
root-zone probably also depend on plant nutrient status and
salinity thereafter (cf. Maas and Hoffman, 1977, and their suc-
the absolute concentrations of nutrients and salinity present in
cessors). However, it is critical to recognize that these relation-
each root-zone. Thus, a K+-replete plant, provided low levels
ships have generally always been presented in terms of variation
of K+ in the non-saline root-zone, or the presence of extreme
in parameters such as ECe (the electrical conductivity of the soil
salinity (>100 mm), would probably diminish the dramatic
saturation extract) or more occasionally in terms of variation in
response seen here (Fig. 6).
EC1:5 (the electrical conductivity of a 1 : 5 soil : water slurry)
• All split-root systems or otherwise manipulated heteroge-
that relate to the salinity of the soil. However, it is not the sal-
neous root-zone experiments do not reflect the complexity
inity of the soil (a parameter that does not account for variations
of natural ecosystems, where soil heterogeneity is probably
in soil water content) that affects plant growth but the salinity
significantly more complex in space and time. However, cer-
of the soil solution, and thus the ratio of salt to water in the soil.
tain agricultural conditions may closely resemble split-root
This means that the salinity stress on a plant can be doubled by
studies, such as in substrate hydroponic systems, raised bed
doubling the salt concentration in a soil or by halving the water
vegetable production and micro-irrigated arid zone crops.
concentration of the soil. Furthermore, as soils become drier,
While these simple split-root experimental approaches plant growth becomes affected by the increasingly negative ma-
cannot explain all potential nutrient interactions, they do illus- trix potentials (Ψ m values) that develop in soils because of the
trate the rapidity and plasticity of plant responses and the im- adhesion of water by soil pores.
portance of considering nutrients when studying heterogeneous This view profoundly affects the whole idea of the hetero-
salinity. Furthermore, this raises several important questions on geneity of salinity stress in soils, because heterogeneity arises
the signalling pathways underlying root system architecture and because of variable: (1) leaching effects of irrigation or rain-
functions under heterogeneous saline conditions: (1) What is fall on salt concentrations in soil, (2) hydrating effects of irri-
the relative importance of the signal(s) under heterogeneous sa- gation or rainfall on soil water contents, (3) effects of surface
line conditions (salt ions vs. nutrients vs. water vs. hormones)? soil evaporation increasing salt concentrations by capillarity and
(2) How does variation in salt tolerance affect this response decreasing water contents in the soil, and/or (4) water extraction510 Valenzuela et al. — Plant responses to heterogeneous salinity
rates of roots and the ion uptake/exclusion capacity, which over applying irrigation water in excess of crop evapo-transpirational
time also influence ion and water abundances near the roots. demands. The fraction of applied water that drains below the
One variable that captures variation in both salt and water root-zone is referred to as the ‘leaching fraction’ and this value
concentrations in soil is solute potential (Ψ s; units MPa). For is used to coarsely gauge the extent of leaching (Hanson et al.,
soils salinized with NaCl, this can be calculated as: 2009). Larger leaching fractions generally result in larger zones
with a low soil water salinity but may necessitate disposal of
Ψs = −22.75 × EC1:5 /W
(1) large volumes of saline drainage water and may cause add-
where the EC1:5 of the bulk soil is in units of ds m−1, and soil itional salinization through capillary rise of saline water by
water content of the bulk soil (W) has units of % dry mass. raising the water table (Grismer et al., 1988; Corwin, 2021), as
Water potential of the soil (Ψ soil) can be calculated (Slatyer, well as environmental impacts of drainage water disposal.
1967) as: Designing the appropriate leaching fractions needed to avoid
yield loss is context-specific and will depend on the crop, soil
(2) Ψsoil = Ψm + Ψs texture, climate, irrigation system and irrigation schedule, and
Downloaded from https://academic.oup.com/aob/article/129/5/499/6529474 by guest on 11 June 2022
Furthermore, a leaf’s transpiration rate (Et) can be related the salinity of irrigation water being used (Ayers and Westcot,
to its water potential (Ψ leaf), the water potential of the soil 1985; Hanson and Bendixen, 1995; Assouline et al., 2015).
(Ψ soil) and the resistance to flow (R) as follows (Nulsen and Ayers and Westcot (1985) developed a simple approach to cal-
Thurtell, 1980): culate the leaching requirement based on salt mass balance
calculations. This approach estimates the leaching fraction re-
Et = (Ψsoil − Ψleaf )/R
(3) quired to keep the average root-zone salinity below the salinity
While theoretically sound, plants change these simple math- threshold of the crop, assuming a specific root distribution and
ematical relationships. First, salt accumulates in the root-zone a strictly vertical, continual water flow. Approaches like this
making Ψ s more negative than can be calculated using the neglect the spatial non-uniformity of irrigation water applica-
EC1:5 and W measurements of the bulk soil. Passioura and Frere tion as well as the temporal dynamics of irrigation and water
(1967) define the variable U as the factor by which Ψ s at the uptake during the season (Letey et al., 2011) and assume that
root surface is more negative than in the bulk soil. Experimental the average root-zone salinity determines the impact of salinity
approaches suggest that U can be around 2 in well-hydrated on the crop (Letey and Feng, 2007).
soils (e.g. Sinha and Singh 1974, 1976), but modelling ap- While the physical principles underlying salinity manage-
proaches suggest that U could increase to values around 10 as ment have not changed since Ayers and Westcott developed
the soil becomes drier (Passioura and Frere, 1967). Given this, these leaching guidelines, management goals have shifted over
eqn (2) can be modified to: time to better recognize environmental impacts of nutrient and
salinity losses and develop more advanced micro-irrigation and
(4) Ψsoil = Ψm + UΨs fertigation systems. This has given rise to both new challenges
Second, the resistance of water flow to the surface of the root and new opportunities in managing salinity.
increases as the soil pores around the root become depleted of Challenge 1: Managing salinity under micro-irrigation sys-
water (Stirzaker and Passioura, 1996). This increases the vari- tems. Spatial patterns of salt accumulation are diverse and
able R in eqn (3). differ by irrigation system (Riaz et al., 2018; Wallender and
Given this background, how should heterogeneity of salinity Tanji, 2011), with each irrigation system having specific chal-
in the soil solution in the root-zone be viewed? Unfortunately, lenges to salinity management. In the simplest case, flood ir-
very few of the critical experiments have been done under uni- rigation applies water uniformly across the whole surface
form conditions in the root-zone, let alone variable ones. To (although local topography and soil heterogeneity can cause
our knowledge, no split-root experiments have ever attempted spatially heterogeneous infiltration). In this case, salinity dis-
to compare the effects of different (or even the same) Ψ soil tribution is approximately uniform in the horizontal direction,
values by manipulating the salt and water concentrations on but a salinity gradient exists vertically (Figs 2 and 3). Assuming
each side of the root-zone of a plant, even though the compo- sufficient leaching, salinity increases with depth in these sys-
nents of Ψ soil (Ψ m, Ψ s and U) can all be determined experimen- tems (Ayers and Westcot, 1985) and uniform leaching of salts
tally. Maintaining such treatments is technically challenging, below the root-zone causes the salinity within it to be relatively
requiring new experimental protocols to be developed. In such homogeneous.
experiments, there could be considerable rewards by comparing In contrast, applying water to only part of the surface causes
plants of different salt tolerance. strong horizontal salinity heterogeneity, as in furrow irrigation
and more advanced micro-irrigation systems. Micro-irrigation
aims to target water application to the root-zone, thereby
Opportunities to better manage irrigated agriculture improving water use efficiency by applying less water to re-
gions with low root density and providing an opportunity to
All irrigation water introduces salts to the system (Hanson deliver water at a rate which matches crop demand. Flood and
and Bendixen, 1995) and in regions with high evapotranspir- overhead sprinkler irrigation manage soil moisture and salt
ation and low rainfall, traditional salinity management em- content at the field scale, while micro-irrigation approaches
phasizes deliberate leaching of salts away from the root-zone management at the root-zone scale. Targeted water application
while avoiding elevation of the water table to prevent damage to results in targeted leaching, with micro-irrigation leaching salts
crops (Hopmans et al., 2021). Leaching is usually achieved by in zones which are rich with plant roots, while flood irrigationYou can also read