Political Economy of Third Party Interventions - IEA World ...
←
→
Page content transcription
If your browser does not render page correctly, please read the page content below
Political Economy of Third Party Interventions∗

          Sabyasachi Das                    Souvik Dutta               Abhirup Sarkar
         Ashoka University                 IIM Bangalore                ISI Kolkata
                                       September, 2019

                                             Abstract

        The paper examines political economy consequences of a third party (World Bank)
        intervention in India. The intervention was a capacity building initiative that trained
        local politicians in various governance procedures in a sample of villages. We show
        that the state government reacted to the intervention by allocating additional re-
        sources to program villages with aligned incumbents while reducing allocation in
        program villages with rival incumbents. Consequently, party switching by opposition
        incumbents went up in program villages. Moreover, the reelection rate of incumbents
        went down due to the intervention, especially in GPs where no incumbents switched
        their party affiliations. The results highlight the importance of considering political
        economy consequences of such interventions, even in countries not heavily reliant on
        foreign assistance, to better understand its overall welfare effects.

           JEL Classification: D72, D78, H43, H72, H77
           Keywords: Policy Evaluation, Party Switching, Reelection, Gram Panchayat

   ∗
     Sabyasachi Das:       Economics Department, Ashoka University, Delhi, India (e-mail:
sabyasachi.das@ashoka.edu.in). Souvik Dutta: Economics Department, Indian Institute of Man-
agement, Bangalore, India (email: souvik@iimb.ac.in). Abhirup Sarkar: Economics Research Unit,
Indian Statistical Institute, Kolkata, India (email: abhirup@isical.ac.in). We thank Kaivan Munshi,
Sona Golder, Sourav Bhattacharya, Sugat Chaturvedi, Subhasish Dey and seminar and conference
participants at 17th Nordic Conference on Development Economics (UNU-WIDER, 2018), IIM
- Calcutta, IISER - Bhopal, IIIT - Delhi for helpful comments and suggestions. We are grate-
ful to Indian Institute of Management, Bangalore for their financial support in the form of seed
grant (Project Code: 7399C). We thank the ISGP office (Panchayats and Rural Development De-
partment, Government of West Bengal) and 4th State Finance Commission (Government of West
Bengal) for sharing the data and Soumya Purkait, Utpal Chakraborty and Subrata Chakraborty
for their time and patience in helping us understand the ISGP project. Nematullah Khan and
Imdadul Halder provided excellent research assistance. Usual disclaimers apply.

                                                  1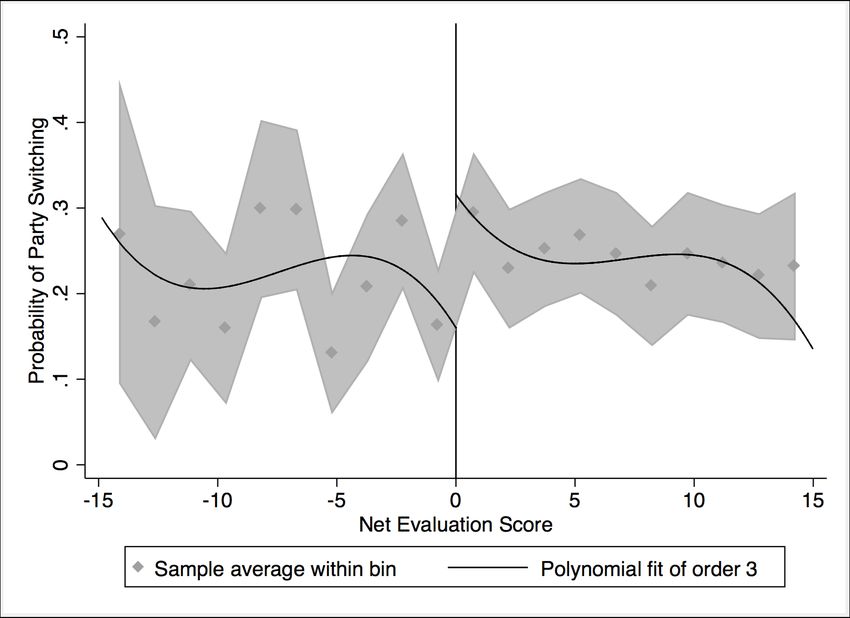
1       Introduction

Policy interventions by international as well as national non-governmental organi-
zations are common in developing countries. The Structural Adjustment Program
by the IMF, Community Development Projects by the World Bank, Global Polio
Eradication Initiative (GPEI) by the Bill and Melinda Gates Foundation (BMGF)
are examples of some large scale policy interventions undertaken by international
organizations in various countries.1 Domestic NGOs working on specific sectors
(such as health or primary education) also provide parallel services to various pol-
icy initiatives of local and regional governments within a country.2 Importantly,
researchers often use third-party interventions, including interventions of their own
(in the form of, say, Randomized Control Trials) to evaluate the effectiveness of
various policies.3 Third party policy interventions often allow the researchers to
address some of the endogeneity problems in estimating program effects that may
be present in evaluating government initiated public programs.
         However, policymaking is inherently a political process. Therefore, any pol-
icy intervention by an outside entity is likely to engender responses by the domestic
political actors. Researchers are cognizant of this fact. Guiteras and Mobarak
(2015), for example, show that a sanitation subsidy intervention by researchers in
villages in Bangladesh led to local politicians attempting to claim credit for the
program. Such “credit claiming” behavior of politicians in response to third party
interventions, especially when the source of funding is not transparent, has been
observed in other contexts as well (see, for example, Böhnke et.al. (2010), Cruz and
Schneider (2014), etc.).
    1
     The scale of some of the programs is quite large. The BMGF, for example, has allocated USD
292 million in 2016 and USD 367.3 million in 2017 towards GPEI (GPEI Annual Reports). The
World Bank has spent USD 85 billion in the period 2000-2010 towards community development
projects across the world (Mansuri and Rao, 2013).
   2
     The NGO Pratham in India, for example, provides various educational services for primary
school children. BRAC is a similar organization providing primary education and health care
services across Bangladesh.
   3
     The set of such papers is too large to cite here. We cite some representative papers evaluating
various types of policies using third party interventions. For example, Olken (2010) examines a
governance intervention in Indonesian villages using a RCT that compares public good provision
under elected politicians and via village meetings. With regard to education policies, Banerjee
et.al. (2007) and Duflo, Dupas, and Kremer (2015), among others, study interventions in primary
schools of India and Kenya, respectively. Tarozzi et al. (2014) and Olken, Onishi, and Wong (2014),
on the other hand, estimate the effects of health interventions in India and Indonesia, respectively.

                                                 2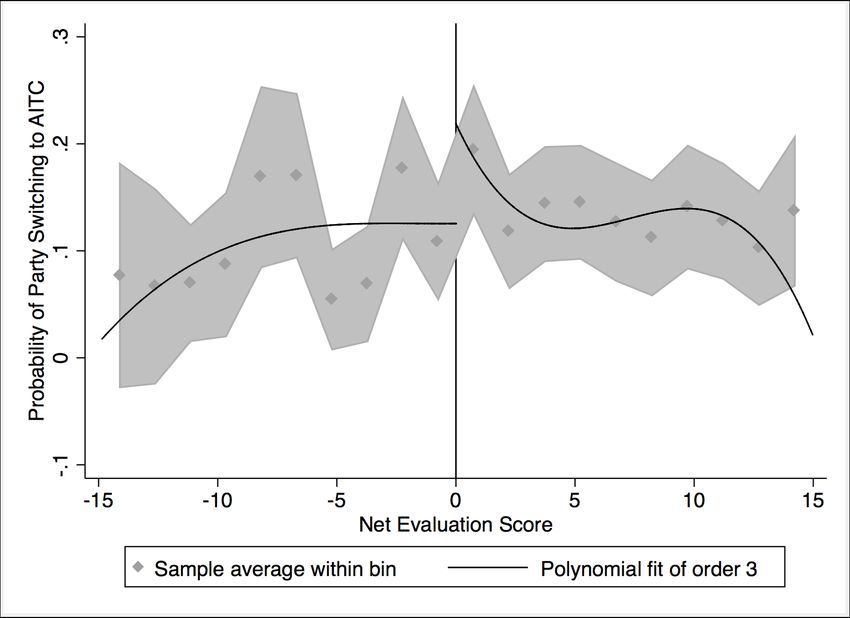
Credit claiming, however, is not the only possible political consequence of
such interventions. How the domestic government reacts to a third party interven-
tion depends, at least partly, on the distribution of political rewards generated by it.
If part of the reward is accrued by the politicians who are aligned to the government,
then the government may act in a way that can complement the intervention. How-
ever, if the intervention rewards rival politicians, then it may react by undermining
it. The political economy effect of third party intervention, therefore, may depend
on how the incentive of the domestic government interacts with the intervention.
Moreover, some of the political economy consequences may not be desirable, and
hence, can be consequential for the overall welfare implication of the intervention.
         In this paper, we examine these concerns and provide evidence of such polit-
ical economy consequences of an intervention by the World Bank in an Indian state.
The intervention in question, known as the Institutional Strengthening of Gram
Panchayats (ISGP) program, was a capacity building initiative that trained local
politicians and officials in various governance practices (such as budgeting, main-
taining accounts, digitization, holding regular meetings etc.) in a sample of 1000
village governments or Gram Panchayats (GPs from now on) in the state of West
Bengal.4 We show that the program led the state government to allocate additional
resources to the “program GPs” (i.e., the GPs that are part of the ISGP program)
with aligned incumbents (i.e., incumbents belonging to the ruling party). This re-
sulted in a significant increase in rival incumbents switching their party affiliations in
favor of the ruling party. The state government further reduced resource allocation
from its own budget to the program GPs with rival incumbents who didn’t switch,
and thereby, undermining the intervention in those GPs. As a consequence, the
overall reelection rate of the incumbents in the program GPs went down (relative
to non-program GPs). The fall in the reelection rate is driven by the non-switchers
(from the opposition parties) in the program GPs. We argue that intensifying party
switching behavior among opposition incumbents and reducing the reelection rate
of local politicians are two undesirable effects of the intervention.
         Our results, therefore, demonstrate how even well intended and well imple-
mented policy interventions by third party organizations may engender unintended
political economy responses. This is especially striking considering the fact that the
  4
      West Bengal has about 3, 500 GPs in the entire state.

                                                 3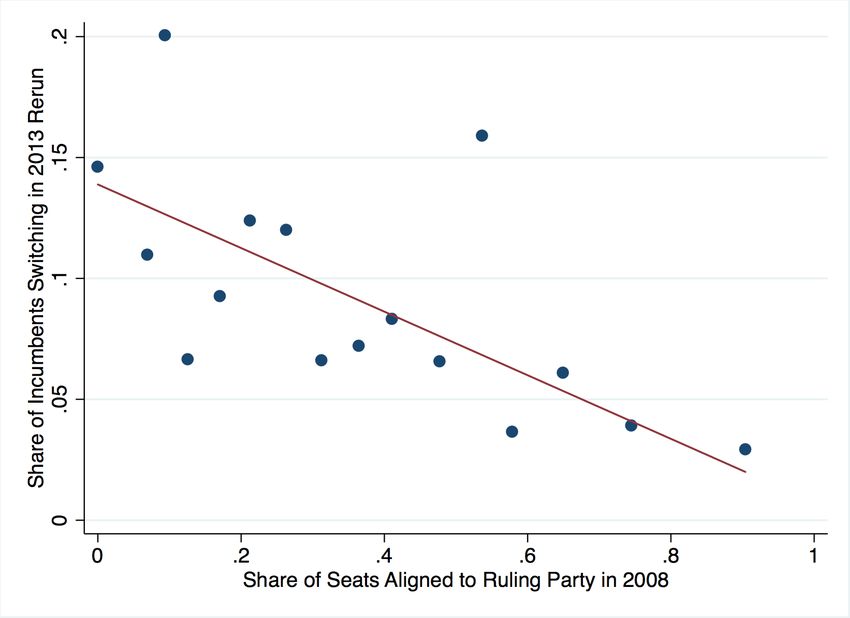
intervention was primarily non-financial in nature and in a context where depen-
dence on outside assistance (financial or otherwise) is relatively low.5
          The ISGP program was launched in 2010 and was funded and implemented
by the World Bank, in collaboration with the Panchayats and Rural Development
Department of the Government of West Bengal. It was intended to improve the
efficacy of the local politicians and officials in their delivery of public goods and
services. Moreover, the GPs that received the training was later audited by the
program officials, and the ones found to be performing better, received lump-sum
grants (“ISGP grant”) under the program. Importantly, the criteria used by the
program officials to select GPs into the program allows us to use the regression dis-
continuity (RD) method to estimate the causal effect of the intervention. We discuss
the selection criteria and the identification issues in detail in Section 4.1. Moreover,
for some of the analysis we test heterogeneity in the program effect (across, say,
aligned and non-aligned GPs). For this we use a method similar to the difference-
in-discontinuity method described in Grembi, Nannicini, and Troiano (2016). We
elaborate on this in Section 4.2.
          We show that the intervention had no effect on the largest government
scheme that the GPs implement –namely the National Rural Employment Guaran-
tee Scheme (NREGS). It, however, did have a positive and statistically and econom-
ically significant effect on the relatively smaller government schemes, indicating that
the intervention did improve the GP’s ability to focus more on the potentially ne-
glected but important activities of the GP politicians.6 Moreover, the post-training
audits of the program GPs reveal that their governance practices improved signif-
icantly in the years following the initiation of the ISGP program. Therefore, the
state government believed that the intervention led to improvement in the gover-
nance capacity of the program GPs. This is important since apart from the central
government schemes that the GPs implement, all GPs receive discretionary grants
   5
      This is in contrast to the literature that discusses political economy effects of foreign aid, which
is focused on countries that are heavily reliant on such aid to carry out their governance activities.
Political economy effects in such contexts may be more likely. We elaborate on this later in this
section when we discuss the literature review.
    6
      The NREGS, unlike the other schemes, is highly politically salient, as the existing literature
shows (Gupta and Mukhopadhyay (2016), Das, Mukhopadhyay, and Saroy (2018)). Therefore,
the local politicians are invested in implementing the program well. Hence, it is likely that the
scope for improvement in NREGS implementation through improvement in governance quality was
minimal, to begin with.

                                                    4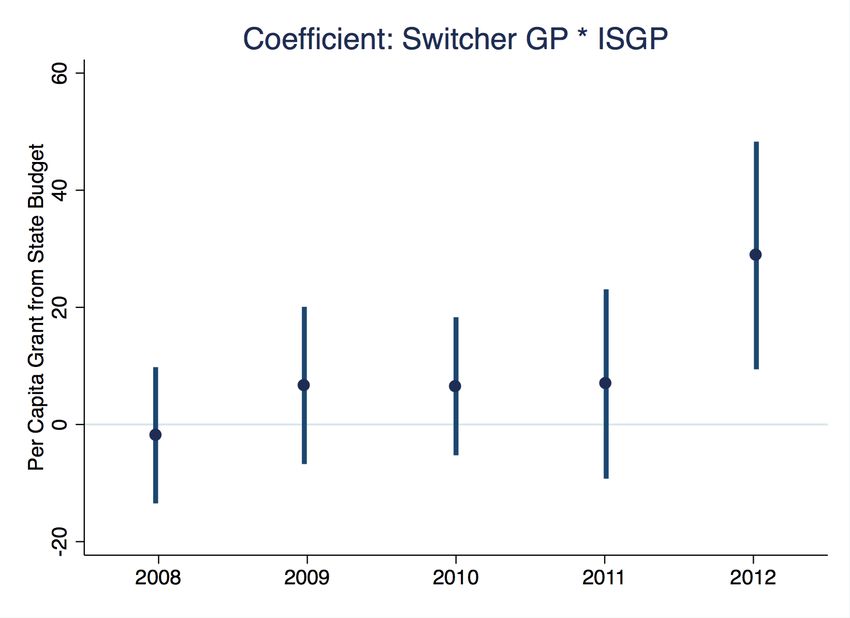
from the state government to spend on various public goods. We show that the
state government responded to the ISGP program by reallocating its discretionary
grants to the program GPs.
         We point out here that a new party—AITC—came into power in the state
in the year 2011, a year after the program was launched, defeating a coalition of
left parties (the Left Front) that was previously in power for multiple terms. In
2011, however, a majority of local governments were still ruled by the Left Front.
Therefore, AITC sought to change this scenario and increase its presence in the
upcoming local elections in 2013. The change in the political leadership in the state,
therefore, created an incentive for the government to reallocate its resources to GPs.
Importantly, the reallocation incentive interacted with the presence of the ISGP
program. Since the program GPs were believed to have better governance capacity,
the intervention would have rewarded the incumbents in the program GPs. We,
therefore, hypothesize that the state government would have incentive to reinforce
the effect of the intervention in program GPs which are aligned to the ruling party
(i.e., where AITC incumbents are present) by allocating higher resources to them.
We use a theoretical framework to argue that such a resource allocation strategy
would maximize the presence of the ruling party in the local governments in the
forthcoming local elections.
         In the empirical analysis, we find that from 2010 onwards, the program GPs,
on average, received higher per capita discretionary grants compared to non-program
GPs, thanks to the ISGP grant.7 However, consistent with our theoretical argument,
we find evidence for heterogeneity in the treatment effect. We show that the aligned
program GPs received even higher per capita discretionary grants (relative to non-
aligned program GPs) from 2011 onwards (and not before).8 The allocation was
32% higher in 2011-’12 and 19% in 2012-’13. Importantly, the aligned non-program
GPs (i.e., aligned GPs from the same districts which were not part of the program)
did not receive higher resources either after or before 2011.9 Therefore, the result
   7
     Before 2010 there was no difference in the allocation of discretionary grants between program
and non-program GPs. This is expected given that the ISGP program began in 2010.
   8
     In West Bengal elections in GPs happen at the level of wards within a GP. Each ward elects
a councilor to the GP council. (See Section 2.1 for details.) Therefore, the incumbents in a GP
are at the level of wards, while resource is allocated to the entire GP. Consequently, we define a
GP to be aligned if the majority of councilors in a GP belong to AITC. The rest of the GPs are
referred to as non-aligned.
   9
     Since our identification strategy relies on the RD method, within the comparison pool GPs

                                                5
can not be explained by the state government’s general willingness to reward aligned
GPs overall.
         We show that as a consequence of the discriminatory allocation favoring
aligned program GPs, probability of party-switching by the incumbent politicians
went up significantly in program GPs. Moreover, most of the increase in switching
was in favor of the ruling party. The practice of switching party affiliation among
the local politicians in rural India is a fairly frequent phenomenon, as we show
later in Section 6. Yet the issue is not well explored in the existing literature
on the local governments in India. In this context, it is important to note the
result, since the literature on party switching highlights that such behavior weakens
the party structure and erodes trust in the political system. Desposato (2006), for
example, argues that “party switching may be viewed as a challenge to representation
when voters use party labels to cast ballots and pick policy platforms. Switching
effectively destroys the meaning of party labels, raises voters’ information costs,
and eliminates party accountability. Switching can be viewed as a threat to the very
core of democratic representation.” The increase in party switching in program GPs,
therefore, points towards a potentially adverse effect of the intervention. To the best
of our knowledge, this is the first paper that shows how discriminatory allocation by
higher level government to aligned local jurisdictions can lead to higher likelihood
of party switching among rival local politicians.
         Our theoretical analysis predicts heterogeneity in treatment effect with re-
spect to whether the GPs had switcher incumbents or not. We hypothesize that the
“switcher program GPs” (i.e., program GPs which had a switcher incumbent) would
receive higher resources compared to “non-switcher program GPs” (i.e., program
GPs without any switcher incumbent). Consistent with our prediction, we find that
the switcher program GPs received 26% higher allocation in 2012-’13 relative to the
non-switcher program GPs.10 We then look at allocation of part of the discretionary
grant that comes from the state budget, and is therefore directly controlled by the
state government. We find that the allocation of discretionary grant from the state
budget to the non-switcher program GPs was in fact reduced in 2011-’12 and 2012-
the program assignment is effectively random. Therefore, the aligned GPs in the sets of program
and non-program GPs are not differentially selected.
  10
     The switcher non-program GPs, however, never received any additional resources relative to
non-switcher non-program GPs.

                                              6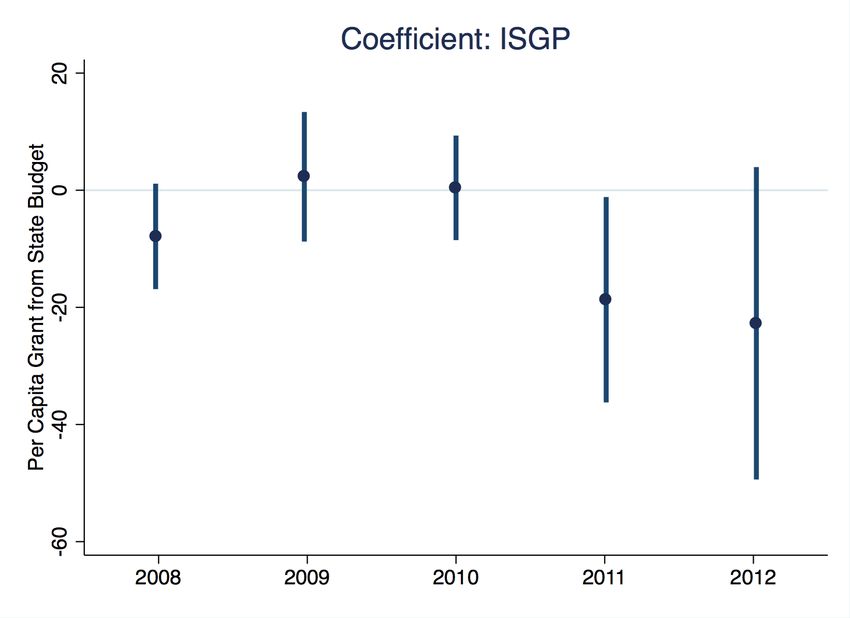
’13. Since resource allocation can complement the governance training program,
the result suggests that the state government undermined the intervention in GPs
where the opposition incumbents didn’t switch in favor of the ruling party. Finally,
we look at rerunning and reelection rates of the incumbents. We find that the in-
tervention didn’t affect the rerunning rate of incumbents. However, conditional on
rerunning, the reelection rates of the incumbents in program GPs went down by
24%. The fall in reelection rate caused by the intervention is completely driven
by the non-switcher GPs. This is consistent with our previous result that found
reduced allocation of state budget grants to those GPs. Since reelection motive
is considered to be an important accountability mechanism that disciplines incum-
bent’s behavior, reduction in reelection rate is potentially also an adverse effect of
the intervention. The ISGP program, therefore, though was benign in its intention
and potentially did improve the governance capacity of the village governments, it
ended up engendering potentially negative political economy consequences.
         This paper contributes to the literature that shows that interventions from
outside entities generate political economy effects at home. Apart from the credit
claiming literature that we discuss above, there is a large literature on foreign aid
that discusses its various political economy consequences. Many of these papers
are in the context of African and Latin American countries, where aid constitutes
a significant part of governments’ resources. This is in contrast to the context we
study, where such dependence on financial and institutional assistance from third
party entities is minimal. Setting aside the contextual distinction of our study,
our work also contributes to the literature in more substantive ways. Some pa-
pers in the foreign aid literature discuss how aid resources (i.e., the intervention
itself) can be strategically manipulated by the domestic government to achieve fa-
vorable political outcomes. Briggs (2012), for example, shows that the incumbent
government in Ghana directed World Bank funds from an electrification project
strategically to constituencies which benefitted them in the elections. Similar ev-
idence has been found in the context of Kenya (Jablonski (2014), Briggs (2014))
and Zambia (Masaki (2018)) as well. Our work, on the other hand, shows that
the domestic government’s own policy can also respond to third party intervention.
Other papers in the foreign aid literature highlight the negative impact of aid on
certain political outcomes, such as corruption (Isaksson and Kotsadam (2018)), civil
conflict (Nunn and Qian (2014)), deterioration of institutions (Djankov et al. (2008),

                                          7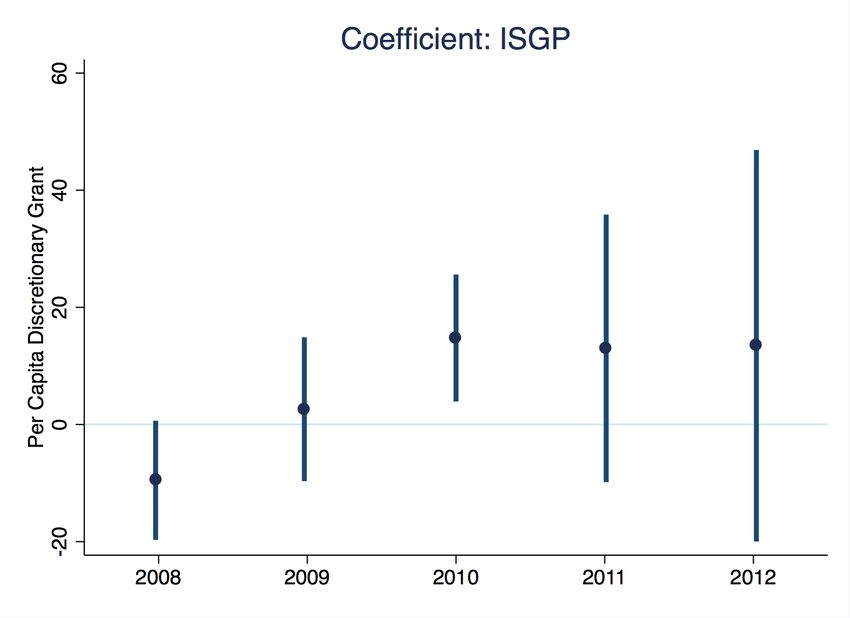
Busse and Gröning (2009)) etc. We contribute to the literature by showing nega-
tive impacts of intervention on reelection rate and party switching behavior of local
politicians. Moreover, the results highlight that political turnover, i.e., change of
political power mid-way through a program implementation can substantially affect
program outcomes by changing political incentives.
         We also contribute to the literature that examines allocation of public re-
sources by a higher level government across local jurisdictions. Bardhan and Mookher-
jee (2006), for example, point out that the state government in West Bengal (under
the Left Front) did engage in strategic allocation resources across GPs to favor cer-
tain groups. Khemani (2003), on the other hand, argues that in the context of India,
constitutional rules can limit the extent to which resource allocation is determined
politically. Several papers point out that politically aligned regional or local gov-
ernments get higher resources from the higher level government (see Solé-Ollé and
Sorribas-Navarro (2008) for evidence from Spain, Worthington and Dollery (1998)
for Australia and Levitt and Snyder (1995) for USA etc.). Our paper shows that
such incentives for strategic allocation can get more pronounced in presence of a
third party intervention that claims to improve governance qualities of local gov-
ernments. Moreover, we show how party allegiance of local incumbents can also
respond to such differential allocation to aligned jurisdictions. Finally, it also adds
to the set of papers that examine party switching behavior of politicians in other
contexts (such as Reed and Scheiner (2003), Yoshinaka (2005), Desposato (2006),
Barrow (2007), Grose and Antoine (2003) etc.). While these papers mostly focus
on national level legislatures and discuss the various factors that shape their party
defection decisions, we study this phenomenon in local elections in India and high-
light how it can be used by the incumbent government to undermine the effect of
an intervention.
         The rest of the paper is organized into the following sections: section 2
lays out the background and institutional details, section 3 describes the theoretical
framework we use to form our hypotheses, section 4 elaborates on the empirical
methodology, section 5 presents the data and the summary statistics, section 6
discusses the results, and finally, section 7 makes concluding observations.

                                          8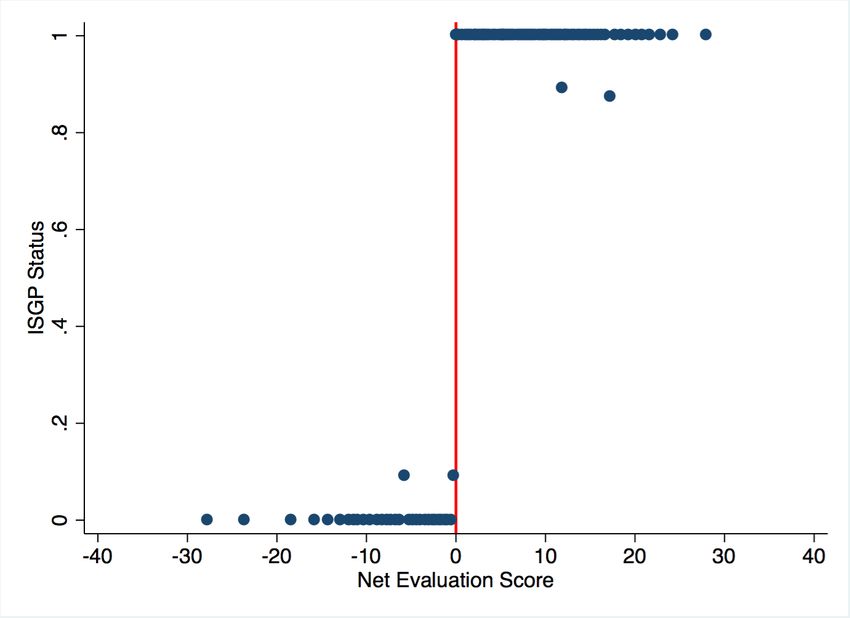
2        Institutional Details and Context

2.1       Village Governance in India

The village council or Gram Panchayat is the lowest tier of governance in India. It
is part of a three-tier governance structure that all Indian states adopted after the
73rd Constitutional amendment in 1993. In this system, each state is divided into
a number of districts. West Bengal, for example, has 18 districts. The districts are
further divided into blocks which are in turn divided into GPs. Each of the three
tiers is governed by an elected council headed by a president. The GP council is
composed of council members each of whom is elected from a single member ward
within a GP. Each GP has a president, known as the sarpanch, analogous to a mayor
in a municipality. All the ward representatives or councilors are elected every five
years in a local election. In West Bengal, the GP president is elected indirectly, by
the elected council members from among themselves.11 Therefore, the elections in a
GP in West Bengal happen at the GP-ward level. Importantly, unlike in most other
Indian states, political parties can nominate candidates in the ward level elections
in West Bengal. Therefore, we know the party affiliations of the candidates as well
as the incumbents.12
         The council members of a GP decide on their activities through deliberations
in their internal meetings. The primary responsibility of a GP council is to provide
local public goods, such as village roads, drinking water facilities (hand pumps, wells,
etc.), primary schools, health centers, irrigation facilities (such as public canals,
watersheds) etc. The GPs, however, have minimal taxation power and hence their
own resources can hardly suffice to meet their expenditure needs. Their expenditure
is met by resources received from higher tier governments, i.e., the state and the
central governments. These resources received by the GPs can be divided into two
broad categories - tied and untied (or discretionary) funds.
         Tied funds are those which are earmarked to be used for a particular gov-
ernment scheme or program. GPs are usually the implementing agencies of these
schemes. We mention four such important schemes. The National Rural Guarantee
    11
     In some other states of India, the Sarpanch is directly elected by the voters, as in a presidential
system.
  12
     In most states of India political parties can not formally nominate candidates in local elections.
Therefore, even though the local candidates may have party affiliations, it is not observable to the
researchers.

                                                   9
Scheme (NREGS) program is a large public works program run by the central gov-
ernment under which one adult member from each rural household is entitled to 100
days of employment in a year. Employment is generated by implementing various
public projects in the villages. This is by far the most politically salient program and
received a lot of attention from researchers. Among the other central government
schemes that GPs implement include the IAY (Indira Awas Yojna) which provides
subsidy to poor households to build a house, the National Rural Health Mission
(NRHM) which provides affordable primary health care services, including mater-
nal health and child care services, to the rural population, and the Backward Region
Grant Fund (BRGF) which provides additional resources to backward regions of In-
dia to meet their local infrastructure needs etc.
Each GP also receives untied or discretionary grants primarily from both the
central government as well as the state government. These grants are not earmarked
for any government program and therefore can be used for the provision of public
goods at the discretion of the GP council. The grant from the state government
constitutes a large share of the total discretionary grants. The state government,
therefore, enjoys a greater degree of control over the amount of discretionary funds
that the GPs receive. The allocation of resources for the central government schemes
is decided by the relevant ministries of the central government. Therefore, the state
government has limited capacity to influence its allocation across the GPs within
the state.
2.2 ISGP Program
In September 2010, the World Bank initiated a program in collaboration with the
state government of West Bengal to strengthen the institutional capacity of local
governments by providing training to the GP politicians and officials. The program
is called the Institutional Strengthening of Gram Panchayats (ISGP). The program
officials first identified nine districts where they wished to focus on and then selected
1000 GPs from the 1684 GPs present in those districts to implement the program.13
We refer to these GPs as “program GPs” and the 684 GPs not selected from the
nine districts as “non-program GPs.” Figure 1 shows the program GPs in shaded
13
The districts are Bankura, Birbhum, Bardhaman, Coochbehar, Dakshin Dinajpur, Howrah,
Nadia, Paschim Midnapur and Purba Midnapur.
10areas in a map of West Bengal.14 We observe that they are spread throughout the
state and therefore, are geographically dispersed. We discuss in detail the criteria
used to identify the program GPs in the section on identification strategy (Section
4.1).
Ü
Gram Panchayats in West Bengal
Blue Color : 940 Gram Panchayats
Figure 1. The ISGP Program GPs in West Bengal
The program had two components –governance training and allocation of
discretionary grants. A team of program officials at the state level trained a number
of teams of officials in each of the nine districts identified for the IGSP program.
The district teams then, in turn, visited the respective program GPs and trained the
politicians and the local officials in the GPs through onsite handholding. The train-
ing involved best practices in budgeting, preparation of annual plans, maintenance
of accounts of revenue and expenses, usage of computers and digital software for
these activities, following procedures for holding village meetings and meetings of
council members, maintenance of compliance protocols and various other governance
issues. There were in total 62 teams involved in training the local functionaries of
the 1000 GPs and, a team on average spent 24 mentoring days in each GP for the
14
The ISGP program is still continuing in the state and since the fiscal year 2016-’17, it has been
expanded to cover the entire state of West Bengal.
11purpose of training. In the subsequent years following the training, the monitoring
and audit wing of the program sent auditors to each of the program GPs to audit
their governance practices on an yearly basis. Moreover, the program provided an
annual discretionary grant to the program GPs which were found to be perform-
ing well according to the audit. This discretionary grant (the “ISGP grant”), like
any other discretionary grant, could be utilized for the provision of any local public
goods and services. For the program GPs, therefore, the total discretionary grant
includes the ISGP grant as well. The ISGP program is managed from within the
relevant department of the state government. Further, the government officials were
also involved in the planning, execution, monitoring, and auditing of the program.
Therefore, the state government exercised control in the allocation of ISGP grant
as well. In the first three years since the program began, 483, 841, and 794 GPs
qualified for the ISGP grant for the financial years 2010-’11, 2011-’12, and 2012-’13,
respectively.15 In the year 2012-’13, the average size of the ISGP grant was about
1.8 million rupees per GP.
2.3 State and Local Elections in West Bengal
In West Bengal, as in the rest of India, both state and local elections happen in
every five years. However, the two types of elections are not synchronized in the
state –the local elections happen two years after the state level election. Figure
2 shows the timeline of the elections in the state for the period 2008–2013. The
state election in 2011 is a critical one as a new party –AITC (All India Trinamool
Congress) –came into power that year defeating the coalition of Left parties, known
as the Left Front, led by the CPI(M) (Communist Party of India - Marxist). Prior
to the 2011 election, the Left Front had been in power in West Bengal for multiple
terms. Importantly, they had a sizable presence in the local governments as well.
In the 2008 GP elections, for example, a majority of wards in our sample GPs were
won by the Left Front. They were also the majority party in a majority of GPs. We
discuss this in further detail in Section 5.2. Therefore, post 2011 while the AITC
was in power in the state government, the Left Front had a significant presence in
the local governments. It is therefore expected that the new ruling party, AITC,
would seek to change this scenario in the forthcoming local elections in 2013.
15
For the financial year 2010-’11 the grant was meant for only six months, as the program began
in September 2010.
122008 2009 2010 2011 2012 2013
St
IS
G
G
at
P
G
P
e
P
El
El
El
Pr
ec
ec
ec
tio
tio
og
tio
ra
n
n
n
m
La
un
ch
Figure 2. Election Timeline
Since the state government allocates discretionary grants to GPs, as men-
tioned previously, the new ruling party could potentially use it to influence the
outcome in its favor. If we look at the GP election outcomes, we do observe that
the share of wards won by AITC doubled in 2013. In sharp contrast to 2008, in
2013 AITC was the majority party in bulk of the GPs in the state. Now, the ISGP
program was introduced in 2010, i.e., the year before the state level election took
place. In the next section, we conceptually examine the consequences of such an in-
tervention on the resource allocation strategy of the new state government in power
after 2011 with an objective to maximize its party’s performance in the upcoming
local elections.
3 Theoretical Framework
To understand the potential implications of the ISGP intervention we posit in this
section a basic theoretical framework. It helps us form expectations regarding the
kind of patterns we expect to observe in the data and guides our empirical tests in
the next section. We conceptualize the problem as an optimization exercise for the
state government. For simplicity we assume that the state has a two-tier governance
structure - the state government above and a number of local governments or GPs
below. The state government has to allocate a given sum of money (say, state re-
sources available for transfers to the local governments) across the GPs. However,
the ruling party of the state is in power in some of the GPs while the opposition
parties rule in the rest of the GPs.16 The objective of the state government is to max-
16
To keep the theoretical analysis simple we assume that in each GP there is only one incumbent
politician and she can belong to either the ruling party of the state government or one of the
13imize the presence of the ruling party across local governments in the forthcoming
local elections. The probability that an incumbent gets reelected in the forthcoming
local election depends on how much resource the GP has received from the state for
the provision of local public goods and services (denoted by r), and the governance
quality of the GP (denoted by g). g therefore denotes the GP’s overall managerial
quality or the level of efficiency with which they implement public projects. Impor-
tantly, r and g are compliments in nature, in determining the reelection probability
of the incumbent. Suppose the probability of reelection of an incumbent, denoted
by p, is expressed as a function of r and g, i.e., p = p(g, r). We assume that
∂p ∂p ∂ 2p
> 0, > 0, and > 0.
∂g ∂r ∂g∂r
This means that p is increasing in both the arguments, and governance quality
and resource allocation are complimentary in nature. Therefore, the same alloca-
tion of resources to a GP would have a larger effect on its incumbent’s reelection
chances if the GP has a higher governance quality.17 To keep things simple, we
assume that initially all GPs have the same governance capacity, i.e, g = g0 for all
GPs.18 The state government is aware of the governance qualities and incumbents’
party affiliations of all GPs. It, therefore, chooses the allocation of resources to
GPs to maximize its objective stated above. This would readily imply that the
state government’s allocation to a GP would depend on the party affiliation of its
incumbent. Specifically, within two GPs that are controlled by different parties, the
one with the ruling party in power would be allocated a higher amount of resources
compared to the one ruled by the opposition.19 Therefore, in absence of any third
opposition parties. We interpret it as a GP having either a “high” presence of the ruling party
(i.e., a larger number of council members belonging to the ruling party), or a “low” presence,
respectively. In the empirical analysis, we accordingly categorize GPs based on whether majority
of incumbents in the GP belong the ruling party.
17
Notice we do not need the cross partial to be high in magnitude. As long as it is positive, i.e.,
there is some complementarity between g and r, our results would follow.
18
In reality, the GPs are likely to be heterogeneous in their governance qualities. However, we
empirically estimate the causal effect of the ISGP program by using the regression discontinuity
design (RDD) method (see Section 4 for details). Hence within our comparison pool of GPs, the
governance quality would be similar across all GPs.
19
To get interior solution for resource allocation to opposition GPs, we assume that it is costly
for the state government to allocate lower than the average resource to any GP and the cost is
convex in the difference between the resource allocated and the average resource. The source
of the cost could be the public pressure created by the opposition parties through media and
14party intervention, one should expect that the GPs with the ruling party in power
gets a higher allocation of state resources, i.e., rruling (g0 ) > ropposition (g0 ), where
rruling (g0 ) is resource allocation to a GP controlled by the ruling party and with
g = g0 . Similarly, we define ropposition (g0 ).
With this baseline, rather straight forward, result in place, one may now
analyze how the ISGP intervention on a subset of GPs may affect the state govern-
ment’s resource allocation problem. As part of the intervention, all the program GPs
receive governance training as well as some additional resources (the IGSP grant).20
The intervention leads to an increase in the governance quality of the program GPs
from g0 to gH (gH > g0 ).21 Now, due to the complementarity between governance
quality and resource allocation, within the set of GPs where the ruling party is in
power, the state government would allocate higher resources towards a program GP
relative to a non-program GP. This is because for the same increase in resource,
the incumbent from a higher quality GP would experience a greater increase in her
reelection probability than the incumbent from a lower quality GP. Therefore, even
though the program GPs, on average, receive higher total resources (thanks to the
ISGP grant), the increase in resources is even greater for the subset of GPs with the
ruling party in power. Hence,
rruling (gH ) − rruling (g0 ) > ropposition (gH ) − ropposition (g0 ) > 0 (1)
We summarize this insight in our first hypothesis:
Hypothesis 1 The program GPs, on average, receive higher resources. However,
for the subset of GPs where the ruling party is in power, the allocation to the program
GPs is even greater.
At this point, we introduce in this framework the possibility of party switching by
incumbent politicians. As we will discuss later in Section 6, party switching is a
common, though less explored, phenomenon in the local political economy of rural
demonstrations etc. to protest against any discriminatory allocation. In absence of any such cost,
the state government would always prefer to allocate zero resource to all opposition GPs.
20
This is a simplifying assumption. In reality some program GPs didn’t receive the ISGP grant
even though they received the training, as we describe in Section 2.2.
21
This is not necessary for us. Even if the program didn’t significantly increase the governance
quality of the program GPs, as long as the state government perceives it to be the case, the results
would follow.
15India. The possibility of local politicians switching their party affiliations allows
an additional channel through which the ruling party at the state can improve its
presence in the local governments. In the subsequent discussion, we examine the
implication of such a possibility.
Suppose some of the incumbents are willing to switch their party affiliation.22
Clearly, if switching incentives are, at least partly, shaped by resource allocation
then, the opposition party incumbents would have a greater incentive to switch to
the ruling party than the other way around. Moreover, Hypothesis 1 implies that,
we should expect a higher degree of party switching in the program GPs compared
to non-program GPs. This is because of the following reason: rearranging equation
(1) gives us
rruling (gH ) − ropposition (gH ) > rruling (g0 ) − ropposition (g0 ). (2)
Here, (rruling (g0 ) − ropposition (g0 )) represents the gain in resource for an incumbent
belonging to an opposition party in a non-program GP switching her affiliation to
the ruling party. Similarly, (rruling (gH ) − ropposition (gH )) represents the same in a
program GP. Therefore, equation (2) shows that incumbents from opposition parties
gain more resource from switching if they belong to a program GP. This gives us
our next hypothesis:
Hypothesis 2 The intervention increases party switching behavior. Switching is in
favor of the ruling party in the state government.
Further, if we compare two switchers, one each from a program and a non-program
GP, we expect the switcher in program GP to have a higher allocation of resources, as
apparent from equation (2). We collect this observation in the following hypothesis:
22
There could be unobservable characteristics of the incumbents, such as (lack of) loyalty towards
a party or (lack of) belief in a specific ideology etc., which could make them more prone to party
switching. We assume that such incumbents are present in equal proportions across both program
and non-program GPs. This implicitly assumes that the intervention was done on a randomly
selected subset of GPs. In reality, the program GPs were not selected randomly, as we describe
above. However, as before, our RDD methodology in the empirical analysis ensures that within
our comparison pool of program and non-program GPs, the program assignment was effectively
random.
16Hypothesis 3 Within the set of GPs where the incumbents switch party affiliations,
the program GPs receive more state resources than non-program GPs.
Our theoretical analysis, therefore, highlights the importance to take into
account how the state government may respond to an intervention. It shows that
the response from the state government generates heterogenous effects of the in-
tervention. We now turn to the discussion on empirical analysis where we show
evidence in favor of this heterogeneity by testing the hypotheses.
4 Empirical Methodology
4.1 Identification
We wish to estimate the causal effect of the ISGP program on various outcome
variables to test our hypotheses. However, the program GPs were not randomly
selected. Therefore, we can not simply compare the average values of the outcome
variables in program vs. non-program GPs. The program officials first selected
nine districts from the full list of 18 districts of West Bengal, since these were the
most well-functioning districts of the state. The officials then used an index of
performance created by the state government, known as “self-evaluation scores,” to
select the 1000 GPs out of the total 1684 GPs present in the 9 districts. These
scores, ranging from 0 to 100 in value, were created using the responses of the GP
functionaries in a Self Evaluation Survey conducted in 2007-’08. The survey was
conducted by the relevant department of the state government for the entire state
and had been done on an annual basis for the previous few years as well.
The survey asked a range of questions on attendance of villagers in Gram
Sansad meetings23 , civic services (such as road construction, wells and drainage
repairing etc.) delivered, pro-poor activities undertaken, physical infrastructure
constructed, mobilization and utilization of resources, management of GP offices
and documents etc. Each of these items were scored based on how well a GP had
performed on them, as reported by the GPs. The aggregate score created from the
individual scores is referred to as the self-evaluation score.
The program officials used a cut-off value of the self-evaluation score to
select the GPs into the program. We, therefore, identify the causal impact of the
23
Gram Sansad meetings are regularly held village meetings where villagers can voice their
demands for various public goods to the local politicians.
17ISGP program by exploiting the fact that inclusion of GPs into the ISGP program
is plausibly exogenous across GPs around the cut-off score. Hence, we use a sharp
regression discontinuity design (RDD) to select our treatment and control GPs.
The threshold value of evaluation score that was used to decide inclusion into the
program was district specific. This is because for each district, GPs were ordered
according to their evaluation scores and the top 60% GPs were included in the
program. We therefore create a net evaluation score which is the evaluation score of
a GP net of the relevant district specific cut-off and use that as our forcing variable.
If the variable takes negative value then the GP is not included in the program,
while a positive value would mean that the GP is part of the program. Figure 3(a)
shows the distribution of the ISGP status GPs (included or not) as a function of the
net evaluation score. We observe that there is a strict discontinuity in the program
status of GPs at the net evaluation score of zero.
(a) Discontinuity in Evaluation Score (b) McCrary Test
Figure 3. Random ISGP Status Assignment at the Evaluation Score Cutoff
It is important to emphasize here that the self-evaluation survey that the
program officials used was conducted in 2007-’08, i.e., three years prior to the ISGP
program. The GP politicians had no knowledge of the ISGP program at that time.
Therefore, there is no reason to believe that there was manipulation of this score
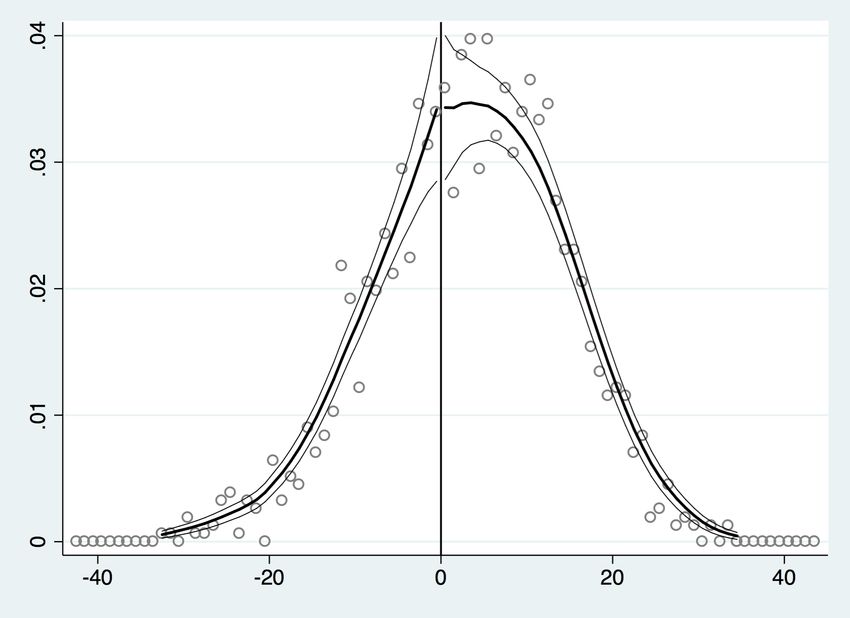
around the (district specific) cut-off to get in or out of the program. We formally
test this claim by carrying out the McCrary test. Figure 3(b) plots the density
of the net evaluation scores for negative and positive values separately. We see
that the densities are not statistically different from each other at the cut-off value
18of zero. To further bolster our claim that the RD design helps us identify the
causal impact of the program, we show that various baseline characteristics of GPs,
such as total population, population belonging to SC/ST groups, sex ratio, etc.,
move continuously as a function of the forcing variable at the cut-off value of zero.
Appendix Table A2 reports the results of running a RDD specification on nine
baseline characteristics. For all the variables we get that there is no discontinuity
at the threshold score, implying that the GPs which are on both sides of the cut-
off and are in the neighborhood of the cut-off are comparable in terms of baseline
characteristics. Therefore, any discontinuity in the outcome variables at the cut-off
score can be attributed to the causal effect of the program.
The rationale for using the evaluation score as the selection criteria, as
explained by the program officials, was that the evaluation score is supposed to
capture how well-functioning a GP is. The program officials intended to initiate
the program in the most well-functioning GPs within each district. Since the nine
districts chosen for the program have 1684 GPs, and the budget for the program
dictated that they could roll out the program only in 1000 GPs, they chose the top
60% GPs within each district using the evaluation score. Whether the claim of the
program officials is true or not is, however, hard to say. Since the score is based
on the responses of the GP officials to a survey, the score could be a very noisy
index of governance quality.24 Whether the score is a good measure of governance
quality or not, however, has no bearing on our identification strategy. As long as
the nature of the relationship between the evaluation score and governance quality,
howsoever complex, doesn’t change discontinuously around the district specific cut-
off points, the RDD method would give us the correct estimate of the causal effect
of the program.
4.2 Empirical Strategy
We consider two sets of outcome variables for our analysis —the GP resource al-
location and the electoral outcomes of the incumbents. We note that even though
the elections in a GP happen at the level of wards, the revenue received is at the
24
We regress the net evaluation score of GP on its per capita NREGS expenditure and per
capita person-days generated under NREGS in the year 2012-’13, controlling for a host of GP level
observables and district fixed effects. We find that higher net evaluation score is indeed positively
correlated with greater NREGA implementation (see Appendix Table A1).
19level of the entire GP. Our unit of analysis is, therefore, either a GP or a ward
within a GP depending on which outcome variable we focus on. Moreover, some
of our empirical exercises involve testing for heterogeneity in the program effects.
For example, Hypothesis 1 tests whether the intervention led to additional resources
being allocated to aligned program GPs (i.e., program GPs with AITC in power).
We therefore have to identify heterogeneity in the discontinuity (across aligned and
non-aligned program GPs). Hence, we propose an approach similar to the difference-
in-discontinuity method proposed by Grembi, Nannicini, and Troiano (2016). We
first compute the optimal bandwidth for an outcome variable, h∗ , using the MSERD
method proposed by Calonico, Cattaneo, and Titiunik (2014). We then restrict the
sample to GPs with net evaluation scores in the range [−h∗ , h∗ ].25 To test for hetero-
geneity claimed by Hypothesis 1 we define a dummy variable Mgd which takes value
one if the GP g in district d has majority of council members belonging to AITC
party at the baseline (i.e., after the 2008 GP elections), and zero otherwise. We say
that GPs with Mgd = 1 are ruled by AITC and refer to them as aligned GPs. Since
decision-making within GPs happens through deliberation and negotiation among
council members, this we believe is a fair assumption to make. Finally, we run the
following specification:
Rgd = φd + γ1 I[scoregd > 0] + γ2 Mgd + γ3 I[scoregd > 0] ∗ Mgd
+β1 scoregd + β2 I[scoregd > 0] ∗ scoregd + gd , (3)
where Rgd is per capita resource allocation in GP g in district d, scoregd is the net
evaluation score of the GP, and φd is district fixed effect. β1 (β1 + β2 ) captures
the linear relationship between the outcome variable and the net evaluation score
to the left (right) of the threshold score. We use local linear regression on the two
sides of the threshold following Grembi, Nannicini, and Troiano (2016).26 Many
25
The value of h∗ and hence the estimation sample would depend on the specific outcome variable
considered. Therefore, the sample size may vary across outcome variables.
26
The context of Grembi, Nannicini, and Troiano (2016) requires them to test for heterogeneity
in discontinuity over time (before and after changes in fiscal rules). Therefore, they allow the linear
relationships to also change over time. In our context, the source of heterogeneity is cross-sectional
(across aligned and non-aligned GPs, for example). Therefore, we have the same linear fit for each
of the control and treatment samples. However, we test specification (3) for each year within the
tenure of a GP council separately. Therefore, in our analysis we do allow β1 and β2 (and all other
coefficients) to vary over time.
20researchers also propose this as the benchmark, or even the ideal design in contexts
involving RDD (see Gelman and Imbens (2019), Imbens and Lemieux (2008)). γ1
is the discontinuity in resource allocation at the threshold score for GPs which are
not aligned. Hence, γ1 is the causal effect of the intervention on the non-aligned
GPs. γ1 + γ3 , on the other hand, is the effect of the program on the aligned GPs.
Hypothesis 1 predicts that both γ1 > 0 and γ3 > 0. We use district fixed effects
to ensure that we compare the treatment and control GPs within a district. Since
the GPs are spread through out the state and the resource allocation strategy may
vary by geographic region of the GPs, owing to historical and topographical factors,
absorbing the district specific characteristics makes the estimation sharper.
We explain the test of Hypothesis 1 to elaborate on our empirical strategy
in general. The testing of Hypothesis 2 doesn’t require any test of heterogeneity.
Hence we use the standard RDD method in that case. Hypothesis 3 again involves
test of heterogeneity. The empirical strategy for the test, therefore, is similar to the
one explained here. We discuss the specification for the test in the relevant segment
of Section 6 where we discuss the results.
5 Data Description
5.1 Sources and Compilation
We compile several administrative datasets from four different sources for our anal-
ysis. We describe the datasets below.
Election Records and Coding of Incumbent Behavior: The detailed ward-
level election records for the 2008 and 2013 village elections are obtained from the
State Election Commission. The dataset contains the names and party affiliations
of all the candidates, along with their vote tallies. We match the names of the
candidates across the two elections to create markers for the council members from
2008 election who were rerunning in 2013 and who got reelected. For a given council
member in a ward in a GP in 2008, we search for a candidate with the same name
appearing in the candidate list of any ward election within the GP in 2013. If the
name appears then we code the council member to be rerunning in 2013. Similarly,
if there is a winner in any 2013 ward election within the GP with the same name as
21the council member then we code the council member as reelected in 2013.27
Since the election results contain the party affiliations of the candidates, one
can also match the party names across the two elections for the subset of incumbent
council members from 2008 who chose to rerun in 2013. We check if the rerunning
incumbents have the same party across two elections or not. If the party names
do not match, then we code the incumbent as a “party switcher.” This allows us
to compute party switching rates of incumbents across GPs in our sample. This
method suffers from the same problem of miscoding as the name matching method.
However, the causal effect of the program on party switching behavior should still
be valid for the reason explained in the previous footnote. One additional issue with
this approach is that we only observe party switching by those incumbents who chose
to rerun in 2013. However, we are interested in the incentive of the local incumbent
to switch parties only if she is rerunning. This is because the state government’s
resource allocation strategy would depend on the behavior of only those incumbents
who are rerunning as they could potentially be co-opted to increase the ruling party’s
presence in the GP. Therefore, we do have the necessary information regarding party
switching behavior that we need for the analysis.
GP Budgets: It is generally hard to get data on GP level budgets, as the GP
accounts are not streamlined and digitized in most states of India. We, however,
were able to access from the office of the fourth State Finance Commission (SFC)
of West Bengal, the yearly revenue and expenditure details of GPs for the period
2008–2013. The dataset on GP budget contains detailed information on revenue
received from various sources as well as expenditure carried out under various heads
for every year during 2008–2013. One of the primary objectives of the SFC is to
propose a formula to allocate across GPs (and other local government entities) the
state government’s resources dedicated to local governments. For this purpose, they
had carefully collected this data from each GP. Moreover, they had sent out teams
of inspectors to a subset of GPs to verify their actual accounts to get a sense of the
27
Understandably, this method may have errors. It is quite possible that a different individual
bearing the same name as one of the incumbent council members may be running for election
in the same GP. Therefore, our measures of rerunning and reelection rates could potentially be
higher than what they truly are. We, however, should not expect the extent of such errors to
change discontinuously around the evaluation score threshold. Therefore, the estimates of the
causal effect of the program on these rates should still be valid.
22budgets. Therefore, it likely that the data is of high quality. We compliment this
dataset with official records on NREGS expenditure details for the year 2012-’13,
available from the official portal of the program: www.nrega.nic.in. Since we have
the information about NREGS expenditures for 2012-’13 from the SFC data as well,
we are able to verify the accuracy of SFC reports. We find that on average there is
no difference between the two figures, which gives us confidence in using the SFC
data for our analysis.
ISGP Administrative Data: We collect administrative data regarding the ISGP
program from the ISGP Project wing within the Panchayats and Rural Development
Department, Government of West Bengal. The dataset includes the evaluation
scores of all the GPs in the 9 districts initially chosen by the program officials for
the years 2005-’06 to 2008-’09.28 It also contains some additional information about
the quality of governance practices of the program GPs as assessed by the program
auditors.
Demographic Data: We match the datasets with details of demographic infor-
mation of the GPs, such as total population, sex ratio, SC/ST population, etc. The
demographic dataset was compiled by the fourth State Finance Commission (SFC)
using the census of 2011 and was generously shared by the SFC officials.
5.2 Descriptive Statistics
Table 1 reports the descriptive statistics for demographics, election data and GP’s
revenue and expenditure figures. We have complete election data for 17345 unique
wards across 1370 GPs comprising of both ISGP and non-ISGP GPs for 2008 and
2013. Of these GPs, the demographic details are for 1351 GPs.
Panel A in Table 1 shows the descriptive statistics related to demographics.
The average population of GP is 20, 261 of which 36% belong to scheduled class (SC)
or scheduled tribe (ST) groups.29 The literacy rate and sex ratio of the sample GPs
are 0.77 and 0.93, respectively. Panel B reports the summary of electoral outcomes.
It shows that on average 17% of the incumbents from 2008 reran for office in 2013
28
We only use the evaluation score based on the 2007-’08 survey for our purpose.
29
The Scheduled Castes (SCs) and Scheduled Tribes (STs) are officially designated groups of
historically disadvantaged people in India.
23You can also read