Population, Employment & Dwelling Units Projections - Squamish-Lillooet Regional District
←
→
Page content transcription
If your browser does not render page correctly, please read the page content below
P a g e |1

Squamish-Lillooet Regional District
          Population,
          Employment
               &
   Dwelling Units Projections

                 Report By:
         Urbanics Consultants Ltd.
         #1207, 409 Granville Street
          Vancouver BC V6C 1T2
P a g e |2 (this page left blank for duplex printing)
P a g e |3

Table of Contents

1.   Introduction ......................................................................................................................................... 5
     1.1.   Purpose ........................................................................................................................................................5
     1.2.   Definitions .....................................................................................................................................................7
     1.3.   Approach ......................................................................................................................................................8
     1.4.   Limitations ....................................................................................................................................................8
2.   Demographic Analysis ..................................................................................................................... 10
     2.1. Demographic Trends .................................................................................................................................. 10
     2.2. Population Projections ................................................................................................................................ 14
          2.2.1. Summary of the three growth scenarios: ....................................................................................... 15
          2.2.2. Implications of Medium Growth Scenario ...................................................................................... 16
          2.2.3. Review of 2016 Census Data Release .......................................................................................... 20
3.   Economic Base Analysis & Employment Projection .................................................................... 22
     3.1. Regional Economic Outlook ....................................................................................................................... 22
     3.2. Employment Trends & Projections ............................................................................................................. 23
          3.2.1. Employment Trends ...................................................................................................................... 24
          3.2.2. Employment Trends SLRD ............................................................................................................ 26
          3.2.3. Employment Projection SLRD ....................................................................................................... 28
          3.2.4. Employment Trends Whistler......................................................................................................... 30
          3.2.5. Employment Projection Whistler .................................................................................................... 31
          3.2.6. Employment Trends Squamish...................................................................................................... 33
          3.2.7. Employment Projection Squamish ................................................................................................. 35
          3.2.8. Summary of Employment Projections - Squamish Lillooet Regional District ................................. 36
4.   Housing Market Conditions ............................................................................................................. 38
     4.1. Difference Between Private Dwellings & Occupied Private Dwellings ...................................................... 38
          4.1.1. Types of Housing in the SLRD ...................................................................................................... 39
          4.1.2. Housing Tenure ............................................................................................................................. 39
          4.1.3. Household Size ............................................................................................................................. 41
          4.1.4. Median Age of Household Maintainer and Average Person per Household .................................. 42
          4.1.5. Housing Pricing ............................................................................................................................. 43
          4.1.6. Housing Conditions ....................................................................................................................... 46
          4.1.7. Housing Building Permits and Housing Starts ............................................................................... 47
5.   Dwelling Unit Projection .................................................................................................................. 48
     5.1. Projected Population and Household Growth ............................................................................................. 50
     5.2. Tenure Preference ...................................................................................................................................... 51
     5.3. Dwelling Type Preference........................................................................................................................... 55
6.   Main Findings ................................................................................................................................... 58
P a g e |4 Figures and Tables Figure 1: Squamish Lillooet Regional District Map, 2011 ............................................................................................... 6 Figure 2: Population comparison of areas within Squamish Lillooet Regional District ................................................. 11 Figure 3: Population growth rates all areas within Squamish Lillooet Regional District, 1996-2011 ............................ 13 Figure 4: Population Projection, Three Scenarios for Squamish Lillooet Regional District, 2001-2036........................ 15 Figure 5: Population Distribution Medium Scenario, 2001-2036 .................................................................................. 17 Figure 6: Population Projections for SLRD, Squamish, Whistler, and Pemberton 2001-2036 ..................................... 19 Figure 7: Population Growth by Age Group 2001-2036 ............................................................................................... 20 Figure 8: Median Household Income SLRD, 2011 ....................................................................................................... 24 Figure 9: Employment Share by Industry, 2011 ........................................................................................................... 25 Figure 10: Share of Labour Force by Industry SLRD, 2001-2011 ................................................................................ 27 Figure 11: Share of Labour Force by Industry Whistler, 2011-2011 ............................................................................. 30 Figure 12: Share of Labour Force by Industry, 2001-2011........................................................................................... 34 Figure 13: Owned versus Rented Numbers throughout SLRD, 2011........................................................................... 40 Figure 14: Number of People per Dwelling as a Percentage SLRD, 2011 ................................................................... 41 Figure 15: Median Age of Household Maintainer and Average Person Per Household SLRD, 2011 .......................... 43 Figure 16: Home price index - average for Squamish and Whistler, 2005 – 2016 ....................................................... 44 Figure 17: Average Gross Rent for all Residential Dwellings SLRD, 2011 .................................................................. 45 Figure 18: Age of Dwelling within the SLRD, 2011....................................................................................................... 47 Figure 19: Total Value of Residential Buildings Permits & Number of Housing Starts in the SLRD, 2006-2015 .......... 48 Figure 20: Projected housing stock by type SLRD, 2011-2036 .................................................................................... 56 Figure 21: Dwelling units Composition in 2016 Compared to 2036 SLRD ................................................................... 57 Table 1: Population comparison of areas within Squamish Lillooet Regional District................................................... 11 Table 2: Population comparison of areas within Squamish Lillooet Regional District, 1996-2011 ............................... 12 Table 3: Population Projection, Three Scenarios for Squamish Lillooet Regional District, 2016-2036 ......................... 14 Table 4: Population Projection, Three Scenarios with Natural Increase, Migration and Net Growth, 2016-2036 ......... 16 Table 5: Population Distribution Medium Scenario, 2001-2036 ................................................................................... 18 Table 6: Population Projections for SLRD, Municipalities and Electoral Areas, 2001-2036 ......................................... 18 Table 7: Difference between Urbanics & Census Canada's dwelling/population projections in 2016 .......................... 21 Table 8: BC Economic Outlook 2012-2036 .................................................................................................................. 22 Table 9: BC & SLRD Building Permit Data 2011-2016................................................................................................. 22 Table 10: Employment Share by Industry, 2011 .......................................................................................................... 26 Table 11: Share of Labour Force by Industry SLRD, 2001-2011 ................................................................................. 28 Table 12: Labour Force Projection SLRD, 2011-2026 ................................................................................................. 29 Table 13: Share of Labour Force by Industry Whistler, 2011-2011 .............................................................................. 31 Table 14: Labour Force Projection for Whistler, 2011-2026 ......................................................................................... 32 Table 15: Labour force by industry in Squamish, 2001-2011 ....................................................................................... 34 Table 16: Labour force Projection by Industry, 2011-2026........................................................................................... 36 Table 17: Total Labour Force Growth, 2011-2026 ....................................................................................................... 37 Table 18: SLRD’s total private dwellings vs. total occupied private dwellings .............................................................. 38 Table 19: Housing Types throughout SLRD, 2011 ....................................................................................................... 39 Table 20:Owned versus Rented Numbers throughout SLRD, 2011 ............................................................................. 40 Table 21: Total Population Growth by Age Cohort SLRD, 2011-2036 ......................................................................... 51 Table 22: Total Household Growth by Age Cohort SLRD, 2011-2036 ......................................................................... 51 Table 23: Projected Growth of Owner and Renter Occupied Dwellings SLRD, 2011-2036 ......................................... 54 Table 24: Project Dwelling Growth by Type SLRD, 2011-2036 .................................................................................... 55 Table 25: Employment |Growth by Industry, 2011-2026 .............................................................................................. 59 Table 26: Total Dwelling Growth by Age Cohort SLRD, 2011-2036 ............................................................................. 60 Table 27: Dwelling Projection by Type SLRD, 2011-2036 ........................................................................................... 60 Table 28: Population and Housing Projections by Area 2016-2036 ............................................................................. 61
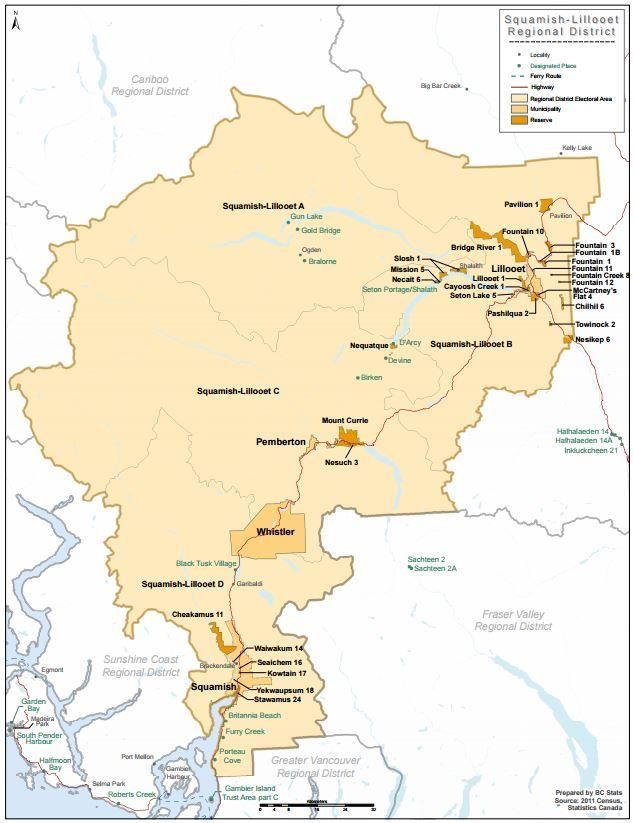
P a g e |5

1. Introduction

The Squamish-Lillooet Regional District (SLRD) is located in south-western British Columbia,
home to approximately 39,000 residents. Within the Region are four municipalities and four
electoral areas. The four municipalities that contain a significant portion of the population and
dwelling count are named: The District of Lillooet; the Village of Pemberton; the Resort
Municipality of Whistler; and the District of Squamish. The overarching electoral areas span much
of the rural area and are named: Electoral Area A (Upper Bridge River Valley), Electrical Area B
(Yalakom Valley/Pavilion Lake/Texas Creek), Electoral Area C (Pemberton Valley/Mount Currie
– D’Arcy corridor) and Electoral Area D (Howe Sound East/Upper Squamish Valley/Squamish to
Whistler corridor).

1.1. Purpose

Urbanics Consultants Ltd. was retained by the SLRD to conduct demographic analyses, economic
base analyses, employment projections and private occupied dwelling unit projections. The
demographic analysis is an evaluation of the population of the Region which will provide readers
with a better understanding of the characteristics of the area and will serve as a vital starting point
for further analyses. Population projections are based on fertility, mortality and migration rates,
three population growth scenarios will be analyzed. The economic base analysis is an
examination of the strengths of various industrial sectors in comparison to the Provincial
economy. This is especially helpful in determining the importance of various sectors of the
economy and in identifying potential growth industries. In addition, the analysis will be the basis
of the employment growth projections that are conducted for individual industries; based on
projected growth of those industries and expectations related to the Provincial economy. Lastly,
a private occupied dwelling unit projection will be conducted which will first evaluate local housing
market characteristics and thereafter provide projections of the total dwelling unit broken down by
dwelling type. The findings from these analyses will provide some of the critical building blocks
for updating the Regional Growth Strategy.
P a g e |6

Figure 1: Squamish Lillooet Regional District Map, 2011
Source: Urbanics Consultants Ltd., 2011 Census, BC Statistics & Statistics Canada
P a g e |7

1.2. Definitions
Occupied Private Dwelling – A separate set of living quarters which has a private entrance
either directly from outside or from a common hall, lobby, vestibule or stairway leading to the
outside, and in which a person or a group of persons live permanently.

Private Dwelling – A separate set of living quarters which has a private entrance either directly
from outside or from a common hall, lobby, vestibule or stairway leading to the outside, and in
which a person or a group of persons occupied by usual residents or by foreign and/or
temporary residents.

Cohort-Component Method – a method of projecting growth based on the components of
population change (fertility, mortality, and net migration) that are projected separately for each
birth cohort (persons in a given year). The base population is advanced each year by using
projected survival rates and net international migration.

Household Maintainer – First person in the household identified as someone who pays the rent
or the mortgage, or the taxes, or the electricity bill, and so on, for the dwelling.

Basic industries – an industry that exports all or nearly all of its production to another area.

North American Industry Classification System (NAICS) coding system - classifies industries as
either goods-producing industries such as agriculture, utilities and construction or services-
producing industries such as real estate, arts and public administration.

Canadian Occupational Projection System (COPS) - report that provides national labour market
trend analysis and 10-year labour market forecasts for each industry segment.

Home Price Index (MLS HPI) - is a tool developed by the British Columbia Multiple Listing Service
(MLS) to gauge the value of housing. The HPI takes into consideration what averages and median
do not by factoring in a variety of characteristics of a new sale, such as the number of bedrooms,
bathrooms, if the home has a fireplace, the size of the lot and various other characteristics.

Age-cohort – is a group of people who are in the same age range, for example, those within the
ages of 0-4 or 5-9.
P a g e |8

1.3. Approach

The study uses comprehensive analytical methodologies which disseminate characteristics of
the Region and develop projections presenting key findings related to the demographic,
economic and housing profiles of the Region. The study includes the following sections:

   1. Demographic Analysis: This section examines historical demographic trends, such as
       gender, age, life expectancy, death rates, fertility rates and migration rates, associated
       with the Region’s population. This study uses the Cohort-Component method to project
       the Region’s population and its distribution (gender and age) over the study period (2016
       -2036).
   2. Economic Base Analysis & Employment Projection: This section examines historical
       employment trends related to various industrial sectors in the Region’s economy (NAICS
       categories such as agriculture, forestry, mining, manufacturing and other). In addition, it
       projects employment (Constant-Share method) levels for the study period (2011-2026)
       and identifies the key growth sectors of the economy.
   3. Housing Market Conditions: This section will examine the housing market in the
       Squamish Lillooet Regional District including, dwelling type, household size, housing
       tenure, home prices, rental rates, age of dwellings, starts and permit activity.
   4. Occupied Private Dwelling Unit Projection: The final section in the study assesses the
       local housing market characteristics on a Regional and area basis. It then delves into
       projections of housing units, which is based on population growth and household
       maintainer rates per age cohort. It also addresses household trends providing
       observations on how the composition of the housing stock is projected to evolve over the
       study period (2016 - 2036).

1.4. Limitations

Similar to studies of this nature, this study has several limitations that might arise from the quality
of background data. For example, the population and employment projections for the Region are
based on Census counts (2001-2011), NHS (2011) and several assumptions related to the
economy, employment and population characteristics (mortality rates, fertility rates, and migration
rates), which might suffer from data quality issues. The consultants have tried to minimize such
data quality issues by choosing the most recent and reliable datasets and have accounted for the
P a g e |9 undercounts that the data sources have identified in their findings. Should these or any of the other assumptions noted in this study, be undermined by the course of future events, the consultant recommends that the study’s findings be re-examined. It should also be noted that the total population of the SLRD does not equal that of all of the municipalities and electoral Areas. This discrepancy is due to the fact that the Indian reserves and Indian settlements within the SLRD are not included in the projections. As advised by Census Canada, population and dwelling counts are not available for a large portion of Indian settlements; therefore, missing data for areas with indigenous population is common albeit a small percentage of the overall population. The reader is advised that the study is based on the assumption that the Region has adequate capacity for growth and its growth will only be as a result of exports from basic industries; and not from any exogenous shocks (unpredictable) to the local economy, such as any new public or private investments. This is especially important for the Region as an unforeseen investment in the Regional economy can have significant impact on the number and distribution of jobs. Assumptions have been made for the housing projections due to limitations in the data sets, they are described as follows. The household maintainer rates (percentage of age cohorts responsible for financial security of a household) as of the 2011 Census have remained constant throughout the study period. The breakdown of housing types is assumed to follow historic trends such as the decrease in popularity of single-detached dwellings, and does not account for exogenous circumstances that may change the growth patterns such as an economic boom which could change growth patterns. Moreover, the consultant has assumed the rates of homeownership will continue to increase as per historical trends. The reader is advised that this study is a high-level projection of population, employment and dwellings estimates and should be treated as such.
P a g e | 10

2. Demographic Analysis

2.1. Demographic Trends

The population of Canada has grown from 30 million residents in 2001 to 36.2 million in 2016.
Over this period, new additions to the population averaged just over 347,000 people per year, or
an average annual rate of 1.1 percent. Net immigration added an average of 232,600 people
annually to the national population, while natural increases added an average of 114,400 people.
These national level trends are primarily driven by low and declining fertility rates and increases
in economic activity and immigration across Canada. Similar to the demographic trends across
the Country, British Columbia’s demographic trends point toward slight declines in birth rates,
slight increases in life expectancy, growing net inter-provincial migration, and increasing net
international migration. These trends are expected to result in steady population growth in the
Province from 4.6 million in 2015 to 5.8 million by 2036, which translates into an annual growth
rate of 1.2 percent during 2016 - 2036 (Projections, BC Stats, July 2016).

As per the Census Canada survey in 2011 the population of the SLRD is graphically depicted
below. Included in the table is a breakdown of age groups, including, the under 15 segment, the
working-age segment between 15 and 64, and the 65 and older segment.

In 2011 the population of the SLRD was 39,263, with 23 percent in the under 15 age segment,
74 percent in the 15 and 64 age segment and 9 percent in the 65 and older segment. 27,661
people or 70 percent of the Region population resides in Squamish and Whistler. The more rural
areas, such as Lillooet and the Electoral Areas, have a high concentration of the 65 and older
segment with the exception of Electoral Area C. The working-age segments are more prevalent
in the southern areas, Whistler having the highest concentration, followed by Pemberton,
Electoral Area D and Electoral Area C. Overall the prevalance of the under 15 segment is most
concentrated in Squamish with 27 percent, Pemberton with 27 percent, Lillooet with 23 percent
and Electoral Area C with 25 percent.
P a g e | 11

                                                                                                         Electoral Area
                                       SLRD    Squamish      Whistler Pemberton      Lillooet    A        B         C          D
             Under 15                    6,779    3,405        1,229        500            357    20        51        301       112
Population 15-64                        29,130   12,561        8,369      1,852          1,562   147       240       1203       633
Distribution 65 +                        3,354    1,689          508         66            454    56        71        153       107
             Total                      39,263   17,655       10,106      2,418          2,373   223       362       1657       852
             Under 15                      23%      27%          15%        27%            23%   14%       21%       25%       18%
% Share      15-64                         74%      71%          83%        77%            66%   66%       66%       73%       74%
             65 +                           9%      10%            5%        3%            19%   25%       20%        9%       13%
Table 1: Population comparison of areas within Squamish Lillooet Regional District
Source: Urbanics Consultants Ltd. & Census 2011

                                           Population comparison of areas within SLRD, 2011
                          90%

                          80%

                          70%

                          60%
  % of Total Population

                          50%

                          40%

                          30%

                          20%

                          10%

                          0%
                                SLRD   Squamish   Whistler    Pemberton   Lillooet       A           B         C              D

                                                             Under 15     15-64      65 +

Figure 2: Population comparison of areas within Squamish Lillooet Regional District
Source: Urbanics Consultants Ltd. & Census 2011

Historical population growth between 1996 and 2011 in all areas of the Region is displayed in the
table below. The SLRD grew from 29,401 people in 1996 to 39,263 by 2011, at an average annual
growth rate of 2.2 percent – a total increase of 9,862 people or 657 people per year.

All municipalities experienced growth over the study period. Squamish had the highest overall
growth of 3,661, or an average annual increase of 1.7%, and Whistler had a total increase of
P a g e | 12
2,934 or an average annual increase of 2.7% between 1996 and 2011. During the same period,
Pemberton had the highest average growth at 12.2% and a population expansion of 1,563.
The electoral areas incurred a range of population changes with Electoral Area A and Electoral
Area B experiencing negative average annual rates of -1.3 percent and -1.9 percent and Electoral
Area C and Electoral Area D experiencing positive average annual growth of 0.5 percent and 2.2
percent. Overall the greatest increase occurred in Electoral Area D where the population grew by
208 people or 14 per year. The district with the largest decline was Electoral Area B which
decreased by 145 residents or 10 per year.
Population Annual % Annual % Annual % Average %
Areas in
1996 2001 2006 2011 Change Change Change Change Change
the SLRD
1996-11 1996-01 2001-06 2006-11 1996-11
SLRD 29,401 33,011 35,225 39,263 9,862 2.5% 1.3% 2.3% 2.2%
Squamish 13,994 14,247 14,949 17,655 3,661 0.4% 1.0% 3.6% 1.7%
Whistler 7,172 8,896 9,248 10,106 2,934 4.8% 0.8% 1.9% 2.7%
Pemberton 855 1,637 2,192 2,418 1,563 18.3% 6.8% 2.1% 12.2%
Lillooet 1,988 2,886 2,741 2,373 385 9.0% -1.0% -2.7% 1.3%
EA A 277 223 207 223 -54 -3.9% -1.4% 1.5% -1.3%
EA B 507 428 575 362 -145 -3.1% 6.9% -7.4% -1.9%
EA C 1,547 1,504 1,887 1,657 110 -0.6% 5.1% -2.4% 0.5%
EA D 644 750 839 852 208 3.3% 2.4% 0.3% 2.2%
Table 2: Population comparison of areas within Squamish Lillooet Regional District, 1996-2011
Source: Urbanics Consultants Ltd., Census 1996, 2001, 2006 & NHS 2011
Graphically depicted below are the population rates in the Region between 1996 and 2011. The
average annual growth rates for the fifteen-year period are displayed by the red dotted line,
whereas the average annual growth rates are depicted by the bars.P a g e | 13
Population growth rates, 1996 - 2011
20.0% 14.0%
12.2% 12.0%
15.0%
10.0%
Average Annual Growth Rate
Average 15 Year Change
10.0% 8.0%
6.0%
5.0%
2.7% 4.0%
2.2%
0.0% 2.2% 2.0%
SLRD Squamish Whistler Pemberton Lillooet A B C D
1.7% 1.3% 0.5% 0.0%
-5.0%
-1.3% -2.0%
-1.9%
-10.0% -4.0%
Annual % Change 1996-01 Annual % Change 2001-06
Annual % Change 2006-11 Average % Change 1996-11
Figure 3: Population growth rates all areas within Squamish Lillooet Regional District, 1996-2011
Source: Urbanics Consultants Ltd. & Census 1996, 2001, 2006 & 2011P a g e | 14
2.2. Population Projections
The following section will describe the population projections that were undertaken using the
Cohort Component method for the study period between 2016 and 2036. The Cohort Component
method uses varying rates of fertility, mortality and migration rates to estimate population growth
– three different growth scenarios were undertaken. The table below provides a summary of the
three population growth scenarios.
Avg. Annual
Population Projections 2001 2006 2011 2016* 2021* 2026* 2031* 2036* Growth Rate
2011-2036
Census Population Counts 33,010 36,239 39,263 42,795
High Growth Scenario 46,702 50,630 54,583 58,400
(annual growth rate) (1.8%) (1.7%) (1.6%) (1.4%) 1.6%
Medium Growth Scenario 46,598 50,234 53,721 56,864
(annual growth rate) (1.8%) (1.6%) (1.4%) (1.2%) 1.5%
Low Growth Scenario 46,337 49,384 51,949 53,834
(annual growth rate) (1.7%) (1.3%) (1.0%) (0.7%) 1.2%
Table 3: Population Projection, Three Scenarios for Squamish Lillooet Regional District, 2016-2036
Source: Urbanics Consultants Ltd. & Census 2006 & 2011
High Growth Scenario: In the high growth scenario, the SLRD is expected to incur population
growth throughout the study period. The high growth scenario assumes three things: fertility rates
will remain constant averaging 1.9 births per female, mortality rate will gradually decrease and
population migration numbers will gradually increase (from a net annual inflow of about 2,400
people in 2016 to a net annual inflow of about 2,700 people in 2036). In the high growth scenario,
the population of the SLRD is expected to grow from 42,795 in 2016 to 58,400 in 2036 at an
average annual growth rate of 1.6 percent.
Medium Growth Scenario: The medium growth scenario also suggests population growth for
the SLRD throughout the study period. This scenario is expected to be the most likely scenario
as the fertility and mortality rates align more closely with historic trends. Fertility rates will incur a
slight decrease dropping from an average of 1.9 births per female to 1.8 and assumes the
mortality rate will decrease. Additionally, it is assumed there will be a steady influx of migration (a
net inflow of about 2,300 people throughout the study period). In the medium growth scenario,
the population of the SLRD is expected to grow from 42,795 in 2016 to 56,864 in 2036 at an
annual rate of 1.5 percent.P a g e | 15
Low Growth Scenario: In the low growth scenario, the population of the SLRD is expected to
increase from 42,795 in 2016 to 53,834 in 2036, an annual growth rate of 1.2 percent. The low
growth scenario is based on a decrease of the fertility rate, mortality rates decreasing and a
decrease of migration from about 2,000 in 2016 to about 1,400 in 2036.
2.2.1. Summary of the three growth scenarios:
The graph and table below summarize the results of the three growth scenarios. The population
projections provide the likely path of population growth in the Region and can provide valuable
information for evaluating long term employment and housing goals. According to this study the
population of the Region is expected to grow in all three of the scenarios.
Population growth scenarios SLRD, 2001-2036 58,400
59,000
56,864
53,834
54,000
49,000
Number of People
44,000 42,795
39,263
39,000
36,239
33,010
34,000
29,000
2001 2006 2011 2016* 2021* 2026* 2031* 2036*
Historic High Growth Scenario Medium Growth Scenario Low Growth Scenario
Figure 4: Population Projection, Three Scenarios for Squamish Lillooet Regional District, 2001-2036
Source: Urbanics Consultants Ltd. & Census 2006 & 2011P a g e | 16
Cohort Component Method Components 2016-21 2021-26 2026-31 2031-36 Average
High Growth Scenario Births 2,778 3,074 3,338 3,615 3,201
Deaths 1,280 1,663 2,013 2,544 1,875
Natural Increase 1,498 1,411 1,325 1,071 1,326
Migration 2,409 2,517 2,629 2,745 2,575
Net Growth 3,907 3,928 3,954 3,816 3,901
Medium Growth Scenario Births 2,778 2,999 3,189 3,371 3,084
Deaths 1,280 1,668 2,006 2,533 1,872
Natural Increase 1,498 1,332 1,183 838 1,213
Migration 2,304 2,304 2,304 2,304 2,304
Net Growth 3,803 3,636 3,488 3,143 3,517
Low Growth Scenario Births 2,778 2,899 2,974 3,011 2,916
Deaths 1,280 1,657 1,998 2,515 1,862
Natural Increase 1,498 1,242 976 497 1,053
Migration 2,043 1,806 1,588 1,389 1,706
Net Growth 3,542 3,047 2,565 1,885 2,760
Table 4: Population Projection, Three Scenarios with Natural Increase, Migration and Net Growth, 2016-
2036
Source: Urbanics Consultants Ltd. & Census 2006 & NHS 2011
It should also be noted, that these projections rely on historical population trends and assumptions
regarding fertility, mortality and especially migration and cannot account for exogenous or
otherwise unforeseen external factors, such as changes in the Regional, Provincial or
international economy. The main difference between the scenarios is the birth rates, which cannot
be predicted to an exact number and will be dependent on the actions of the population. In
addition, the stronger the Region’s economy, the more migrants will be drawn from Canada and
beyond. This is another variable that was included in the projection with the high growth scenario
experiencing growth in migration, the medium growth scenario experiencing constant migration
and the low growth scenario experiencing a decline in migration. Even minor changes in the
Region’s employment opportunities may significantly alter the overall population and age
distribution.
2.2.2. Implications of Medium Growth Scenario
The medium growth scenario is expected to be the most likely of the three scenarios and thus it
will be used in all further analyses contained herein. The results of the medium growth scenario
reveal several important implications for the Region over the next 20 years. Notably the SLRD
will see a significant increase in population, with the 65 and older segment increasing from 10
percent (4,299) to 17 percent (9,550). The population of the working-age segment will increase
at a less substantial rate but still a notable increase from 73 percent (31,256) to 67 percentP a g e | 17
(37,965). In addition, the percentage of the population in the under 15 segment is expected to
decrease from 17 percent (7,240) to 16 percent (9,349).
These trends indicate the declining share of working-age residents coupled with the increasing
share of the 65 and older segment suggesting that the Region and its major employers will need
to attract new employees, even though the working-age population is projected to rise.
Additionally, the Region will need to be mindful of the care and amenity choices for its increasingly
aging population.
Population distribution medium scenario
80%
70%
60%
% of Total Population
50%
40%
30%
20%
10%
0%
2006 2011 2016 2021 2026 2031 2036
Under 15 15-64 65 +
Figure 5: Population Distribution Medium Scenario, 2001-2036
Source: Urbanics Consultants Ltd. & Census 2006 & NHS 2011P a g e | 18
Medium Growth Scenario 2006 2011 2016* 2021* 2026* 2031* 2036*
Under 15 6,588 6,779 7,240 7,763 8,156 8,764 9,349
15-64 26,935 29,130 31,256 33,071 34,844 36,370 37,965
Population Distribution
65 + 2,716 3,354 4,299 5,764 7,234 8,588 9,550
Total 36,239 39,263 42,795 46,598 50,234 53,721 56,864
Under 15 18% 17% 17% 17% 16% 16% 16%
% Share 15-64 74% 74% 73% 71% 69% 68% 67%
65 + 7% 9% 10% 12% 14% 16% 17%
Table 5: Population Distribution Medium Scenario, 2001-2036
Source: Urbanics Consultants Ltd. & Census 2006 & 2011
The table below displays the projections for each municipality and electoral area within the
Region. As previously stated, the SLRD was projected using the Cohort-Component method,
which projects population growth based on assumptions regarding fertility, mortality and migration
rates. The same method was used to forecast the populations of Squamish and Whistler because
the number of residents is over the threshold that ensures the method is effective. All other areas
in the Region were projected based on historic population growth rates.
The larger municipalities within the Region are expected to carry a constant rate of growth,
averaging approximately 1.5 percent to 1.8 percent. This correlates closely to the rate in which
the SLRD is expected to grow at 1.5 percent. Lillooet and the electoral areas are expected to
have a significantly lower rate of growth and in some cases, decrease in size. Lillooet, Electoral
Area C and Electoral Area D have rates of growth ranging from 0.1 percent to 0.4 percent, which
account for slight increases in the size of the population throughout the study period. Electoral
Area A and Electoral Area B are expected to decrease in size at rates of -0.3 percent and -0.5
percent.
Projected
Annual
Population Projections 2001 2006 2011 2016* 2021* 2026* 2031* 2036*
Growth Rate
2011-2036
SLRD 33,010 35,230 39,263 42,795 46,598 50,234 53,721 56,864 1.5%
Squamish 14,247 15,380 17,655 19,205 20,872 22,509 24,192 25,674 1.6%
Whistler 8,896 9,516 10,106 11,418 12,620 13,678 14,562 15,358 1.8%
Pemberton 1,637 2,192 2,418 2,713 3,043 3,414 3,830 4,297 2.4%
Lillooet 2,886 2,741 2,373 2,404 2,435 2,466 2,498 2,530 0.3%
Area A 223 207 223 220 217 214 212 209 -0.3%
Area B 428 575 362 355 348 342 335 329 -0.4%
Area C 1,504 1,887 1,657 1,665 1,673 1,681 1,689 1,697 0.1%
Area D 750 839 852 870 889 908 928 948 0.4%
Table 6: Population Projections for SLRD, Municipalities and Electoral Areas, 2001-2036
Source: Urbanics Consultants Ltd. & Census 2006 & NHS 2011P a g e | 19
Population projections for SLRD, Squamish, Whistler & Pemberton, 2001-2036
60,000 56,864
53,721
50,234
50,000 46,598
42,795
39,263
40,000
Number of People
35,230
33,010
30,000
25,674
24,192
22,509
20,872
19,205
20,000 17,655
15,380 14,562 15,358
14,247 13,678
12,620
11,418
9,516 10,106
8,896
10,000
3,414 3,830 4,297
2,192 2,418 2,713 3,043
1,637
-
2001 2006 2011 2016* 2021* 2026* 2031* 2036*
SLRD Squamish Whistler Pemberton
Figure 6: Population Projections for SLRD, Squamish, Whistler, and Pemberton 2001-2036
Source: Urbanics Consultants Ltd. & Census 2006 & NH|S 2011
To further breakdown projected population growth, we will now compare more specific age
segments. The chart below displays the total number of people as well as the growth as a
percentage in eight age segments between the study (2016 and 2036).
The segments that are expected to incur the highest percentage of growth are the 75 to 84 age
segment at 281 percent and the 85 and older segment at 243 percent. This further confirms the
fact that the older demographic segments may continue to grow at a rapid rate. It should be noted
that those segments are a minor portion of the overall population. Substantial growth is projected
to occur in the 0 to 14 age segment with an increase of 38 percent and a total of 9,349 and the
65 to 74 age segment with an increase of 164 percent and a total of 5,554. The projection shows
the bulk of the population resides in the “working-age” segments between the ages 15 and 64
which are expected to incur the largest rates of population growth. As such, services such as
education facilities for the younger aged segment and care facilities for the older segment should
be planned to ensure the Region’s needs are met.P a g e | 20
Population growth by age group SLRD, 2011
9,349
8,442
7,560
7,197
6,805
5,554
38
% 19
55 % 67 3,644
% 15 %
%
164
% 283 243
% %
353
0..14 15..24 25..34 45..54 55..64 65..74 75..84 85+
Figure 7: Population Growth by Age Group 2001-2036
Source: Urbanics Consultants Ltd. & Census 2006 & NHS 2011
2.2.3. Review of 2016 Census Data Release
Due to the 2016 Census Canada survey being released soon after the Urbanics report was
published, it is worth reviewing the results of the survey to see if there are any major discrepancy
between Urbanics’ projections and the 2016 census results.
Depicted in the table below, are the projected number of occupied private dwellings and projected
population numbers for the SLRD. As one can see there is minor difference between the
projections and the census data, -0.21% and 0.31%, respectively. The minor discrepancies
between Urbanics’ projections and the Census survey suggests that a revision of the projections
is not warranted.P a g e | 21 SLRD 2016 Occupied Private Dwellings (Projection) 16,381 Occupied Private Dwellings (Census) 16,416 Difference -0.21% Population Projection 42,795 Population Census 42,665 Difference 0.31% Table 7: Difference between Urbanics & Census Canada's dwelling/population projections in 2016 Source: Urbanics Consultants and Census 2016 The 2016 Census survey will release detailed data related to housing and labour in late 2017, October and November, respectively. It is our inclination to not delay finalizing the report until that time as it is in the interest of both the Client and the Consultant to not prolong the completion of the study. Once further data on the housing and labour has been released it would be worthwhile to review the Census survey results which could factor into a employment lands study.
P a g e | 22

3. Economic Base Analysis & Employment Projection

3.1. Regional Economic Outlook

B.C. is expected to display strong population and employment growth over the next decade.
Increased business investment and exports, due to strong demand for B.C. commodities in the
United States, is expected to result in significant growth in employment and demand for housing
and other goods and services. As a result, the provincial economy is projected to increase by 3.0
percent in 2016. In addition, the employment rate in the Province is expected to increase by 2.8
percent in 2016 and 1.3 percent in 2017, while the unemployment rate is expected to fall from 6.1
percent in 2016 to 5.8 percent in 2017. These optimistic expectations for the Province as projected
by the Royal Bank of Canada, particularly in regards to the job market, are expected to result in
a higher demand for owner-occupied housing.

BC Economic Outlook             2012         2013         2014          2015        2016*         2017*
Real GDP                        2.5%         2.1%         3.2%          3.1%         3.0%          1.9%
Employment                      1.6%         0.1%         0.6%          1.2%         2.8%          1.3%
Unemployment                    6.8%         6.6%         6.1%          6.2%         6.1%          5.8%
Retail Sales                    1.9%         2.4%         5.6%          6.0%         5.5%          3.8%
Housing Starts (units)         27,465       27,054       28,356        31,446       40,900        33,500
Consumer Price Index            1.1%        -0.1%         1.0%          1.1%         1.9%          2.2%
Table 8: BC Economic Outlook 2012-2036
Source: Urbanics Consultants Ltd. & Royal Bank of Canada

Below is a chart that shows the total value for all types of building permits in B.C. and the SLRD
over the past five years. Comparing the first nine months of 2016 to 2015, the total value of
building permits increased by 2.3 percent for B.C. and 15.8 percent for the SLRD. As building
permit values relate closely to the demand for employment and investment this is a positive sign
for growth of the Region. Additionally, these figures will bode well for the health of the construction
industry over the coming years.

Total Building Permits                                                                               Y-T-D %
($ 000)                     2011      2012      2013       2014       2015    Jan-Sep 15 Jan-Sep 16 Change
British Columbia         9,249,767 10,759,583 9,976,104 11,076,715 13,125,233 9,775,633    9,997,692    2.3
Squamish Lillooet RD        73,993     86,839   123,055    178,753    237,203   173,580      200,921   15.8
Table 9: BC & SLRD Building Permit Data 2011-2016
Source: Urbanics Consultants Ltd. & BC Statistics
P a g e | 23

3.2. Employment Trends & Projections

The employment section will focus on trends in income growth in the Region between 1991 and
2011, employment growth between 2001 and 2011 and project employment growth from 2011 to
2026.

Graphically depicted below are the median household incomes for the SLRD and municipalities
in the SLRD. The Electoral Areas were not included in our analysis as there was an insufficient
amount of data. As you can see, growth occurred in all areas between the study period of 1991
and 2011 with an increase of 45 percent from $46,026 to $66,903 for the SLRD. Increased
employment opportunities likely contributed to the increase in median household incomes, which
would have positive inclinations for the housing market, in particular the ownership market, which
has incurred increases in the rate of throughout the Region. Steady growth occurred in Squamish
and Lillooet where incomes rose from $49,869 to $73,876 and $38,829 to $63,455 respectively.
Whistler had a large increase from $49,715 to $70,375 which occurred until 2006 followed by a
drop of 10 percent between 2006 and 2011. Pemberton experienced the lowest overall growth
increasing from $56,955 to $57,371.
P a g e | 24

                                      Median household income SLRD, 2011
90,000

80,000
                                            $73,876
                                                                       $70,375
70,000                 $66,903
                                                                                                                  $63,455
                                                                                           $57,371
60,000
                                                                                 $56,955

                                 $49,869              $49,715
50,000
          $46,026

40,000                                                                                               $38,829

30,000

20,000

10,000

     0
                SLRD                  Squamish              Whistler                 Pemberton             Lillooet

                          1991              1996                2001               2006          2011
Figure 8: Median Household Income SLRD, 2011
Source: Urbanics Consultants Ltd., 1991, 1996, 2001, 2006 Census & 2011 NHS

3.2.1. Employment Trends

This section assesses the employment trends in the SLRD. First, the major economic industries
for the Region, Squamish, Whistler and B.C. will be reviewed. Second, the focus will shift to
employment trends that have occurred in those areas over the past ten years (with the exception
of B.C.). Last, projections of employment growth will be undertaken using the Constant-Share
method.

When assessing the various industries, our focus will be on the size of the labour force in particular
industries to gauge how growth has been occurring. The classification of industries will be broken
down by the North American Industry Classification System (NAICS) coding system which
classifies industries as either goods-producing industries such as agriculture, utilities and
construction or services-producing industries such as real estate, arts and public administration.
P a g e | 25
A snapshot of the labour force for Whistler, Squamish, the SLRD and B.C. is shown in the table
below. Squamish, the SLRD and B.C. all have the same share of their labour force in the services-
producing industries (81%) and goods-producing industries (19%) while Whistler is more heavily
concentrated in the services-producing industries (86%) compared to the goods-producing
industries (14%).
From a Regional point-of-view the major economic drivers were: construction (13%); retail trade
(11%); accommodation and food services (15%); and public administration (8%). A notable
difference between the Region’s and B.C.’s labour force is the small share of health care and
social assistance industries (7%) compared to the Province (11%).To summarize industrial
sectors in the Region with a higher share of their labour force compared to the Province and are
expected to be net exporters of goods and services are: construction (13% vs. 8% for B.C.);
administration and support, waste management and remediation (5% vs. 4% for B.C.); real estate
and rental and leasing (3% vs. 2% for B.C.), arts, entertainment and recreation (5% vs. 2% for
B.C.); accommodation and food services (15% vs. 8% for B.C.); and public administration (8%
vs. 6% for B.C).
Employment share by industry, 2011
25%
20%
15%
10%
5%
0%
23 Construction
52 Finance and insurance
71 Arts, entertainment and recreation
53 Real estate and rental and leasing
56 Admin & support, waste mgmt, remed
81 Other services (except public admin)
48-49 Transportation and warehousing
72 Accommodation and food services
31-33 Manufacturing
55 Mgmt of companies and enterprises
41 Wholesale trade
21 Mining, quarrying, and oil/gas extract
61 Educational services
62 Health care and social assistance
91 Public administration
44-45 Retail trade
54 Prof, scientific and technical services
11 Agri, forestry, fishing and hunting
22 Utilities
51 Information and cultural industries
Whistler Squamish SLRD B.C.
Figure 9: Employment Share by Industry, 2011
Source: Urbanics Consultants Ltd., & 2011 CensusP a g e | 26
Total Labour Force Total Share of Labour Force
Industries: B.C.
Whistler Squamish SLRD B.C. Whistler Squamish SLRD B.C.
Total labour force population (15 + years) 6,602 10,337 23,086 2,355,193
Industry - not application 32 143 430 48,963
All Industries 6,570 10,194 22,656 2,306,230 100% 100% 100% 100%
Goods-producing industries 889 1,888 4,317 430,405 14% 19% 19% 19%
11 Agri, forestry, fishing and hunting 53 103 576 61,250 1% 1% 3% 3%
21 Mining, quarrying, and oil/gas extract - 24 155 25,479 0% 0% 1% 1%
22 Utilities 1 48 146 13,242 0% 0% 1% 1%
23 Construction 771 1,433 2,964 181,567 12% 14% 13% 8%
31-33 Manufacturing 64 280 476 148,867 1% 3% 2% 6%
Services-producing industries 5,681 8,306 18,339 1,875,825 86% 81% 81% 81%
41 Wholesale trade 47 188 361 90,601 1% 2% 2% 4%
44-45 Retail trade 642 1,335 2,537 266,338 10% 13% 11% 12%
48-49 Transportation and warehousing 171 447 821 118,716 3% 4% 4% 5%
51 Information and cultural industries 180 178 451 62,271 3% 2% 2% 3%
52 Finance and insurance 158 315 600 91,831 2% 3% 3% 4%
53 Real estate and rental and leasing 370 278 766 54,874 6% 3% 3% 2%
54 Prof, scientific and technical services 392 727 1,330 179,412 6% 7% 6% 8%
55 Mgmt of companies and enterprises 1 1 2 2,464 0% 0% 0% 0%
56 Admin & support, waste mgmt, remed 412 403 1,135 98,932 6% 4% 5% 4%
61 Educational services 270 655 1,350 167,930 4% 6% 6% 7%
62 Health care and social assistance 235 945 1,631 249,099 4% 9% 7% 11%
71 Arts, entertainment and recreation 472 413 1,150 56,955 7% 4% 5% 2%
72 Accommodation and food services 1,706 1,172 3,394 179,681 26% 11% 15% 8%
81 Other services (except public admin) 276 596 1,071 112,790 4% 6% 5% 5%
91 Public administration 349 653 1,740 143,931 5% 6% 8% 6%
Table 10: Employment Share by Industry, 2011
Source: Urbanics Consultants Ltd., & 2011 Census
3.2.2. Employment Trends SLRD
Next trends in the total labour force for the Region between 2001 and 2011 will be reviewed. Over
that period the labour force increased by a total of 2,656 workers or 266 per year. The services-
producing industries kept steady as a percentage of the entire labour force between 79 percent
and 81 percent and increasing by a total of 2,054 workers. The goods-producing industries
remained steady as well added a total of 382 workers.
Four industry sectors realized significant gains including: construction that rose from 9 percent to
13 percent; retail trade that rose from 10 percent to 11 percent; professional, scientific and
technical services that rose from 4 percent to 6 percent; and public administration that rose from
6 percent to 8 percent. The most notable of those increases occurred in the construction segment
that increased by a total of 1,164 workers. Industries that experienced a decline in the size of
labour force included: agriculture, forestry, fishing and hunting that decreased from 5 percent to
3 percent; manufacturing decreased from 5 percent to 2 percent; transportation and warehousing0%
5%
25%
10%
15%
20%
11 Agri, forestry, fishing and hunting
21 Mining, quarrying, and oil/gas extract
22 Utilities industrial segments.
23 Construction
31-33 Manufacturing
41 Wholesale trade
44-45 Retail trade
48-49 Transportation and warehousing
2001
51 Information and cultural industries
52 Finance and insurance
2006
53 Real estate and rental and leasing
54 Prof, scientific and technical services
Figure 10: Share of Labour Force by Industry SLRD, 2001-2011
2011
55 Mgmt of companies and enterprises
Source: Urbanics Consultants Ltd., 2001, 2006 Census & 2011 NHS
56 Admin & support, waste mgmt, remed
61 Educational services
Share of labour force by industry SLRD, 2011-2011
62 Health care and social assistance
71 Arts, entertainment and recreation
72 Accommodation and food services
81 Other services (except public admin)
91 Public administration
and food servicing segment that lost 671 workers and manufacturing that lost 554 workers.
Overall, the Region’s employment base grew substantially and diversified in it’s concentration of
decreased from 6 percent to 4 percent; and accommodations and food services decreased from
20 percent to 15 percent. The most notable of those decreases occurred in the accommodations
P a g e | 27P a g e | 28
Employment by Industry Employment Distribution %
Industries: SLRD
2001 2006 2011 2001 2006 2011
Total labour force (15 + years), by industry 20,430 22,195 23,086
Industry - not applicable 225 220 430
All industries 20,205 21,970 22,656 100% 100% 100%
Goods - producing industries 3,935 4,595 4,317 19% 21% 19%
11 Agri, forestry, fishing and hunting 930 780 576 5% 4% 3%
21 Mining, quarrying, and oil/gas extract 80 130 155 0% 1% 1%
22 Utilities 95 120 146 0% 1% 1%
23 Construction 1,800 2,755 2,964 9% 13% 13%
31-33 Manufacturing 1,030 810 476 5% 4% 2%
Services - producing industries 16,285 17,365 18,339 81% 79% 81%
41 Wholesale trade 215 370 361 1% 2% 2%
44-45 Retail trade 2,000 2,110 2,537 10% 10% 11%
48-49 Transportation and warehousing 1,275 830 821 6% 4% 4%
51 Information and cultural industries 365 345 451 2% 2% 2%
52 Finance and insurance 360 535 600 2% 2% 3%
53 Real estate and rental and leasing 530 645 766 3% 3% 3%
54 Prof, scientific and technical services 895 1,270 1,330 4% 6% 6%
55 Mgmt of companies and enterprises 10 30 2 0% 0% 0%
56 Admin & support, waste mgmt, remed 995 1,245 1,135 5% 6% 5%
61 Educational services 1,050 1,245 1,350 5% 6% 6%
62 Health care and social assistance 1,355 1,410 1,631 7% 6% 7%
71 Arts, entertainment and recreation 1,225 805 1,150 6% 4% 5%
72 Accommodation and food services 4,065 4,395 3,394 20% 20% 15%
81 Other services (except public admin) 745 945 1,071 4% 4% 5%
91 Public administration 1,200 1,185 1,740 6% 5% 8%
Table 11: Share of Labour Force by Industry SLRD, 2001-2011
Source: Urbanics Consultants Ltd., 2001, 2006 Census & 2011 NHS
3.2.3. Employment Projection SLRD
Next will be a projection of employment growth for the Region’s labour force between 2011 and
2026. This projection is based on the Constant-Share method, which uses projected employment
trends for a larger Region and applies them to a smaller area of focus – in this case B.C. and the
SLRD. As there were not enough data points to use the Shift-Share method, the more accurate
projection method is the Constant-Share approach. The employment trends projections used for
this report are the Canadian Occupational Projection System (COPS) report that projects
employment growth for each industry segment over the next fifteen years.
As per the COPS employment projections, it is estimated that the total labour force in B.C. will
increase on an annual basis by 1.8 percent between 2011 and 2016, 1.5 percent between 2016
and 2021 and 1.2 percent from 2021 to 2026. Applying those forecasts to the Region, we estimate
the total labour force will grow by 5,442 workers.P a g e | 29
The goods-producing industries are expected to incur strong growth between 2011 and 2016 at
a rate of 2.3 percent and slow in the proceeding 5-year segments with 0.7 percent and 0.1 percent
growth rates. Overall the goods-producing industries are projected to add a total 603 workers.
The construction industry is expected to increase at the fastest rate by 398 workers during the
study period to a total of 3,362 workers and manufacturing by 129 workers to a total of 605.
The services-producing industries are expected to maintain steady growth throughout the study
period adding a total of 4,839 workers. The growth rate is expected to be 2.3 percent between
2011 and 2016, 1.3 percent between 2016 and 2021 and 1.3 percent between 2021 and 2026.
Steady increases are projected to occur in the following industries: wholesale trade; retail trade;
real estate, rental and leasing; professional scientific and technical services; educational services;
health care and social assistance; arts entertainment and recreation; and accommodation and
food services.
Employment Growth Rates
Employment by Industry
(average annual %)
Industries: SLRD
2011 2016 2021 2026 2011-2016 2016-2021 2021-2026
Total labour force (15 +), by industry 23,086 25,182 27,046 28,632 1.8% 1.5% 1.2%
Industry - not applicable 430 469 504 533
All industries 22,656 24,713 26,543 28,098
Goods - producing industries 4,317 4,718 4,872 4,920 2.3% 0.7% 0.1%
11 Agri, forestry, fishing and hunting 576 587 614 590 0.4% 0.9% -0.8%
21 Mining, quarrying, and oil/gas extract 155 138 152 157 -2.3% 1.9% 0.7%
22 Utilities 146 205 206 206 7.0% 0.1% 0.0%
23 Construction 2,964 3,182 3,295 3,362 1.4% 0.7% 0.4%
31-33 Manufacturing 476 605 605 605 4.9% 0.0% 0.0%
Services - producing industries 18,339 19,995 21,670 23,178 2.3% 1.3% 1.3%
41 Wholesale trade 361 379 405 436 1.0% 1.3% 1.5%
44-45 Retail trade 2,537 2,718 2,957 3,169 1.4% 1.7% 1.4%
48-49 Transportation and warehousing 821 837 884 920 0.4% 1.1% 0.8%
51 Information and cultural industries 451 452 492 546 0.0% 1.7% 2.1%
52 Finance and insurance 600 642 669 710 1.3% 0.9% 1.2%
53 Real estate and rental and leasing 766 889 972 1,032 3.0% 1.8% 1.2%
54 Prof, scientific and technical services 1,330 1,535 1,678 1,816 2.9% 1.8% 1.6%
55 Mgmt of companies and enterprises 2 3 3 4 10.6% 1.0% 0.8%
56 Admin & support, waste mgmt, remed 1,135 1,266 1,331 1,385 2.2% 1.0% 0.8%
61 Educational services 1,350 1,485 1,538 1,641 1.9% 0.7% 1.3%
62 Health care and social assistance 1,631 1,831 1,992 2,232 2.3% 1.7% 2.3%
71 Arts, entertainment and recreation 1,150 1,283 1,389 1,482 2.2% 1.6% 1.3%
72 Accommodation and food services 3,394 3,524 3,929 4,212 0.8% 2.2% 1.4%
81 Other services (except public admin) 1,071 1,151 1,174 1,209 1.4% 0.4% 0.6%
91 Public administration 1,740 2,000 2,257 2,384 2.8% 1.0% 1.1%
Table 12: Labour Force Projection SLRD, 2011-2026
Source: Urbanics Consultants Ltd., 2001, 2006 Census & 2011 NHSYou can also read