Portfolio Reports Guide Managed Portfolio Service - Craigs Investment Partners

Page created by Kenneth Wallace
 
CONTINUE READING
Portfolio Reports Guide Managed Portfolio Service - Craigs Investment Partners
Portfolio Reports Guide
Managed Portfolio Service
Portfolio Reports Guide Managed Portfolio Service - Craigs Investment Partners
Portfolio Summary
The Portfolio Summary Report contains summary information of the Portfolio as follows:

Contribution Summary                                                                                                                                                                                              Asset Allocation
                                                                                     PORTFOLIO SUMMARY
A summary of all cash/securities                                                                                                                                                                                  Represents each asset
                                                 CONTRIBUTION SUMMARY                                                                                    ASSET ALLOCATION
received into or paid out of the                 Reporting Currency: NZ Dollar                                                                                                                                    sector as a percentage of the
portfolio. All values are reported                From 06/06/07 To 30/06/13
                                                                                                                                                                                   54% Fixed Interest             Portfolio’s total market value.
in the reporting currency, selected   Portfolio Value on 06/06/2007             3,000,000.00
                                                                                                                                                                                   9% Property-NZ/Aust
                                      Contributions                                      0.00
by the client for the report pack.    Withdrawals                              (1,000,000.00)                                                                                      15% NZ Equities
The exchange rates used in this       Transfers In                                       0.00
                                                                                                                                                                                   16% Australian Equities
summary, are those that were          Transfers Out
                                      Net Contributions
                                                                                         0.00
                                                                                 2,000,000.00
applicable on the trade date of                                                                                                                                                    4% International Equities

each transaction for a security.      PORTFOLIO VALUE ON 30/06/2008              3,032,048.54                                                                                      2% Cash
                                                                                                                                                                                                                  Comparison with Target
                                               INCOME FORECAST (GROSS)
                                                                                                                                                                                                                  Illustrates the target asset
                                                                                                                                     COMPARISON WITH TARGET
                                                Based On Holdings At: 30/06/13
                                                                                                  60%                                                                                                             sector allocation for your
                                                                      Estimated Annual            50%                                                                                                             portfolio compared with the
                                      Asset Class                             Income $    Yield
                                      SUPERVISED ASSETS                                           40%                                                                                                             actual asset sector allocation
Portfolio Value on xx/xx/xxxx         Fixed Interest                           142,638     8.80   30%                                                                                                             within your portfolio, based on
                                      Property                                   27,768   10.46   20%                                                                                                             the holdings at report date.
The initial value of the portfolio    Equities                                  53,005     4.96
                                                                                                  10%
                                      Cash                                        3,859    6.83
at the inception date.                TOTAL Supervised Assets                  227,270     7.55   0%
                                                                                                        Fixed Interest   Property-      Property-     Property-   NZ Equities   Australian International   Cash
                                                                                                                         NZ/Aust      International     Direct                   Equities     Equities

Contributions                         TOTAL PORTFOLIO                         227,270      7.55
                                                                                                                             Percentage of Total Portfolio                       Target Portfolio

The report currency value of all
new cash received in the period.
Withdrawals                                              Income Forecast (Gross)
The report currency value of all                         An estimate of the pre-tax annual income for each asset class. Income is
cash withdrawn in the period.                            generally based on gross historical dividends for the previous 12 months and
                                                         may include special dividends that are of a one-off nature. Dividend forecasts
Transfers In                                             may be used for some New Zealand and Australian shares. It is assumed
The report currency value of all                         that securities that mature during the period will be placed on call, at the
new securities transferred into                          prevailing cash management rate. The estimate is provided as a guide to
the portfolio in the period.                             future dividend and income flows based on the holdings as at report date and
                                                         should not be interpreted as an accurate forecast of future dividend flows.
Transfers Out
                                                         Holdings are grouped into two types:
The report currency value of
                                                         Supervised Assets
all securities transferred out of
                                                         Those holdings fully monitored by Craigs Investment Partners.
the portfolio in the period.
                                                         Unsupervised Assets
Net Contributions                                        Those holdings included as part of the portfolio, for reference only, but not
                                                         monitored by Craigs Investment Partners.
The Total Value of Net
Contributions received in
the period calculated by
summing Portfolio Value +
Contributions – Withdrawals +
Transfers In – Transfers Out.

Portfolio Value on xx/xx/xxxx
The total value of the portfolio in
reporting currency at the end of
period as reported as the Total
Portfolio Market Value on the
Statement of Holdings Report.

PLEASE NOTE: The figures and graphs included in this guide are for illustrative purposes only.                                            MPS Portfolio Reports Guide 05.17/ 02
Time Weighted Returns
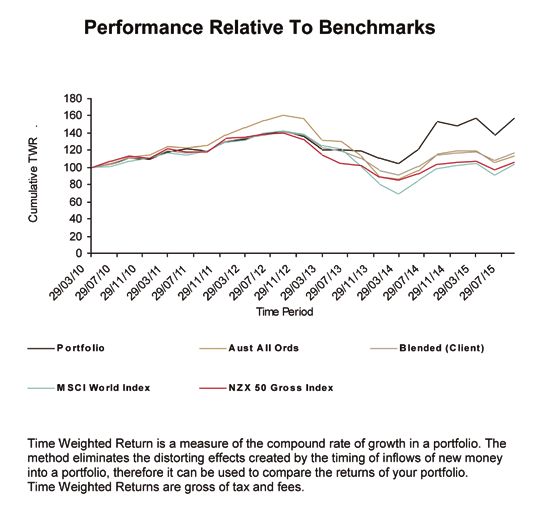
The Time Weighted Rate of Return Report provides a summary of the movements in the portfolio and derives a return for the portfolio
suitable for comparing with benchmarks. Time Weighted Returns (TWRs) measure the compound rate of return for a portfolio over a
given period and are used to measure the growth of an investment portfolio, calculated on a time weighted basis rather than a money
weighted basis. TWRs are compared to the performance of a benchmark, such as market indices or to the performance of other funds
to show whether the portfolio is out-performing or underperforming the alternative, based on the investments made rather than the
timing of the investments.

Capital Value                                                                           Time Weighted Returns                                        Tax
                                                                         For Period   For Period   Since
The value of the portfolio at the                                        From         From         Inception                                         The report currency value
                                        PORTFOLIO VALUE ON               30/06/2015   30/09/2014   29/03/2010
start of the reporting period.          Capital Value                    124,304      179,112      161,663      Performance Relative To Benchmarks
                                                                                                                                                     of all tax paid from the
This will be the same as the            Accrued Interest                 0            0            0                                                 portfolio in the period.
capital value at the close of the        Capital

previous reporting period.                Contributions
                                          Withdrawals
                                                                         0
                                                                         0
                                                                                      0
                                                                                      (38,500)
                                                                                                   14,839
                                                                                                   (102,240)
                                                                                                                                                     Fees
                                          Tax                            (241)        (1,107)      (17,222)
                                                                                                                                                     The report currency value
Accrued Interest                          Fees                           (310)        (1,168)      (7,610)
                                          Transfers In
                                          Transfers Out
                                                                         0
                                                                         0
                                                                                      0
                                                                                      0
                                                                                                   7,718
                                                                                                   0
                                                                                                                                                     of all fees paid from the
The interest accrued on all holdings                                                                                                                 portfolio in the period.
                                          Realized Gains                 1,412        (2,151)      14,846
at the start of the reporting period.      Realized Price Gains          932          (3,083)      14,287
                                           Realized FX Gains             480          932          559                                               Transfers In
Contributions                             Unrealized Gains
                                           Unrealized Price Gains
                                                                         16,421
                                                                         17,413
                                                                                      240
                                                                                      696
                                                                                                   12,091
                                                                                                   14,909                                            The report currency value of
The report currency value of               Unrealized FX Gains           (991)        (456)        (2,818)                                           all new securities transferred
all new cash received in the             Income                                                                                                      into the portfolio in the
period as reported on the                 Interest
                                          Dividends
                                                                         17
                                                                         782
                                                                                      71
                                                                                      5,889
                                                                                                   14,057
                                                                                                   44,243
                                                                                                                                                     period as reported on the
Contribution Summary.                     Change in Accr Int             0            0            0                                                 Contribution Summary.
                                        CAPITAL VALUE ON 30/09/2015      142,385
                                        ACCRUED INTEREST ON 30/09/2015   0
Performance
                                                       Price TWR                15.34%    2.09%   60.15%

Withdrawals                                            FX TWR
                                                       Total TWR
                                                                                (0.40%)
                                                                                15.02%
                                                                                          0.52%
                                                                                          2.97%
                                                                                                  (2.09%)
                                                                                                  57.76%                                               Transfers Out
The report currency value of all cash                 Annualised Return
                                                                                                                                                       The report currency value
                                                       Price TWR                -         -       8.93%
withdrawn in the period as reported                    FX TWR                   -         -       (0.38%)                                              of all securities transferred
on the Contribution Summary.                           Total TWR                                  8.63%
                                                                                                                                                       out of the portfolio in the
                                                                                                                                                       period as reported on the
Realised Gains                                                                                                                                         Contribution Summary.
The report currency value of all Realised
Gains as a result of the sale of holdings in
the period. Realised Gains are split between
Realised Price Gains and Realised FX Gains.                                     Unrealised Gains                Unrealised Price Gains                 Unrealised FX Gains
Realised Price Gains                                                            The unrealised gain/loss        The report currency value of           The report currency value of
                                                                                for all holdings calculated     all Unrealised Price Gains for         all Unrealised FX Gains for the
The report currency value of all Realised Price Gains in                        as the difference between       the period. Unrealised Price           period. Unrealised FX Gains are
the period. Realised Price Gains are calculated as the                          the Total Cost and Market       Gains are calculated as the            calculated as the movement
movement in price between the purchase price for a                              Value (excluding accrued        movement in price between              in exchange rate between
holding and the price that the holding was sold at. The                         interest) in reporting          the purchase price for a holding       exchange rates between the
purchase price will be an average purchase price where                          currency. Unrealised            and the price at the date of the       date the holding was purchased
the holding is made up of more than one purchase.                               Gains are split between         report. The purchase price will        and the date of the report. The
                                                                                Unrealised Price Gains and      be an average purchase price           purchase exchange rate will
Realised FX Gains                                                               Unrealised FX Gains.            where the holding is made up           be an average exchange rate
The report currency value of all Realised FX Gains                                                              of more than one purchase.             where the holding is made up
in the period. Realised FX Gains are calculated                                                                                                        of more than one purchase.
as the movement in exchange rate between
the exchange rate for the purchase date of the                                  Performance of the portfolio is reported over three reporting periods:
holding and the exchange rate at the date the                                   - Performance since inception of the portfolio
holding was sold. The purchase date exchange
rate will be an average exchange rate where the                                 - Performance for the previous 12 months
holding is made up of more than one purchase.                                   - Performance for the previous quarter

PLEASE NOTE: The figures and graphs included in this guide are for illustrative purposes only.                                                     MPS Portfolio Reports Guide 05.17/ 04
Statement of Holdings
The Statement of Holdings Report details all holdings at the reporting date. All values are reported in the reporting currency for the
portfolio report and are calculated using the reporting date exchange rate as displayed at the end of the report. Positions are reported
on a trade date basis and are grouped by asset sector and country of risk (New Zealand, Australia or International). Fixed interest
holdings are reported by maturity date and all other holdings are reported in alphabetical order within each country of risk.

Security                                                                                    STATEMENT OF HOLDINGS                                                                                                        Market Value (incl AI)
                                                                                                                                                                                  NZ Dollar
The full name of the holding.                                                                                                                                           Market                                           The market value is calculated
                                     Security
                                                                                Coupon
                                                                                 Rate % Maturity Date   Security Type    Quantity
                                                                                                                                    Unit Cost
                                                                                                                                        Local
                                                                                                                                                Price
                                                                                                                                                Local
                                                                                                                                                         Total Cost
                                                                                                                                                          (Capital)
                                                                                                                                                                         Value
                                                                                                                                                                      (incl AI)
                                                                                                                                                                                  Unrealised
                                                                                                                                                                                  Gain/Loss
                                                                                                                                                                                                      Pct.
                                                                                                                                                                                                  Assets %
                                                                                                                                                                                                              Accrued
                                                                                                                                                                                                              Interest   by multiplying the quantity of a
Coupon Rate %                        SUPERVISED ASSETS
                                     FIXED INTEREST
                                                                                                                                                                                                                         security held in your portfolio by
The current coupon rate for
                                     NEW ZEALAND
                                                                                                                                                                                                                         the Price Local. This is converted
fixed interest holdings. For cash
                                      CIPIML Defined Portfolio Fixed Interest
                                      Rabobank Nederland NZ Bonds                  5.47 19/04/2018
                                                                                                        Unit Trust
                                                                                                        Corporate Bond
                                                                                                                            9,831
                                                                                                                          10,000
                                                                                                                                         1.01
                                                                                                                                     100.50
                                                                                                                                                  1.07
                                                                                                                                                101.34
                                                                                                                                                             9,938
                                                                                                                                                           10,050
                                                                                                                                                                        10,513
                                                                                                                                                                        10,381
                                                                                                                                                                                         575
                                                                                                                                                                                          84
                                                                                                                                                                                                     2.36
                                                                                                                                                                                                      2.33
                                                                                                                                                                                                                    0
                                                                                                                                                                                                                  247
                                                                                                                                                                                                                         into report currency, using the
holdings this is the interest rate    ANZ National Bank Bond                       6.32 18/06/2018      Corporate Bond    10,000      100.83 102.54        10,083      10,435             171         2.35         181   exchange rate effective on the
applicable at reporting date.
                                      TOWER Capital Ltd                           8.50 15/04/2019       Corporate Bond     5,000     100.00 104.66          5,000       5,324            233          1.20          91   reporting date. For Interest
                                      Contact Energy Ltd                          8.00 15/05/2019       Corporate Bond    10,000     100.00 106.46         10,000      10,749           646          2.42         102
                                      Fonterra Co-op Gp Ltd Bonds                  7.75 10/03/2020      Corporate Bond    10,000     100.00 106.78         10,000      10,722           678           2.41         45
                                                                                                                                                                                                                         Bearing Instruments the market
Maturity Date                         Meridian Energy Ltd REBs                      7.15 16/03/2020     Corporate Bond    10,000     100.00 105.43         10,000      10,573           543           2.38         30    value includes the ‘Accrued
                                      The Warehouse Group Ltd Bonds
                                      Greenstone Energy Finance Bonds
                                                                                   7.37 15/06/2020
                                                                                   7.35 15/10/2021
                                                                                                        Corporate Bond
                                                                                                        Corporate Bond
                                                                                                                           5,000
                                                                                                                          10,000
                                                                                                                                     100.00     101.85
                                                                                                                                     100.00 100.00
                                                                                                                                                            5,000
                                                                                                                                                           10,000
                                                                                                                                                                        5,201
                                                                                                                                                                       10,032
                                                                                                                                                                                          92
                                                                                                                                                                                              0
                                                                                                                                                                                                       1.17
                                                                                                                                                                                                      2.25
                                                                                                                                                                                                                  109
                                                                                                                                                                                                                   32
                                                                                                                                                                                                                         Interest’ from the last coupon
The next coupon rate reset date       Trustpower Ltd Senior Bonds                 8.00 15/12/2021       Corporate Bond    10,000     100.00     105.51     10,000      10,586            551          2.38         35    payment date to report date.
or the final maturity date.           Manukau City Council                         6.52 29/09/2022      LA. Bond          10,000     100.00 100.00         10,000      10,004                 0       2.25          4

                                                                                                                                                                                                                         Accrued Interest
Security Type                         TOTAL NEW ZEALAND FIXED INTEREST                                                                                    100,071     104,520          3,574        23.49         875

                                                                                                                                                                                                                         The interest accrued from
The type of holding.                  TOTAL FIXED INTEREST                                                                                                100,071     104,520          3,574        23.49         875
                                                                                                                                                                                                                         the last coupon payment
                                      PROPERTY                                                                                                                                                                           date to the reporting date.
Quantity                                                                                            Percentage Assets %
The total holding at reporting date.                                                                The percentage of the
                                                                                                    portfolio that each holding
Unit Cost Local                                                                                     represents calculated by
The average unit cost in local                                                                      dividing the Market Value of
currency – representing what                                                                        each holding by the Market
you paid per unit for the                               Price Local                                 Value of the Total Portfolio.
holding of this security.                               The market price per unit, as at
*Local currency represents the currency                 close of business on the date of
that the security has been issued in.                   this report - in the local currency.        Unrealised Gain/Loss
                                                                                                    The unrealised gain/loss
                                                                                                    for each holding calculated
                                                        Total Cost (Capital)                        as the difference between
Subtotals and Totals                                                                                the Total Cost and Market
                                                        The total cost of the holding
                                                                                                    Value (excluding Accrued
Subtotals are included for Total                        including brokerage in report
                                                                                                    interest) in reporting currency.
Cost, Market Value, Unrealised                          currency. The exchange rate
                                                                                                    Numbers in ( ) brackets
Gain/Loss, Percentage Assets%                           recorded for each transaction
                                                                                                    represent an unrealised loss.
and Accrued Interest for each                           is used to derive the cost
Asset Sector and Country of                             in report currency.
Risk within an Asset Sector.
Holdings are also totalled by
Supervised Assets or Unsupervised
Assets and Total Portfolio.

PLEASE NOTE: The figures and graphs included in this guide are for illustrative purposes only.   MPS Portfolio Reports Guide 05.17/ 06
Forecast Gross Monthly Income
The Forecast Gross Monthly Income Report is an estimate of the pre-tax monthly income for the next 12 month period for each
holding as at report date.

                                                                                   Forecast Gross Monthly Income
                                                                                            based on holdings at 30/09/2015
                                 Estimated Income in NZ Dollar
                                                                                                                                                                                                     Annual
                                 Security                                          Oct      Nov       Dec       Jan      Feb       Mar       Apr      May       Jun       Jul        Aug     Sep    Income
                                 Goodman Property Trust                                                 95                          95                           95                           95       378
                                 Kiwi Income Property Trust                                           588                                                       588                                    1,176
                                 Air New Zealand Ltd                                                                               610                                                       610      1,220
                                 Auckland International Airport Ltd                 351                                                      351                                                        701
                                 Hallenstein Glasson Ltd                                               616                                                      616                                   1,232
                                 Nuplex Industries Ltd                             283                                                       283                                                       566
                                 Ryman Healthcare Ltd                                                 207                                                       207                                     414
                                 Steel & Tube Holdings Ltd                                                                          175                                                       175      350
                                 QBE Insurance Group Ltd                                                                           355                                                       355        711
                                 Aviva plc                                                  468                                                       468                                              936
                                 BP plc- Sponsored ADRs                                                516                                                       516                                  1,033
                                 CIP Ltd CCM- NZD Call                                3         3        3         3        3         3         3        3         3         3         3        3        38
                                 CIP Ltd CCM- AUD Call                                3         3        3         3        3         3         3        3         3         3         3        3        37
                                 CIP Ltd CCM- GBP Call                                                                                                                                                     1
                                 CIP Ltd CCM- USD Call                                                                                                                                                    0

                                 TOTAL PORTFOLIO                                  640        475    2,028          6        6     1,241     640       475     2,028         6          6    1,241    8,794

                                 - This projection is provided as a guide to future dividend flows and should not be interpreted as an accurate forecast of future dividend flows.
                                 - Income presented in the table is generally based on forecast dividends for securities covered by Craigs Investment Partners Research.
                                 - For other securities, income is generally based on gross historical dividends for the last 12 months, which may include special dividends of a one-off nature.
Income is generally based on gross historical dividends                  Holdings are reported in the same order as on the
                        for the previous 12 months and may include special                       Statement of Holdings Report.
                        dividends that are of a one-off nature. Dividend forecasts
                                                                                                 Annual Income is a total estimated income for each
                        may be used for some New Zealand and Australian
                                                                                                 holding.
                        shares. It is assumed that securities that mature or
                        have a re-set date during the period will be placed                      Totals are included for Total Portfolio for the estimated
                        on call at the prevailing cash management rate. The                      income for each month and Annual Income. The Forecast
                        timing of equal regular instalments is based on the                      Gross Monthly Income Report provides the detail for
                        first payment date, if this is recorded, or the maturity                 the Estimated Annual Income reported on the Income
                        date. Equity distributions made more than once in a                      Forecast (Gross) on the Portfolio Summary Report.
                        year are assumed to be paid in equal instalments at
                        regular intervals based on the last payment date.
                        The estimate is provided as a guide to future
                        dividend and income flows based on the holdings
                        as at report date and should not be interpreted as
                        an accurate forecast of future dividend flows.

PLEASE NOTE: The figures and graphs included in this guide are for illustrative purposes only.                                           MPS Portfolio Reports Guide 05.17/ 08
Income Summary – New Zealand Residents
The New Zealand Residents Income Summary details all income received during the period, grouped by income type, and removing
tax credits not usually available to New Zealand Residents.
It incorporates adjustments that may be needed by some New Zealand taxpayers, depending on their individual circumstances.

                                                                      INCOME SUMMARY – NEW ZEALAND RESIDENTS
                                                                                                for the period 1/07/2015 to 30/09/2015
                                                                    All figures are shown in New Zealand dollars (NZD) and exclude Foreign Tax credits not available to NZ residents (Note 1)

                                                                                                                                                         Other
                                                                                                                         Imputation                      Withold-                                      Approved
                                      Income                                             Gross Amount    Sup Dividend    Credit          NZ RWT          ing Tax         Issuer Expense   Net Amount   Issuer Levy
Gross Amount                          TAXABLE
                                      NZ Interest                                        3,655.32        0.00            0.00            847.77          75.78           0.00             2,731.77     0.00
In contrast to the Income Schedule,   NZ Dividend                                        3,941.47        0.00            1,182.44        118.24          0.00            0.00             2,640.79     0.00

the gross amount in this report       Overseas Dividend                                  5,388.08        0.00            0.00            0.00            21.56           0.00             5,366.51     0.00

excludes Franking Credits and
                                      TOTAL TAXABLE INCOME                               12,984.87       0.00            1,182.44        966.01          97.34           0.00             10,739.07    0.00
                                      Tax Paid Income                                    1,198.30        0.00            359.49          0.00            0.00            0.00             838.81       0.00

UK-ACT. These amounts form the        Excluded Income                                    930.45          0.00            0.00            0.00            0.00            0.00             930.45       0.00

basis of income for NZ tax returns.   TOTAL TAX PAID INCOME                              2,128.75        0.00            359.49          0.00            0.00            0.00             1,769.26     0.00

                                      Deduct: Custodial and Management Fees charged by CIP                                                                               1,931.00                                    Deduct
                                      Deduct: Other Recorded Expenses                                                                                                    0.00

                                                                                                                                                                                                                     Generally tax-deductible
Tax Paid/Excluded Income              Global CV only (Note 4)
                                                                                                                                                                                                                     expenses.
                                      Deduct: Income from Global CV only                 0.00                                                                                             0.00

This income is not usually            Add: NZ RWT and IC
                                      Add: Foreign Witholding Tax (Note 7)
                                                                                                                         0.00            0.00
                                                                                                                                                         0.00
                                                                                                                                                                                          0.00

included in NZ tax returns.           If you report on an FDR basis: (Note 5)
                                      Deduct: Income from Global FDR or CV               (2,045.80)      0.00            0.00            0.00            (21.56)                          (2,024.24)
                                      Add: FIF Income (Note 8)                           10,389.02                                                                                        10,389.02
                                      Add: NZ RWT and IC                                                                 0.00            0.00                                             0.00
                                      Add: Foreign Witholding Tax (Note 7)                                                                               21.56
If you report Financial Arrangements on an accruals basis (Note 6)
                                                       Add: Net Purchase and Sale of Accrued Interest          0.00                                                                                                           0.00

Some clients may need to make                          Add: Net difference between opening and closing         0.00                                                                                                           0.00
                                                                                                                                                                                                                                                                       Footnotes
                                                       If you need to return your PIE income (Note 3)
adjustments to the standard
                                                                                                                                                                                                                                                                       More detailed information on
                                                       Add: PIE Listed Imputed                                 1,198.30                             359.49            0.00                                                    838.81

income. More detailed reports
of Foreign Investment Fund                                                                                                                                                                                                                                             FDR and PIE taxation is available
(FIF) calculations and financial
                                                       • Note 1: Foreign Tax Credits – Australian Franking Credits and UK Advance Corporation Tax will not normally be available to NZ tax residents and have been excluded from this report.                          from your Investment Adviser
                                                       • Note 2: PIE Excluded Distribution – PIE excluded income should not be included in NZ tax returns.

arrangements are available.                            • Note 3: PIE Imputed Distribution – For individuals (including Family Trusts) PIE imputed distributions do not need to be included in tax returns, but can be included if the marginal tax rate of the         or on our website
                                                                                                                                                                                                                                                                       www.craigsip.com.
                                                         income recipient is less than 30%. Zero-rated persons, and persons who have declared a PIR tax rate that is too low must include this PIE income in their return.

Please contact your tax advisor.                       • Note 4: Global CV only – Global CV only is a tax methodology that was created for securities that are specifically treated on a CV basis rather than FDR. These securities are determined by the
                                                         IRD and at the moment include securities with a fixed rate of interest or that have foreign exposures with nz fx contracts. These stocks are included in the deminimus calculation. Securities listed

                                                                                                                                                                                                                                                                       For further clarification we
                                                         here should have the CV figure for these stocks included, rather than the interest coupon payments.
                                                       • Note 5: FIF Investments – If you are a ‘natural person’ and your global share portfolio cost exceeds $50,000 at any stage during the year then the FIF rules apply to you. Family Trusts and other
                                                         entities are taxed under the FIF rules irrespective of the cost of their global share portfolio. The figures calculated assume that the only global assets held by the taxpayer were held in Custodial
                                                         Services Ltd for the entire financial year. If this is not the case, you will need to combine the information in these reports with information from other sources to determine the correct FIF figures.      recommend that you seek
                                                       • Note 6: Financial Arrangements – For taxpayers who report on a “cash basis”, interest received from these plus income from “cash” securities should be reported as NZ Interest income. Some
                                                         entities (like Family Trusts) are required to report interest income from NZ Fixed Interest instruments on an accruals basis. In addition to the cash receipts, these taxpayers must additionally             professional tax advice.
                                                         include purchased, sold and changes in accrued interest as interest income.
                                                       • Note 7: Non-NZ WT (tax credit in IR terminology) can be claimed up to the amount of NZ income tax payable on the FIF income associated with the attributing interest that has paid the
                                                         dividend.
                                                       • Note 8: Assume client is an individual or family trust. If another entity please refer to FDR Summary for correct figure.

PLEASE NOTE: The figures and graphs included in this guide are for illustrative purposes only.                                                                                                                                                                      MPS Portfolio Reports Guide 05.17/ 10
Purchase and Sale
The Purchase and Sale Report summarises trades undertaken during the period of the report, including all security purchases and
sales plus dividend reinvestments, security maturities, company restructures and acquisitions. This report does not include details
of transfers into and out of the portfolio or details of other corporate actions.

                                                                                         PURCHASE AND SALE
                                                                                                                   Local Currency
                                     Transaction                                                      Price Per                                  Amount       Settled NZ Dollar      Accrued
                                     Date               Security                           Quantity       Share   SEC Fee Commission Other Fee     Local     Amount Amount           Interest

Transaction Type                                                                                                                                                                                Other Fee
                                     PURCHASES
Purchases, Sales, Currency           LOCAL CURRENCY OF SECURITY: NZ DOLLAR                                                                                                                      Any other fees paid on the
Purchases, Currency Sales.           SETTLED IN: NZ DOLLAR
                                     04/06/2013        ANZ Callable sub bonds                                                                                                                   transaction.
                                                       (Mat. 2014) 8.5%,
                                                       Due 09/06/2019                         0.00     0.0000        0.00      0.00      0.00        0.00        0.00        0.00       0.00
Local Currency of Security           04/06/2013        ANZ Callable sub bonds
                                                       (Mat. 2014) 8.5%,
                                                                                                                                                                                                Amount Local
                                                       Due 09/06/2019                    100,000.00     0.9862       7.50     493.12     0.00    99,125.02   99,125.02   99,125.02      0.00
The currency that the security                                                                                                                                                                  The net amount in the currency
trades in.                           LOCAL CURRENCY OF SECURITY: US DOLLAR                                                                                                                      the security is traded in.
                                     SETTLED IN: NZ DOLLAR
                                     07/05/2013        Dr Pepper Snapple Grp Inc:
Settled in                                             CBRBY shs
                                                       cancelled & 12:36 DPS US shs
                                                                                                                                                                                                Settled Amount
                                                       purchased, keep NZ$ cost basis
The currency that the transaction                      constant through conversion           124.00    13.5728       0.00      0.00      0.00     1,683.02    4,191.84    4,191.84      0.00    The net amount in the currency
is settled in.                                                                                                                                                                                  the transaction is settled in.
                                     LOCAL CURRENCY OF SECURITY: POUNDS STERLING
                                     SETTLED IN: POUNDS STERLING
Transaction Date                     02/05/2013       Cadbury plc Beverage Shs:
                                                      Cadbury
                                                      Beverage non tradeable shares
The trade date of the transaction.                    received                              374.00      4.4351       0.00      0.00      0.00     1,658.71    1,658.71  4,191.84        0.00
                                     02/05/2013       Cadbury plc: CBRY ord’s received      665.00     6.4904        0.00      0.00      0.00    4,316.09    4,316.09 10,907.48         0.00
SALES
                                                       LOCAL CURRENCY OF SECURITY: NZ DOLLAR
                                                       SETTLED IN: NZ DOLLAR
Security                                               21/04/2013        Rabobank Nederland Perp Cap                                                                                              Accrued Interest
                                                                         Secs, Mat

The full name of the security                          21/04/2013
                                                                         2017 9.482%, Due 08/10/2008
                                                                         Rabobank Nederland Perp Cap
                                                                                                             0.00    0.0000   0.00    0.00    0.00    249.39     249.39     249.39    249.39
                                                                                                                                                                                                  The amount of accrued interest,
or the name of the account                                               Secs, Mat
                                                                         2017 9.482%, Due 08/10/2008    60,000.00    0.9858   7.50   148.50   0.00 58,994.61 58,994.61 58,994.61       0.00       purchased/sold as part of the
for transfers of cash.                                 05/06/2013        HY-FI Securities Ltd CDO 7%,
                                                                         Due 15/08/2008                 100,000.00   0.9875   7.50   496.23   0.00 98,244.14 98,244.14 98,244.14       0.00
                                                                                                                                                                                                  contract. This is converted
                                                       05/06/2008        HY-FI Securities Ltd CDO 7%,                                                                                             to reporting currency using
Quantity                                               13/06/2008
                                                                         Due 15/08/2008
                                                                         JPMF Japanese Inv Tr (NZX)
                                                                                                             0.00
                                                                                                          1,200.00
                                                                                                                     0.0000
                                                                                                                     4.5200
                                                                                                                              0.00
                                                                                                                              7.50
                                                                                                                                      0.00
                                                                                                                                      54.24
                                                                                                                                              0.00
                                                                                                                                              0.00
                                                                                                                                                      498.63
                                                                                                                                                     5,362.26
                                                                                                                                                                 498.63
                                                                                                                                                                5,362.26
                                                                                                                                                                            498.63
                                                                                                                                                                           5,362.26
                                                                                                                                                                                      498.63
                                                                                                                                                                                       0.00
                                                                                                                                                                                                  the exchange rate applicable
The number of shares or amount                                                                                                                                                                    on the trade date of any one
of currency bought/sold.                               LOCAL CURRENCY OF SECURITY: AUSTRALIAN DOLLAR                                                                                              transaction for a security.

Price per Share                                                                                                                                                                                   Reporting Currency Amount

For security transactions this                                                                                                                                                                    The net amount in the reporting
is the price that the securities                                                                                                                                                                  currency of the portfolio.
were bought/sold at. For a                                                                                                                                                                        Refer to FX Gain or Loss for
foreign currency transaction                                                                                                                                                                      an explanation of reporting
this is the exchange rate that the                                                                                                                                                                currency conversion under
currency was bought/sold at.                                                                                                                                                                      heading Time Weighted Returns.

Securities and Exchange                                                                                                                                                                           Commission
Commission Fee (SEC)                                                                                                                                                                              Brokerage paid on the
Exchange fees paid on the                                                                                                                                                                         transaction.
transaction.

PLEASE NOTE: The figures and graphs included in this guide are for illustrative purposes only.                                                                                                 MPS Portfolio Reports Guide 05.17/ 12
Income Schedule
The Income Schedule itemises all income received during the period, grouped by income type and likely tax treatment.

                                                                                                INCOME SCHEDULE
                                                                                                                                                 Reporting Currency: NZD

Taxable                                                                    Income
                                                                                                   Net
                                                                                          Payment Amount                    Sup
                                                                                                                                              Aust.
                                                                                                                                              Franking   UK
                                                                                                                                                                       Other
                                                                                                                                                                       Witholding        Net               Australian Franking
                                                                                                                                                                                                           Credit/UK ACT
                                    Date            Security               Type           Currency (Pmt Curr)    Gross      Div    Imp Credit Credit     ACT    NZ RWT Tax        Mfee   Amount     AIL

Included in New Zealand tax         TAXABLE
                                    NZ INTEREST
returns. Categorises income         FINANCIAL ARRANGEMENTS
                                    16/08/2010    Contact Energy Ltd       Interest       NZD      625.10        1,008.22   0.00   0.00       0.00       0.00   383.12   0.00     0.00   625.10     0.00
                                                                                                                                                                                                           These are not usually available
receipt into New Zealand            18/08/2010    AMP Group Finance        Interest       NZD      1,225.00      1,225.00   0.00   0.00       0.00       0.00   0.00     0.00     0.00   1,225.00   0.00   to New Zealand tax residents.
                                                  Notes
interest, New Zealand Dividend      15/09/2010    Works Finance NZ         Interest       NZD      747.87        1,206.25   0.00   0.00       0.00       0.00   458.38 0.00       0.00   747.87     0.00
                                                  Ltd Bonds
or Overseas Dividend in line with   TOTAL FINANCIAL ARRANGEMENTS                                                 3,439.47   0.00 0.00         0.00       0.00 841.50 0.00         0.00 2,597.97     0.00
Inland Revenue requirements.

Financial Arrangements/Global       GLOBAL FDR OR CV

FDR or CV/Forced CV                 06/07/2010
                                    30/07/2010
                                                    Schlumberger Ltd
                                                    Templeton Emerging
                                                                           Dividend
                                                                           Dividend
                                                                                          USD
                                                                                          GBP
                                                                                                   63.00
                                                                                                   75.00
                                                                                                                90.69
                                                                                                                180.48
                                                                                                                            0.00
                                                                                                                            0.00
                                                                                                                                   0.00
                                                                                                                                   0.00
                                                                                                                                             0.00
                                                                                                                                             0.00
                                                                                                                                                         0.00   0.00
                                                                                                                                                         18.04 0.00
                                                                                                                                                                         0.00
                                                                                                                                                                         0.00
                                                                                                                                                                                 0.00
                                                                                                                                                                                 0.00
                                                                                                                                                                                         90.69
                                                                                                                                                                                         162.44
                                                                                                                                                                                                    0.00
                                                                                                                                                                                                    0.00
                                                    Markets plc (LSE)
Identifies securities which         24/08/2010      Caterpillar Inc        Dividend       USD      65.45        109.11      0.00   0.00      0.00        0.00   0.00     16.37   0.00    92.74      0.00

may require nonstandard             06/09/2010      Australian Foundation Dividend
                                                    Inv Ltd (ASX)
                                                                                          AUD      1,300.00 2,355.58        0.00   0.00      706.67      0.00   0.00     0.00    0.00    1,648.91   0.00

treatment in New Zealand            07/09/2010      Visa Inc Class A
                                    TOTAL GLOBAL FDR OR CV
                                                                          Dividend        USD      21.25        34.65
                                                                                                                2,770.51
                                                                                                                            0.00   0.00
                                                                                                                            0.00 0.00
                                                                                                                                             0.00
                                                                                                                                             706.67
                                                                                                                                                         0.00   0.00
                                                                                                                                                         18.04 0.00
                                                                                                                                                                         5.20
                                                                                                                                                                         21.57
                                                                                                                                                                                 0.00    29.45
                                                                                                                                                                                 0.00 2,024.23
                                                                                                                                                                                                    0.00
                                                                                                                                                                                                    0.00
tax returns requirements.
                                    TOTAL OVERSEAS DIVIDEND                                                     7,191.75    0.00 0.00        1,785.63 18.04 0.00         21.57   0.00 5,366.51      0.00

                                    TOTAL TAXABLE                                                               14,788.54 0.00 1,182.44      1,785.63 18.04 966.01 97.36         0.00 10,739.06 0.00
                                    TAX PAID
                                    PIE LISTED
                                    PIE LISTED
                                    24/08/2010      AMP NZ Office Trust    PIE Listed     NZD      70.00        100.00      0.00   30.00     0.00        0.00   0.00     0.00    0.00    70.00      0.00
                                                                           Distribution
                                    20/09/2010      Rabo Capital Sec       PIE Listed     NZD      768.81       1,098.30    0.00   329.49    0.00        0.00   0.00     0.00    0.00    768.81     0.00
                                                    Ltd PIE Cap Sec        Distribution
                                                    Mat 2049, reset 2014
TOTAL PIE LISTED                          1,198.30   0.00 359.49   1,785.63 0.00 0.00   0.00   0.00 838.81   0.00

Non-Taxable Distributions                              TOTAL PIE LISTED                          1,198.30   0.00 359.49   1,785.63 0.00 0.00   0.00   0.00 838.81   0.00

& Tax Paid Income                                      TOTAL TAX PAID                            1,198.30   0.00 359.49   1,785.63 0.00 0.00   0.00   0.00 838.81   0.00

Does not usually need to                               EXCLUDED INCOME
be included as income for                              PIE LISTED

New Zealand tax purposes and                           PIE LISTED

relates to securities where tax has
been deducted at source. Please
see Income Summary for guidance,
or contact your tax advisor.

Excluded Income
Does not usually need to
be included as income for
New Zealand tax purposes and
relates to income specifically
excluded from New Zealand tax
reporting. Please see Income
Summary for guidance or
contact your tax advisor.

PLEASE NOTE: The figures and graphs included in this guide are for illustrative purposes only.                                                                             MPS Portfolio Reports Guide 05.17/ 14
Transfers and Corporate Actions
The Transfers and Corporate Actions Report shows details of all Corporate Action transactions that have occurred on holdings in
the portfolio during the period, plus any securities which have been transferred in or out of the portfolio.

Transaction Date                                                               TRANSFERS AND CORPORATE ACTIONS                                                                                      Trade Amount
The effective date of the corporate     Transaction Date   Transaction Type     Security                                                      Quantity Trade Amount     Spot Rate   Original Cost
                                                                                                                                                                                                    The trade date value of
action.                                 01/04/2013         Transfer In          smartMIDZ – NZSX MidCap Index Fund: Residual units
                                                                                adjusted after split / consolidation
                                                                                                                                                  0.44          0.00      1.0000
                                                                                                                                                                                                    the holding in reporting
                                        14/04/2013         Transfer In          Sky City Entertainment Group Ltd: SKC Profit distribution
                                                                                plan – Issue price $3.8472935
                                                                                                                                               234.00           0.00      1.0000            0.00
                                                                                                                                                                                                    currency calculated using
Transaction Type                        28/04/2013         Return of Capital    Dairy Equity Limited : DEL NZ 0.50 Return of capital         10,000.00    (5,000.00)      1.0000                    the trade date exchange
                                                           Security             via a repurchase & cancellation of shs

The description of the transaction.     15/05/2013         Transfer In          Mighty River Power (reset 2008, mat 2013) 8.36%,            100,000.00     97,446.66      1.0000     100,000.00     rate between the security
Where the coupon has been reset
                                                                                Due 15/05/2013:
                                                                                MTY010 early repayment reset, rate changed from 7.01%                                                               currency and the reporting
on an Interest Bearing Instrument       15/05/2013         Transfer In
                                                                                to 8.36%.
                                                                                ASB Capital No.2 – Perp RPS reset 15May09 9.03%,            150,000.00    140,550.00      1.0000      154,723.00
                                                                                                                                                                                                    currency of the portfolio.
                                                                                Due 15/05/2009:
there will be a Transfer Out of the                                             ASBPB annual reset, rate changed from 9.11% to 9.03%.
                                        15/05/2013         Transfer Out         Mighty River Power (reset 2008, mat 2013) 7.01%,            100,000.00    (97,446.66)     1.0000                    Spot Rate
holding at the previous coupon                                                  Due 15/05/2008: MTY010 early repayment reset,

rate and a Transfer In of the           15/05/2013         Transfer Out
                                                                                rate changed from 7.01% to 8.36%.
                                                                                ASB Capital No.2 – Perp RPS reset 15May08 9.11%,            150,000.00   (140,550.00)     1.0000                    The trade date exchange
holding at the reset coupon rate.                                               Due 15/05/2008: ASBPB annual reset, rate changed from
                                                                                9.11% to 9.03%.
                                                                                                                                                                                                    rate between the security
                                        23/05/2013         Transfer In          Guinness Peat Group plc (NZX): GPG NZ 1:10 bonus issue,       1,200.00          0.00      1.0000            0.00    currency and the reporting
Security
                                                                                shares issued at nil cost, announced 16 May08
                                                                                                                                                                                                    currency of the portfolio.
The full name of the company for
                                                                                                                                                                                                    Original Cost
security transactions or the name
of the account for transfers of cash.                                                                                                                                                               The original cost of the holding
                                                                                                                                                                                                    in reporting currency calculated
Quantity                                                                                                                                                                                            using the trade date exchange
The number of shares of the                                                                                                                                                                         rate between the security
transaction.                                                                                                                                                                                        currency and the report
                                                                                                                                                                                                    currency of the portfolio.
This will be an average cost
                                                                                                    where the current holding
                                                                                                    comprises more than one
                                                                                                    purchase transaction.

PLEASE NOTE: The figures and graphs included in this guide are for illustrative purposes only.   MPS Portfolio Reports Guide 05.17/ 16
Cash Ledger
The Cash Ledger Report shows all transactions that have settled across the Ledger Account for the Portfolio. Transactions are
reported by date order within a currency.

Transaction Date                                                                              CASH LEDGER                                                                             NZ Dollar Amount
                                                                                                                                                     Local Currency
The trade date of the transaction.   Transaction   Tran                                                                                                                               The reporting currency
                                     Date          Code   Transaction Type         Security                            NZ Dollar Amount             Amount               Balance
                                                                                                                                                                                      equivalent of the transaction.
Tran Code                            AUD BROKER ACCOUNT
                                     01/04/2008           Beginning Balance                                                                                               1,257.75
                                     01/04/2008   wd      Transfer To              CIP Ltd CCM- AUD Call                      (1,460.97)           (1,257.75)                 0.00    Transfers Between Ledger
Two digit alphabetical code          01/04/2008   dp      Dividend Contribution    AXA Asia Pacific Holdings Ltd                       211.11          182.00              182.00
                                                                                                                                                                                      and Cash Management
for the transaction type.            01/04/2008
                                     02/04/2008
                                                  dp
                                                  wd
                                                          Dividend Contribution
                                                          Transfer To
                                                                                   Australian Wealth Management
                                                                                   CIP Ltd CCM- AUD Call
                                                                                                                                    231.99
                                                                                                                                    (211.11)
                                                                                                                                                      200.00
                                                                                                                                                    (182.00)
                                                                                                                                                                           382.00
                                                                                                                                                                          200.00
                                     02/04/2008   wd      Transfer To              CIP Ltd CCM- AUD Call                         (231.99)          (200.00)                   0.00    For sweeps from Ledger to
Transaction Type                     04/04/2008
                                     04/04/2008
                                                  dp
                                                  wd
                                                          Dividend Contribution
                                                          Transfer To
                                                                                   Newmont Mining
                                                                                   CIP Ltd CCM- AUD Call
                                                                                                                                      15.88
                                                                                                                                   (15.88)
                                                                                                                                                          13.58
                                                                                                                                                       (13.58)
                                                                                                                                                                              13.58
                                                                                                                                                                              0.00    Cashman the average value of
Description of the transaction.
                                     04/04/2008   dp      Dividend Contribution    Wotif.Com Holdings Ltd                          420.95             360.00              360.00      Ledger funds is used.
                                     07/04/2008   wd      Transfer To              CIP Ltd CCM- AUD Call                        (420.95)           (360.00)                   0.00
                                     08/04/2008   dp      Dividend Contribution    ABC Learning Centres Ltd                          166.51            142.80              142.80     (This is often the spot rate).
                                     09/04/2008   wd      Transfer To              CIP Ltd CCM- AUD Call                          (166.51)          (142.80)                  0.00
Security                             09/04/2008   dp      Dividend Contribution    APA Group                                      1,615.53           1,385.64            1,385.64     For sweeps from Cashman
                                     10/04/2008   wd      Transfer To              CIP Ltd CCM- AUD Call                        (1,615.53)       (1,385.64)                   0.00
The full name of the security        16/04/2008   wd      FX Conversion Sale       NZD Broker Account                        (51,880.56)        (44,183.04)           (44,183.04)     to Ledger the average value
or the name of the account
                                     16/04/2008   dp      Transfer From            CIP Ltd CCM- AUD Call                       51,880.56          44,183.04                   0.00    of Cashman funds is used.
                                     18/04/2008   dp      Dividend Contribution    Ramsay Health Care Ltd                           255.57              216.75              216.75
for transfers of cash.               21/04/2008   wd      Transfer To              CIP Ltd CCM- AUD Call                         (255.57)            (216.75)                 0.00    If this results in the ledger
                                     22/04/2008
                                     23/04/2008
                                                  dp
                                                  wd
                                                          Dividend Contribution
                                                          Transfer To
                                                                                   AGL Energy Ltd
                                                                                   CIP Ltd CCM- AUD Call
                                                                                                                                   504.27
                                                                                                                                (504.27)
                                                                                                                                                        425.10
                                                                                                                                                     (425.10)
                                                                                                                                                                            425.10
                                                                                                                                                                              0.00
                                                                                                                                                                                      balance returning to zero, a
                                     28/04/2008   dp      Dividend Contribution    Transpacific Industries Group Ltd                 76.45              64.00               64.00     gain or loss may be realised.
                                     29/04/2008   wd      Transfer To              CIP Ltd CCM- AUD Call                          (76.45)            (64.00)                  0.00
                                     05/05/2008   dp      Dividend Contribution    Woolworths Ltd                                  794.99             660.00              660.00
                                     06/05/2008   wd      Transfer To              CIP Ltd CCM- AUD Call                        (794.99)           (660.00)                   0.00
                                     12/05/2008   dp      Dividend Contribution    ConnectEast Group                              1,771.04           1,443.75            1,443.75
                                     13/05/2008   wd      Transfer To              CIP Ltd CCM- AUD Call                       (1,771.04)         (1,443.75)                  0.00
                                     13/06/2008   dp      Contribution from Sale   ABC Learning Centres Ltd                      2,172.80              1,737.15            1,737.15
                                     18/06/2008   wd      Transfer To              CIP Ltd CCM- AUD Call                       (2,172.80)           (1,737.15)                0.00
                                     30/06/2008   dp      Dividend Contribution    Newmont Mining                                     16.70               13.28               13.28
30/06/2008           ENDING BALANCE                                                                  13.28

                                                        GBP BROKER ACCOUNT
                                                        01/04/2008           Beginning Balance                                                               0.00
                                                        02/04/2008   dp      Dividend Contribution   Scottish & Southern Energy plc    374.35     149.33    149.33      Local Currency Amount
                                                        03/04/2008   wd      Transfer To             CIP Ltd CCM- GBP Call            (374.35)   (149.33)    0.00
                                                                                                                                                                        The amount of the transaction in
                                                                                                                                                                        the currency of the transaction.

Transfers between Cash Ledger and                                                                                                                                       Local Currency Balance
Cash Management Account
                                                                                                                                                                        The balance on the account
Amounts transferred between the Cash Ledger and                                                                                                                         in local currency as at report
the Cash Management Account may result in realised                                                                                                                      date. The ending balance is
currency gains and losses. These gains and losses are                                                                                                                   reported as the Quantity for
recorded in the Realised Gains and Losses report and are                                                                                                                the Cash Ledger Account on
calculated using average foreign currency exchange rates.                                                                                                               the Statement of Holdings.
                                                                                                                                                                        • Amounts are reported in
                                                                                                                                                                          local currency, the currency
                                                                                                                                                                          of the account as well as the
                                                                                                                                                                          reporting currency equivalent.

PLEASE NOTE: The figures and graphs included in this guide are for illustrative purposes only.                                                                       MPS Portfolio Reports Guide 05.17/ 18
Cash Management Accounts
The Cash Management Accounts Report shows all transactions that have settled across the Cash Management Account for the Portfolio.
Transactions are reported by currency and date order within a currency.

Transaction Date                                                                CASH MANAGEMENT ACCOUNTS                                                             Reporting Currency Amount
                                                                                                                                      Local Currency
The trade date of the transaction.   Transaction   Tran                                                                                                              The reporting currency
                                     Date          Code      Transaction Type        Security                NZ Dollar Amount        Amount              Balance
                                                                                                                                                                     equivalent of the transaction.
Tran Code                            16/04/2008
                                     16/04/2008
                                                   wd
                                                   dp
                                                             Transfer To
                                                             Interest Contribution
                                                                                     GBP Broker Account
                                                                                     CIP Ltd CCM- GBP Call
                                                                                                                   (139,119.70)
                                                                                                                           19.13
                                                                                                                                    (51,118.67)
                                                                                                                                           7.03
                                                                                                                                                            (7.03)
                                                                                                                                                             0.00
                                     14/05/2008    dp        Transfer From           GBP Broker Account                695.86           274.17              274.17   Transfers Between Ledger
Two digit alphabetical code for      19/05/2008    dp        Interest Contribution   CIP Ltd CCM- GBP Call                0.23           0.09              274.26
                                                                                                                                                                     and Cash Management
the transaction type.                23/05/2008    dp        Transfer From           GBP Broker Account                 275.55         109.20              383.46
                                     26/05/2008
                                     02/06/2008
                                                   dp
                                                   dp
                                                             Interest Contribution
                                                             Interest Contribution
                                                                                     CIP Ltd CCM- GBP Call
                                                                                     CIP Ltd CCM- GBP Call
                                                                                                                          0.38
                                                                                                                          0.45
                                                                                                                                          0.15
                                                                                                                                          0.18
                                                                                                                                                           383.61
                                                                                                                                                           383.79
                                                                                                                                                                     This is calculated for credit
Transaction Type                     09/06/2008    dp        Interest Contribution   CIP Ltd CCM- GBP Call                0.47            0.18             383.97    transactions by using the
Description of the transaction.
                                     11/06/2008    dp        Transfer From           GBP Broker Account                  57.24          22.06             406.03
                                                                                                                                                                     trade date exchange rate.
                                     16/06/2008    dp        Interest Contribution   CIP Ltd CCM- GBP Call                0.50            0.19            406.22
                                     20/06/2008    dp        Transfer From           GBP Broker Account                 153.94          59.42             465.64     For debit transactions an
Security                             23/06/2008    dp        Interest Contribution   CIP Ltd CCM- GBP Call                0.55            0.21             465.85    average exchange rate of
                                     30/06/2008    dp        Interest Contribution   CIP Ltd CCM- GBP Call                0.60            0.23            466.08
                                                                                                                                                                     the account balance prior
The full name of the security        30/06/2008              ENDING BALANCE                                                                               466.08     to the transaction is used.
or the name of the account for
transfers of cash.
                                     CIP LTD CCM- NZD CALL
                                     01/04/2008              Beginning Balance                                                                         773,824.60
                                                                                                                                                                     Currency gains and losses may
                                     01/04/2008    dp        Transfer From           NZD Broker Account                458.93          458.93          774,283.53    occur where foreign currency
                                     07/04/2008    dp        Transfer From           NZD Broker Account                206.36          206.36          774,489.89    amounts are realised.
                                     07/04/2008    dp        Interest Contribution   CIP Ltd CCM- NZD Call              820.72         820.72           775,310.61
                                     09/04/2008    dp        Transfer From           NZD Broker Account               3,176.47        3,176.47         778,487.08
                                     11/04/2008    dp        Transfer From           NZD Broker Account                 612.00         612.00          779,099.08
                                     11/04/2008    dp        Transfer From           NZD Broker Account                 627.45         627.45          779,726.53
                                     14/04/2008    wd        Transfer To             NZD Broker Account            (10,146.06)     (10,146.06)         769,580.47
                                     14/04/2008    dp        Interest Contribution   CIP Ltd CCM- NZD Call              824.85         824.85          770,405.32
                                     16/04/2008    dp        Transfer From           NZD Broker Account                 544.71         544.71          770,950.03
                                     16/04/2008    dp        Transfer From           NZD Broker Account                509.54         509.54           771,459.57
16/04/2008   dp   Transfer From           NZD Broker Account                                 51,880.56        51,880.56    823,340.13
                                                        16/04/2008   dp   Transfer From           NZD Broker Account                                127,382.68       127,382.68    950,722.81
                                                        21/04/2008   dp   Interest Contribution   CIP Ltd CCM- NZD Call                                953.22           953.22     951,676.03
                                                        24/04/2008   dp   Transfer From           NZD Broker Account                                59,244.00        59,244.00    1,010,920.03
                                                        28/04/2008   dp   Interest Contribution   CIP Ltd CCM- NZD Call                               1,044.73         1,044.73   1,011,964.76       Local Currency Amount
                                                        30/04/2008   dp   Transfer From           NZD Broker Account                                 5,000.00         5,000.00    1,016,964.76
                                                        30/04/2008   wd   Withdrawal              Client funds: 1000000.00 : direct credit to   (1,000,000.00)   (1,000,000.00)     16,964.76        The amount of the transaction in
                                                                                                  the arturo trust 01-0102-0439700-000 |
                                                        01/05/2008   dp   Transfer From           NZD Broker Account                                    149.99           149.99       17,114.75      the currency of the transaction.

Transfers between Cash Ledger and                                                                                                                                                                    Local Currency Balance
Cash Management Account
                                                                                                                                                                                                     The balance on the account
Amounts transferred between the Cash Ledger and                                                                                                                                                      in local currency as at report
the Cash Management Account may result in realised                                                                                                                                                   date. The ending balance is
currency gains and losses. These gains and losses are                                                                                                                                                reported as the Quantity for
recorded in the Realised Gains and Losses report and are                                                                                                                                             the Cash Ledger Account on
calculated using average foreign currency exchange rates.                                                                                                                                            the Statement of Holdings.
                                                                                                                                                                                                     • Amounts are reported in
                                                                                                                                                                                                       local currency, the currency
                                                                                                                                                                                                       of the account as well as the
                                                                                                                                                                                                       reporting currency equivalent.

PLEASE NOTE: The figures and graphs included in this guide are for illustrative purposes only.                                                                                                    MPS Portfolio Reports Guide 05.17/ 20
AUCKLAND                                       NEW PLYMOUTH                                   CHRISTCHURCH
                                        Level 32, Vero Centre                          First Floor, 9 Young Street                    Level 3, Craigs Investment Partners House
                                        48 Shortland Street                            PO Box 8011, New Plymouth 4342                 76 Victoria Street
                                        PO Box 1196, Auckland 1140                     P. 06 759 0015         F. 06 759 0016          PO Box 90, Christchurch 8140
                                        P. 09 919 7400        F. 09 303 2520           E. newplymouth@craigsip.com                    P. 03 379 3433         F. 03 379 5687
                                        E. auckland@craigsip.com                                                                      E. christchurch@craigsip.com
                                                                                       WHANGANUI
                                        HAMILTON                                       17 Drews Avenue                                QUEENSTOWN
                                        Level 4, PwC Centre                            PO Box 63, Whanganui 4541                      Level 1, Five Mile Centre,
                                        Cnr Anglesea & Ward Streets                    P. 06 349 0030      F. 06 348 5523             Grant Road, Frankton
                                        PO Box 1282, Hamilton 3240                     E. whanganui@craigsip.com                      PO Box 2487, Wakatipu,
                                        P. 07 838 1818        F. 07 838 0828                                                          Queenstown 9349
                                        E. hamilton@craigsip.com                       PALMERSTON NORTH                               P. 03 901 0170          F. 03 901 0179
                                                                                       First Floor                                    E. queenstown@craigsip.com
HEAD OFFICE - TAURANGA                  TAURANGA                                       Cnr Broadway Avenue & Vivian Street
Craigs Investment Partners House        Craigs Investment Partners House               PO Box 1543, Palmerston North 4440             DUNEDIN
158 Cameron Road                        158 Cameron Road                               P. 06 953 3460       F. 06 953 0640            First Floor, Craigs Investment Partners House
PO Box 13155, Tauranga 3141             PO Box 13155, Tauranga 3141                    E. palmerstonnorth@craigsip.com                330 Moray Place
E. headoffice@craigsip.com              P. 07 577 6049        F. 07 578 8416                                                          PO Box 5545, Dunedin 9058
                                        E. tauranga@craigsip.com                       WELLINGTON                                     P. 03 477 5900          F. 03 477 6743
KERIKERI                                                                               Level 14, PwC Tower                            E. dunedin@craigsip.com
Hobson House                            ROTORUA                                        113 – 119 The Terrace
14 Hobson Avenue                        First Floor, 1196 Whakaue Street               PO Box 10556, Wellington 6143                  GORE
PO Box 841, Kerikeri 0245               PO Box 1148, Rotorua 3040                      P. 04 917 4330        F. 04 917 4350           120 Main Street
P. 09 407 7926         F. 09 407 7429   P. 07 348 1860         F. 07 348 1863          E. wellington@craigsip.com                     PO Box 317, Gore 9740
E. kerikeri@craigsip.com                E. rotorua@craigsip.com                                                                       P. 03 208 9310       F. 03 208 4161
                                                                                       BLENHEIM                                       E. gore@craigsip.com
WHANGAREI                               GISBORNE                                       2 Alfred Street
1 Robert Street                         75 Childers Road                               PO Box 678, Blenheim 7240                      INVERCARGILL
PO Box 573, Whangarei 0140              PO Box 153, Gisborne 4040                      P. 03 577 7410       F. 03 577 7440            49 Kelvin Street
P. 09 438 1988       F. 09 438 5167     P. 06 868 1155        F. 06 868 1154           E. blenheim@craigsip.com                       PO Box 1246, Invercargill 9840
E. whangarei@craigsip.com               E. gisborne@craigsip.com                                                                      P. 03 214 9939         F. 03 214 9933
                                                                                                                                      E. invercargill@craigsip.com

                                        0800 272 442 / craigsip.com
                                        Craigs Investment Partners Limited is a NZX Participant Firm. Adviser Disclosure Statements are available on request and free of charge.
                                        Please visit craigsip.com for more information. Craigs Investment Partners Superannuation Management Limited is the Manager and Issuer
                                        of the Craigs KiwiSaver Scheme and the Craigs Superannuation Scheme. The Craigs KiwiSaver Scheme Product Disclosure Statement and the
                                        Craigs Superannuation Scheme Product Disclosure Statements are available at craigsip.com/document-library. QuayStreet Asset Management
                                        Limited is the Manager and Issuer of the QuayStreet Funds and the Product Disclosure Statement is available at quaystreet.com/documents.
You can also read