Poverty Trends in London | 2020 - Prepared by
←
→
Page content transcription
If your browser does not render page correctly, please read the page content below
Poverty Trends
in London | 2020

             Prepared by
Accessibility

The City of London is committed to accessibility and the principles of independence, dignity,
integration, and equality of opportunity, as described in the Accessibility for Ontarians with
Disabilities Act (AODA). To request this report in an alternate format or if you require additional
assistance with reviewing the data presented in this report, please contact the Child and Youth
Network by email at cyn@london.ca.

Table of Contents

Section 1.0 Introduction........................................................................................3
   1.1 Setting the Context......................................................................................4
   1.2 About This Report.........................................................................................5
   1.3 Data Limitations...........................................................................................6

Section 2.0 What Does Poverty Mean?...............................................................7
   2.1 Defining Poverty...........................................................................................8
   2.2 Indicators and Measures Used to Track Poverty......................................8

Section 3.0 A Snapshot of the Numbers..........................................................14

Section 4.0 Who Is More Likely to Experience Poverty?...............................20
   4.1 Children and Youth.....................................................................................21
   4.2 Lone Parent Families..................................................................................23
   4.3 Older Adults................................................................................................26
   4.4 Indigenous People.....................................................................................28
   4.5 Newcomers.................................................................................................29
   4.6 Recent and Established Immigrants........................................................30
   4.7 Visible Minorities........................................................................................31

Section 5.0 What Does It Mean to Experience Poverty?...............................33
   5.1 Income Inequality......................................................................................34
   5.2 Food Insecurity...........................................................................................42
   5.3 Housing Instability.....................................................................................45
   5.4 Educational Disparity.................................................................................54

Section 6.0 What Work Is Being Done to End Poverty?................................61
   6.1 Work Being Done by the CYN...................................................................62
   6.2 Results of London for All: A Roadmap to End Poverty...........................64
   6.3 Work Being Done Across Ontario.............................................................67
   6.4 Work Being Done Across Canada.............................................................68

Section 7.0 Conclusion.........................................................................................70

Appendix A: Data Sources and Notes...............................................................72

Appendix B: Endnotes..........................................................................................78

                                                                                                                        2
Section 1.0
    Introduction

3
1.1 Setting the Context
The Child and Youth Network

In 2007, partners across London, Ontario came together to address a significant community
concern – 1 in every 5 children born in London was living in poverty.

In response to this issue, the Child and Youth Network (CYN) was formed and community
partners started to change how they work together to support families in London. One of the key
priorities identified by partners as a pathway to creating change was ending poverty, in addition
to making literacy a way of life, promoting healthy eating and healthy physical activity, and
creating a family-centred service system.

In 2014, statistics showed that 1 in 4 children born in London were living in poverty, indicating
an increasing need for community-level strategies to move the needle on ending poverty for
children, youth, and families in London.

The work started in 2007 continues to be important today, and ending poverty remains one
of the four priorities of the CYN. Further, community partners have demonstrated an ongoing
commitment to supporting and empowering children, youth, and families to break the cycle of
poverty through their endorsement of the Child and Youth Agenda, which is in its third iteration.
For a copy of the most recent Child and Youth Agenda, please go to the Child and Youth Network
Resource Repository.

London for All

In 2015, in response to an identified need to develop coordinated community strategies to
address poverty in London, the Mayor’s Advisory Panel on Poverty was formed. After more than
six months of research, study, and community consultation, the Panel released London for All: A
Roadmap to End Poverty in 2016 outlining a series of 112 recommendations for ending poverty in
London in one generation.

To put the 112 recommendations into action, in 2017, United Way Elgin Middlesex became the
lead agency for the three-year London for All (LFA) initiative to address poverty in London. Using
a coordinated, collective impact approach, LFA brought together community organizations,
volunteers, and individuals with lived and/or living experience to implement the LFA
recommendations.

As outlined in the 2017-2021 Child and Youth Agenda, CYN Ending Poverty priority partners
have aligned their actions with the LFA recommendations in support of LFA’s vision of ending
poverty in a generation. Further, CYN partners have worked to be a key community resource for
implementing the LFA recommendations related to children, youth, and families.

                                                                                                     4
For more information about the work being done by the CYN, LFA, and the City of London to
    break the cycle of poverty, see Section 6.0 of this report.

    1.2 About This Report
    In 2015, the first Poverty Trends in London report was published as a resource for education
    and community planning. A copy of the 2015 Poverty Trends Report can be found on the CYN’s
    website.

    Building on the 2015 analysis, the purpose of this report is to provide information about poverty
    in London, Ontario. Further, where available, annual trends presented in this report show
    changes that have happened in the community over time. The data and results included in this
    report represent the time period from 2012 to 2019.

    This report includes descriptions of different methods used to measure and understand poverty
    and various factors related to poverty, statistics and trends specific to London, and where
    possible, a comparison with trends in Ontario. Further, an overview of strategies and work being
    done to end poverty in London is provided.

    For those who want to learn about and discuss what poverty looks like in London and how to
    address poverty in the community, this report can be used as a key reference document. The
    information included in this report can also be used to support decision-making and inform
    strategies focused on ending poverty in London.

    For a summary overview of the trends outlined in the report, please see Section 3.0.

5
1.3 Data Limitations
The following data limitations help to provide context for the data included in this report:

  • Data Availability – Data for some indicators is not available on an annual basis and is
     only available from census data, which is collected every five years. This means it was not
     possible to conduct a trend analysis for each indicator. Where a trend analysis was not
     possible, data from the most recent census year has been provided. Further, updates to this
     report will be made on a regular basis to incorporate new data as it becomes available.

  • Geographic Area Represented by the Data – Wherever possible, this report provides data
     for the city level. However, some data is not available at the city level and is only available
     for the London Census Metropolitan Area (CMA). CMA’s are geographic areas established
     by Statistics Canada to include a total population of at least 100,000 people of which 50,000
     or more live in the core. The London CMA is larger than the City of London and includes St.
     Thomas, Thames Centre, Middlesex Centre, Strathroy-Caradoc, Adelaide Metcalfe, Central
     Elgin, and Southwold. While data for the City of London and London CMA are not directly
     comparable, they can both be used to understand the trends and experiences of people
     living in and around the London area.

                                                                                                       6
Section 2.0
    What Does Poverty Mean?

7
2.1 Defining Poverty
Poverty can be defined as “the condition of a person who is deprived of the resources, means,
choices, and power necessary to acquire and maintain a basic level of living standards and to facilitate
integration and participation in society.” i
While a lack of income is one of the most common factors used to define poverty, poverty is multi-
dimensional and can be impacted by a variety of social, natural, economic, and political factors.
Further, poverty can have far-reaching effects, putting people at increased risk of experiencing
hunger and malnutrition, poor health, barriers to education, homelessness or inadequate
housing, social discrimination, and social exclusion.ii
In 2008, Ontario’s first Poverty Reduction Strategy, Breaking the Cycle (2009-2013), was released,
highlighting poverty as a multi-faceted, complex problem requiring a comprehensive, results-
driven approach. Health, education, income security, material deprivation, and housing
security were identified in the first Poverty Reduction Strategy as critical factors impacting
intergenerational poverty. Building on the poverty reduction efforts of the first strategy, Ontario’s
second Poverty Reduction Strategy, Realizing Our Potential (2014-2019), was released in 2014 and
additional indicators to measure poverty in Ontario were identified.iii For a full list of the indicators
used to measure poverty in Ontario between 2009 and 2019, see Section 2.2 below.
Additionally, in 2018, the federal government established Canada’s Official Poverty Line, which is
the first official measure of poverty in Canada’s history. Canada’s Official Poverty Line is calculated
using the Market Basket Measure. According to this measure, families live in poverty if they cannot
afford the cost of a modest basket of goods and services (e.g. food, clothing, transportation,
shelter, etc.) in their community required to meet their basic needs and a basic standard of living.iv
Other measures commonly used to understand and define poverty include the Low Income
Measure, which is used as a key indicator in the Ontario Poverty Reduction Strategy, and the Low
Income Cut-Off. Each of these measures is described in more detail in the next section of this
report.
2.2 Indicators and Measures Used to Track Poverty
Outlined in this section is a description of the key measures and indicators used in this report
to provide a picture of poverty in London, Ontario. These measures were selected for use in this
report because they are standard measures that allow for comparison at a community, provincial,
and national level, as well as the tracking of trends over time.
8The data included for the Market Basket Measure and Low Income Cut-Off in the tables below is
based on calculations for families living in an Ontario city of a similar size to London (i.e. with a
population between 100,000-499,999 people). For more information about the data sources used
to report on each indicator and measure, please see Appendix A: Data Sources and Notes.
Market Basket Measure (MBM)
As previously noted, the Market Basket Measure (MBM) defines poverty using a set of goods and
services required for individuals and families to maintain a basic standard of living in a specific
community. Using the MBM, a family is considered to be living in poverty if they do not have
enough money to afford the goods and services in their community required to meet their basic
needs. These goods and services include healthy food, clothing and footwear, transportation,
appropriate shelter, home maintenance (e.g. electricity, heat, clean water), and other goods or
services needed to engage in the community (e.g. basic telephone service, recreation, school
supplies, personal care items, etc.).v
Outlined in the table below is the amount of income families of different sizes living in London,
Ontario need to be able to afford a modest basket of goods and services. This minimum amount
of income families need to meet their basic needs is referred to as the “MBM threshold.” The
thresholds outlined below were those used for the 2016 Census.vi
Table 1: MBM Threshold by Household Size1
Household Size (# of People) MBM Threshold
1 person $18,436
2 people $26,072
3 people $31,932
4 people $36,872
5 people $41,224
6 people $45,159
7 people $48,777
1
The MBM threshold is calculated based on the community size within a specific province, meaning there is no
province-wide threshold for comparison. The MBM threshold provided in this table has been calculated for an Ontario
city with a population between 100,000-499,999 people, as London has a population size within this range.
9Low Income Cut-Off (LICO)
The Low Income Cut-Off (LICO) represents the amount of income below which a family will likely
need to spend a larger portion of its income on necessities like food, shelter, and clothing than
the average family. Specifically, LICO is the income threshold at which families are expected to
spend 20 percentage points more than the average family on these necessities.vii LICO can be
calculated based on a family’s income before tax is deducted (i.e. LICO-BT) or after tax is deducted
(i.e. LICO-AT). Outlined below are the LICO-BT and LICO-AT thresholds for 2019 for families living
in a city the size of London.viii
Table 2: LICO-BT Threshold by Household Size2
Household Size (# of People) LICO-BT Threshold
1 person $22,759
2 people $28,332
3 people $34,831
4 people $42,290
5 people $47,963
6 people $54,096
7 or more people $60,227
Table 3: LICO-AT Threshold by Household Size
Household Size (# of People) LICO-AT Threshold
1 person $18,520
2 people $22,540
3 people $28,068
4 people $35,017
5 people $39,874
6 people $44,221
7 or more people $48,568
2
The LICO-BT and LICO-AT thresholds are calculated based on the community size within a specific province, meaning
there is no province-wide threshold for comparison. The LICO thresholds provided in these tables have been calculated
for an Ontario city with a population between 100,000-499,999 people, as London has a population size within this range.
10Low Income Measure (LIM)
The Low Income Measure (LIM) is used to determine the number of families with an income
below 50% of the national median household income. Based on the LIM, when a family is living in
poverty, it means their income is substantially below the average.ix The LIM can also be calculated
based on before tax income (i.e. LIM-BT) or after tax income (i.e. LIM-AT). The table below
provides the 2018 LIM before and after tax thresholds for various household sizes.x
Table 4: LIM-BT Threshold by Household Size3
Household Size (# of People) LIM-BT Threshold
1 person $27,750
2 people $39,244
3 people $48,064
4 people $55,500
5 people $62,051
6 people $67,973
7 people $73,420
Table 5: LIM-AT Threshold by Household Size
Household Size (# of People) LIM-AT Threshold
1 person $24,183
2 people $34,200
3 people $41,886
4 people $48,366
5 people $54,075
6 people $59,236
7 people $63,982
3
The LIM-BT and LIM-AT thresholds are calculated as a fixed percentage (50%) of the national median household
income. Therefore, there is no province-wide or community-specific threshold for comparison. The LIM thresholds
provided in these tables represent the amount of income that is equal to half of the median income of all households in
Canada for each household size.
11Ontario Indicators Used to Track Poverty
The Government of Ontario is required by the Poverty Reduction Act to track and report on poverty
reduction indicators each year.xi These indicators provide a picture of poverty at a provincial
level and are used in the Poverty Reduction Strategy to measure and track progress on reducing
poverty in Ontario.
The table below lists the 11 indicators outlined in the 2014-2019 Poverty Reduction Strategy and
whether comparable data is also available at a city level for London.4
Table 6: Availability of London-Specific Data for Each Poverty Reduction Indicator
Poverty Reduction Indicator Availability of London-Specific Data
Child Poverty Rate (LIM-50) • City level and CMA level data is available
Depth of Poverty (LIM-40) • Not available at this time
Birth Weight • Not available at this time
School Readiness (Early Development • Regional level (Middlesex-London) data is
Instrument) available
Educational Progress at Grades 3 and 6 • Board level data is available
High School Graduation Rate • Board level data is available
Ontario Housing Measure • Not available at this time
Youth Not in Education, Employment, or • CMA level data is available
Training
Long-Term Unemployment • Not available at this time
4
Ontario’s first Poverty Reduction Strategy (2009-2013) included the Low Income Measure (LIM-50), Depth of Poverty
(LIM-40), birth weights, school readiness (Early Development Instrument), educational progress (Grades 3 and 6),
high school graduation rates, the Ontario Housing Measure, and the Ontario Deprivation Index. Due to changes at
Statistics Canada, the Ontario Deprivation Index was removed from the list of indicators included in the second Poverty
Reduction Strategy (2014-2019). Further, three new indicators were added to the second strategy, including youth not
in education, employment, or training, long-term unemployment, and poverty rates of vulnerable populations. Further,
the homelessness indicator (i.e. the rate of chronic homelessness per 10,000 people) was added as a poverty measure
in 2018. The table includes the most recent list of indicators from Ontario’s 2014-2019 Poverty Reduction Strategy.
12Poverty Reduction Indicator Availability of London-Specific Data
Poverty Rates of Vulnerable Populations • City level and CMA level data is available
(people living with a disability, newcomers, for newcomers and Indigenous people
female lone parents, unattached individuals • CMA level data is available for female
aged 45-64, Indigenous people living off lone parents
reserve)
• Data for people living with a disability
and unattached individuals aged 45-64 is
not available at this time
Homelessness Indicator • Not available at this time
London-Specific Indicators
There are also several additional indicators used in this report specific to London that can help to
inform local poverty trends. These include:
• Use of the London Food Bank;5
• Food insecurity;
• Emergency shelter use;
• Social assistance caseloads (i.e. Ontario Works and Ontario Disability Support Program);
• Housing affordability;
• Rent-geared-to-income (social) housing waitlist, wait times, and applicants housed;
• Housing Stability Bank use; and
• Housing First program participation.
5
The data presented in this report regarding the use of food banks refers specifically to the use of the London Food
Bank. However, it is important to note that additional programs that address food insecurity (e.g. food cupboards,
emergency food kits, meal programs, etc.) are also available in the community and are being accessed by Londoners.
13Section 3.0
A Snapshot of the Numbers
14Who Is More Likely to Experience Poverty?
Children and Youth
An increasing number of children are living 32% increase in the number of children
in families receiving social assistance (i.e. and youth living in families relying on social
Ontario Works or Ontario Disability Support assistance.
Program), but overall rates of child and 2014 – 9,706 2019 – 12,810
youth poverty are decreasing.
Decrease in the number of children and
youth living below the CFLIM-AT threshold.
2012 – 1 in 4 2018 – 1 in 5
Lone Parent Families
More lone parent families are receiving 10.5% increase in the number of lone
social assistance, but the overall rate of parent families receiving social assistance.
poverty amongst lone parent families is 2014 – 4,232 2019 – 4,676
decreasing.
Decrease in the number of lone parent
families living below the CFLIM-AT threshold.
2012 – 41.2% 2018 – 34.1%
Older Adults
More older adults in London are 4,110 Londoners aged 65 or older received
experiencing poverty. social assistance in 2018.
Increase in the number of older adults
living below the CFLIM-AT threshold.
2012 – 6.7% 2018 – 8.6%
7,800 older adults were living with income
below the CFLIM-AT threshold in 2018.
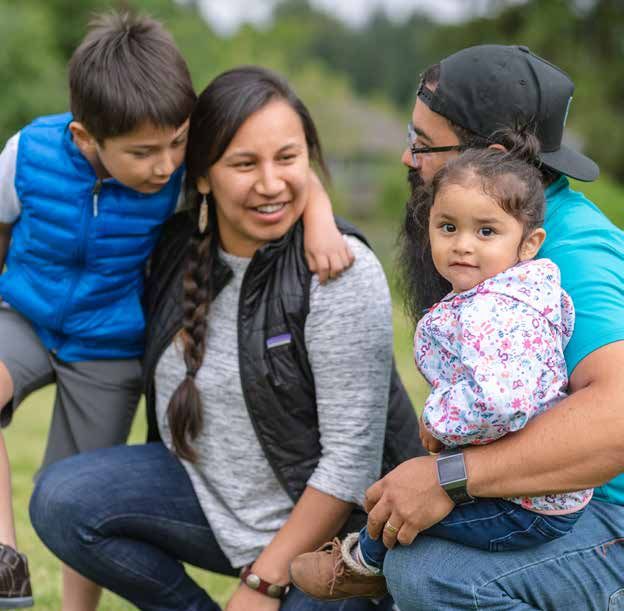
15Indigenous People
Poverty is disproportionately impacting 3,440 Indigenous Londoners lived in poverty
Indigenous Londoners. in 2015 based on the LIM-AT.
35.4% of Indigenous people in London lived
below the LIM-AT threshold in 2015, compared
to 18.8% of all Londoners.
A Note About the Data
It is important to note that national census data has been shown to undercount Indigenous
people, with research showing the number of Indigenous individuals living in London may be 3-4
times higher than the number captured through the census. This means census data may not
be representative of this population and may underestimate the prevalence of poverty amongst
Indigenous Londoners.xii
Newcomers6
Poverty is more prevalent amongst 6,395 newcomers in London lived in poverty
newcomers living in London. in 2015 based on the LIM-AT.
55.2% of newcomers living in London had an
income below the LIM-AT threshold in 2015,
compared to 18.8% of all Londoners.
Recent and Established Immigrants7
Poverty is experienced at a higher rate 13,835 recent and established immigrants in
amongst recent immigrants and is lower London lived in poverty in 2015 based on the
amongst established immigrants living in LIM-AT.
London.
35.9% of recent immigrants in London were
living below the LIM-AT threshold in 2015.
16.4% of established immigrants living in
London had an income below the LIM-AT
threshold in 2015.
6
For the purpose of this report, newcomers refers to landed immigrants who have been in Canada for five years or less.
7
For the purpose of this report, recent immigrants refers to landed immigrants who have been in Canada for 6-10 years,
and established immigrants refers to landed immigrants who have been in Canada for more than 10 years.
16Visible Minorities
Poverty is higher amongst Londoners who 26,260 Londoners part of a visible minority
are part of a visible minority group. lived in poverty in 2015 based on the LIM-AT.
35.0% of people in London who were part of
a visible minority group lived below the LIM-
AT threshold in 2015, compared to 18.8% of all
Londoners.
What Does It Mean to Experience Poverty?
Income Inequality
Poverty can mean not having enough money 62,845 people living in London did not have
to pay for basic needs. enough money to pay for basic goods and
services in 2015 based on the MBM.
16.6% of Londoners lived below the MBM
threshold in 2015.
Poverty can mean having little money left 43,855 Londoners were spending more of
after paying for food, shelter, and clothing. their income on food, shelter, and clothing
than the average family in 2015 based on the
LICO-AT.
11.6% of London’s population was living
below the LICO-AT threshold in 2015.
Poverty can mean living with income 71,025 people in London lived on an income
significantly below the average. substantially below the median household
income in 2015 based on the LIM-AT.
18.8% of Londoners lived with income below
the LIM-AT threshold in 2015.
17Poverty can mean experiencing income 13.0% increase in the income gap between
inequality. low income families and all families living in
London between 2012 and 2018.
$7,200 increase in the gap between income
earned by the top and bottom 10% of earners
in London between 2012 and 2018.
Poverty can mean not having a stable 14.4% increase in the number of social
income, limiting the ability to participate assistance cases between 2014 and 2019,
fully in society. outpacing London’s population growth.
26,085 Londoners aged 15 or older were
considered to be part of the working poor in
2015.
Food Insecurity
Poverty can mean not having enough money 1 in 7 households in Middlesex-London didn’t
to eat a healthy diet and not having enough have enough money in 2019 to maintain a diet
food to eat. that was nutritious, adequate, and deemed
culturally acceptable by the individual or
household.
25,439 Londoners received support from the
London Food Bank in 2019, up from 24,604 in
2016.
4 was the average number of times
households visited the London Food Bank in
2019.
27% of households assisted by the London
Food Bank in 2019 were first-time visitors.
18Housing Instability
Poverty can mean not having enough money Increase in the emergency shelter
to pay for adequate shelter. occupancy rate.
2014 – 90% 2019 – 111%
Increase in the average market rent for a
one-bedroom apartment in London.
2015 – $781 2019 – $915
1.8% was London’s housing vacancy rate in
2019.
27.4% of London households paid 30% or
more of their income on shelter in 2015.
5,496 people were on London’s rent-geared-
to-income (social) housing waitlist in 2019.
Educational Disparity
Poverty can make it harder to learn and be 3.3% of children were experiencing multiple
successful in school. challenges based on EDI scores in 2017-2018.
Decrease in the number of Grade 10
students passing the Ontario Secondary School
Literacy Test.
2014-2015 2018-2019
TVDSB – 77% TVDSB – 70%
LDCSB – 81% LDCSB – 80%
Increase in London’s high school
graduation rate.
2014-2015 2017-2018
TVDSB – 78.2% TVDSB – 79.1%
LDCSB – 88.3% LDCSB – 90.4%
15% of London youth aged 15-29 years old
were not in employment, education, or training
in 2018.
19Section 4.0
Who Is More Likely to Experience Poverty?
20While anyone could experience poverty during their lifetime, data consistently demonstrates
that some populations have an increased risk of experiencing poverty. These include children
and youth, lone parent families (particularly female-led lone parent families), single individuals
(specifically those aged 45-64 years old), Indigenous people, newcomers, ethno-cultural and
ethno-racial groups, and people living with a disability.xiii, xiv
This section of the report focuses on the populations that are more likely to experience poverty.
Specifically, data related to indicators of poverty for children and youth, lone parent families,
older adults, Indigenous people, newcomers, recent and established immigrants, and visible
minorities is presented below. City level data was not available to report on key poverty indicators
for single individuals and people living with a disability.
4.1 Children and Youth
An increasing number of children are living in families receiving social assistance
(i.e. Ontario Works or Ontario Disability Support Program), but overall rates of
child and youth poverty are decreasing.
Number of Children in London (City) Households Receiving Social Assistance
In 2019, a total of 12,810 children in the city of London were part of families receiving social
assistance either from Ontario Works (OW) or the Ontario Disability Support Program (ODSP).xv
Figure 1: Annual Number of Children Under 18 Part of Social Assistance Caseloads
Between 2014 and 2019, the total number of children less than 18 years old who were living in
London families receiving social assistance increased from 9,706 in 2014 to 12,810 in 2019, which
represents a 32.0% increase or 3,104 more children.
Further, the number of children part of social assistance caseloads has been increasing
consistently since 2014 at an average rate of 6.4% per year. xvi
21Figure 2: Percent of Children and Youth Living Below the CFLIM-AT Threshold – London
(CMA) + Ontario
In both London and Ontario, there is an overall downward trend in the number and percent of
children and youth less than 18 years old living in households with low income based on the
CFLIM-AT.8 Specifically, the number of children and youth living in poverty in London has been
decreasing by an average rate of 2.4% each year and decreased from 24.3% (n=24,270) of children
and youth (approximately 1 in 4) in 2012 to 19.5% (n=20,710; approximately 1 in 5 children and
youth) in 2018.9
When comparing London with Ontario, the percentage of children and youth living in poverty has
remained higher in London than in Ontario each year between 2012 and 2018.xvii
8
The Census Family Low Income After-Tax Measure (CFLIM-AT) uses census family income from tax filer data to
determine low income status, whereas LIM-AT uses household income from census data (i.e. the 2016 Census of
Population) to calculate low income status. As tax filer data is available on an annual basis, the CFLIM-AT provides an
opportunity to understand trends over time, whereas the LIM-AT is only calculated every five years.
9
While data for children and youth living below the CFLIM-AT threshold indicates an overall downward trend in the
number and percent of children and youth living in poverty, there is an overall upward trend in the number of children
and youth living in families that receive social assistance. The reason for these trends is unknown and may be related
to multiple factors. For example, a decrease in poverty amongst children and youth may be related to increases in child
benefits and the minimum hourly wage. Further, the total number of households receiving social assistance has been
increasing, which means more children and youth are living in families receiving social assistance. Additional data is
needed in order to better understand these trends.
224.2 Lone Parent Families
More lone parent families are receiving social assistance, but the overall rate of
poverty amongst lone parent families is decreasing.
Number of Lone Parent Households in London (City) Receiving Social Assistance
Of all 29,891 households in London that received social assistance in 2019, 4,676 were lone parent
families, meaning lone parent families represented 15.6% of the total social assistance caseload.
In total, 3,133 of these lone parent families received OW and 1,543 received ODSP in 2019.xviii
Figure 3: Annual Social Assistance Caseload With Lone Parent Families
The number of lone parent families receiving social assistance has increased at an average rate
of 2.1% each year since 2014. Overall, there were 444 more lone parent families receiving social
assistance in 2019 than in 2014, representing an overall 10.5% increase in the number of lone
parent families receiving social assistance between 2014 and 2019.xix
Figure 4: Percent of Lone Parent Families Living Below the CFLIM-AT Threshold – London
(CMA) + Ontario
23Overall, the number and percent of lone parent families with income below the CFLIM-AT
threshold decreased between 2012 and 2018 in both London and Ontario. In 2018, there
were 2,550 fewer lone parent families in London living with low income compared to 2012,
representing an 11.4% decrease in the number of lone parent families living below the CFLIM-AT
threshold between 2012 and 2018.10
The percentage of lone parent families living in poverty each year has remained consistently
higher in London compared to Ontario.xx
Figure 5: Percent of Female-Led Lone Parent Families Living Below the LIM-AT Threshold –
London (CMA) + Ontario
Based on the LIM-AT, 36.3% of female-led lone parent families living in London experienced
poverty in 2015 compared to 29.8% of female-led lone parent families in Ontario.xxi
10
While data for lone parent families living below the CFLIM-AT threshold indicates an overall downward trend in the
number and percent of lone parent families living in poverty, there is an overall upward trend in the number of lone
parent families receiving social assistance. The reason for these trends is unknown and may be related to multiple
factors. For example, a decrease in poverty amongst lone parent families may be related to increases in child benefits
and the minimum hourly wage. Further, lone parent families have consistently comprised 16% of all households in
London receiving social assistance between 2014 and 2019. However, the total number of households receiving social
assistance has been increasing, which means more lone parent families are receiving social assistance. Additional data
is needed in order to better understand these trends.
24Figure 6: Income Gap Between Low Income and All Lone Parent Families in London (CMA) –
Median After Tax Income11
Between 2012 and 2018, the income gap between low income lone parent families (i.e. lone
parent families living below the CFLIM-AT threshold) and all lone parent families grew by 27.1%,
which is equal to an increase of $4,800. While the change in the income gap during this time
period has varied from -0.23% to 9.11%, overall, the income gap has been increasing at an
average rate of 4.5% each year.xxii, xxiii
11
Median income is based on tax filer data, meaning the data represents individuals and families who filed a personal
tax return in the reference year.
254.3 Older Adults
More older adults in London are experiencing poverty.
Number of Older Adults Receiving Social Assistance in London (CMA)
According to tax filer data, a total of 4,110 older adults received social assistance benefits in 2018,
representing 4.6% of all older adults living in London.xxiv
Figure 7: Percent of Older Adults in London (CMA) Receiving Social Assistance
While the percentage of adults aged 65 or older receiving social assistance increased from
3.2% (n=2,360) in 2012 to 4.5% (n=3,440) in 2013, the proportion of older adults receiving social
assistance has remained fairly consistent between 2013 and 2018.xxv
Figure 8: Average Amount of Social Assistance Older Adults in London (CMA) Receive
A decrease in the average amount of social assistance received by older adults occurred between
2012 and 2013, with a decrease of 26.6% (i.e. a decrease of $744). The average amount of social
assistance older adults received then increased by 21.7% ($446) between 2013 and 2018. However,
the average amount of social assistance older adults received in 2018 ($2,502) was still lower than
it was in 2012 ($2,801).xxvi
26Figure 9: Percent of Older Adults Living Below the CFLIM-AT Threshold – London (CMA) +
Ontario
Between 2012 and 2018, the number and percent of older adults living with an income below the
CFLIM-AT threshold increased in both London and Ontario. In London, there has been a 58.9%
increase in the number of older adults living with low income, increasing from 6.7% (n=4,910) of
older adults in 2012 to 8.6% (n=7,800) in 2018.
Although the number and percent of older adults living below the CFLIM-AT threshold has been
increasing in London and Ontario, since 2012, the proportion of older adults living with low
income has remained lower in London compared to Ontario.xxvii
Figure 10: Median Before Tax Income for Older Adults
According to tax filer data, the median before tax income of older adults living in London in 2018
was $33,830, which is 14.7% ($4,340) more than in 2012 when the median income was $29,490
for older adults.xxviii
274.4 Indigenous People
Poverty is disproportionately impacting Indigenous Londoners.
Number of Indigenous People in London (City) Living Below the LIM-AT Threshold
In 2015, 9,725 people living in London identified as Indigenous, representing 2.6% of the total
population. Of these people, 3,440 had an income below the LIM-AT threshold, meaning 35.4%
of Indigenous people in London were living in poverty in 2015. For comparison, 18.8% of all
Londoners were living below the LIM-AT threshold in 2015.xxix
Figure 11: Percent of Indigenous People Living Below the LIM-AT Threshold – London (City) +
Ontario
Based on the LIM-AT, the percentage of Indigenous people living in poverty in 2015 was higher in
London (35.4%) than amongst Indigenous people living in Ontario (23.7%).xxx, xxxi
Impact of Financial Hardship on the Health of Indigenous People
According to a study conducted by the Southwest Ontario Aboriginal Health Access Centre
(SOAHAC), only a small percentage of Indigenous adults participated in the 2016 Census.
Specifically, it was found that the number of Indigenous individuals living in London may be 3-4
times higher than the number captured through the census. As a result, census data may not be
representative of Indigenous Londoners and may underestimate the prevalence of poverty in this
population.
Therefore, the “Our Health Counts Survey” was done to get a more representative sample of
Indigenous households. According to the study results, in 2015, 90% of Indigenous adults in
London were living below the LICO-BT threshold. Further, 58% of Indigenous adults reported that
financial hardship in the past year had impacted their overall health and well-being. For more
results from this study, please visit the Our Health Counts London website.
284.5 Newcomers
Poverty is more prevalent amongst newcomers living in London.
Number of Newcomers in London (City) Living Below the LIM-AT Threshold
A total of 11,595 newcomers (i.e. people who had been in Canada for five years or less) lived
in the city of London in 2015. Newcomers represented approximately 3.1% of London’s total
population in 2015.
Of all newcomers living in London in 2015, 6,395 (55.2%) were living in poverty according to
the LIM-AT. In comparison, 18.8% of the general population living in London were experiencing
poverty based on the LIM-AT in 2015.xxxii
Figure 12: Percent of Newcomers Living Below the LIM-AT Threshold – London (City) +
Ontario
In 2015, a higher proportion of newcomers were living below the LIM-AT threshold in London
(55.2%) compared to newcomers living in Ontario (35.6%).xxxiii, xxxiv
294.6 Recent and Established Immigrants
Poverty is experienced at a higher rate amongst recent immigrants and is lower
amongst established immigrants living in London.
Number of Recent and Established Immigrants in London (City) Living Below the LIM-AT
Threshold
In 2015, 72,170 recent and established immigrants were living in London, of which 10,270 were
recent immigrants (i.e. landed immigrants who had been in Canada for 6-10 years) and 61,900
were established immigrants (i.e. landed immigrants who had been in Canada for more than 10
years). Overall, recent immigrants represented 2.7% of London’s total population and established
immigrants represented 16.4% of London’s population in 2015.
Of the 72,170 recent and established immigrants living in London in 2015, 13,835 (19.2%) were
living in poverty according to the LIM-AT. Further, of the 10,270 recent immigrants living in
London, 3,685 (35.9%) had an income below the LIM-AT threshold in 2015 and 10,150 (16.4%) of
the 61,900 established immigrants had an income below the LIM-AT threshold.
Based on the LIM-AT, in 2015, a higher proportion of recent immigrants (35.9%) were living
in poverty compared to the general London population (18.8%). However, poverty was lower
amongst established immigrants (16.4%) than the general population living in London in 2015.xxxv,
xxxvi
Figure 13: Percent of Recent and Established Immigrants Living Below the LIM-AT
Thresholdin 2015 – London (City) + Ontario
The proportion of recent immigrants living below the LIM-AT threshold in 2015 was higher in
London (35.9%) compared to recent immigrants living in Ontario (23.7%). Further, London had a
slightly higher proportion of established immigrants with an income below the LIM-AT threshold
(16.4%) compared to all established immigrants in Ontario (14.0%) in 2015.xxxvii, xxxviii
304.7 Visible Minorities
Poverty is higher amongst Londoners who are part of a visible minority group.
Number of People Part of a Visible Minority in London (City) Living Below the LIM-AT
Threshold12
In 2015, 75,125 people living in London identified as belonging to a visible minority group,
representing 19.9% of London’s total population. Of those identifying as belonging to a visible
minority group, 26,260 (35.0%) were living in poverty based on the LIM-AT compared to 18.8% of
all Londoners.xxxix
Figure 14: Percent of People Part of a Visible Minority in London (City) Living Below the
LIM-AT Threshold by Visible Minority Group in 2015
The five largest groups represented within the 26,260 Londoners who were part of a visible
minority group and living below the LIM-AT threshold in 2015 were Arab (26.7%, n=7,015),
Chinese (15.4%, n=4,035), South Asian (15.2%, n=3,990), Black (13.2%, n=3,455), and Latin
American (9.0%, n=2,370).xl
12
The term “visible minority” is defined by the Government of Canada as “persons, other than Aboriginal peoples, who
are non-Caucasian in race or non-white in colour.” (Statistics Canada. 2020. Visible minority of person. Government of
Canada. https://www23.statcan.gc.ca/imdb/p3Var.pl?Function=DEC&Id=45152)
31Median After Tax Income for Visible Minorities in London (City)
Overall, the median after tax income for those belonging to a visible minority group in London
was $19,866 in 2015.xli
Figure 15: Median After Tax Income by Visible Minority Group in London (City) in 2015
The five visible minority groups living in London with the lowest median after tax income in
2015 included Korean ($14,185), Chinese ($14,396), Arab ($16,529), West Asian ($17,786), and
individuals identifying as belonging to multiple visible minorities ($19,863).xlii
32Section 5.0
What Does It Mean to Experience Poverty?
335.1 Income Inequality
Poverty can mean not having enough money to pay for basic needs.
Number of Londoners With a Lack of Money for Basic Goods and Services
Based on the Market Basket Measure, in 2015, 62,845 people living in the city of London did not
have enough income to meet the cost of living, meaning they were unable to afford a modest
basket of goods and services required to meet their basic needs.xliii
Figure 16: Percent of People Living Below the MBM Threshold – London (City) + Ontario
London
Ontario
In 2015, the percentage of people living with an income below the MBM threshold was higher in
London (16.6%) than in Ontario (13.9%).xliv That means that based on the MBM, 1 in 6 Londoners
are unable to cover their basic needs.
Market Basket Measure
Based on the Market Basket Measure (MBM), a family is considered to be living in poverty if they
do not have enough money to afford the goods and services they need to meet their basic needs
and standard of living in their community.
34Figure 17: How Income Is Spent by a Family of Four Purchasing a Modest Basket of Goods
in 2018
Based on the MBM, a family of four living in London in 2018 with an annual income of $37,799
would need to spend 30% ($11,386) of their annual income for adequate shelter, 29% ($11,045) to
maintain a healthy diet, and 26% ($9,941) to cover other expenses needed to maintain a minimal
standard of living. Further, they would need to spend nine percent ($3,282) of their annual
income on transportation and six percent ($2,145) on clothing.xlv
Poverty can mean having little money left after paying for food, shelter, and
clothing.
Number of Londoners Spending More for Food, Shelter, and Clothing
According to the LICO-AT threshold, in 2015, 43,855 people in the city of London were living with
low income, meaning they were spending more of their income on food, shelter, and clothing
than the average family in London.xlvi When people live with an income below the LICO threshold,
it means they are likely spending 63% or more of their after tax income on food, shelter, and
clothing.xlvii
Low Income Cut-Off
The Low Income Cut-Off (LICO) is the amount of income below which a family will likely need
to spend a larger portion of its income on necessities like food, shelter, and clothing than the
average family.
35Figure 18: Percent of People Living Below the LICO-AT Threshold – London (City) + Ontario
London
Ontario
In 2015, 11.6% of Londoners were living below the LICO-AT threshold compared to 9.8% of all
people living in Ontario.xlviii
Poverty can mean living with income significantly below the average.
Number of Londoners With Below Average Income
Based on the LIM-AT threshold, 71,025 residents in the city of London had low income and lived in
poverty in 2015.xlix For reference, a four-person family with an after tax income less than $44,704
in 2015 would be considered to be living in poverty based on the LIM-AT.l
Low Income Measure
According to the Low Income Measure (LIM), a family is living in poverty if their income is below
50% of the national median household income.
Figure 19: Percent of People Living Below the LIM-AT Threshold – London (City) + Ontario
London
Ontario
18.8% 14.4%
2015
36The proportion of the population living with low income in 2015 was higher in London (18.8%)
than in Ontario (14.4%) based on the LIM-AT.li That means that according to the LIM-AT,
approximately 1 in 5 people living in London are living with low income.
Figure 20: Low Income Entry Rates - London (CMA) + Ontario
The low income entry rate is based on tax filer data and represents the number of people who
were not considered to have low income the year before, but then enter low income in a given
year. Overall, the percentage of Londoners entering low income each year has decreased from
3.7% in 2012-2013 to 3.3% in 2017-2018. Further, the low income entry rate has continued to be
lower in London than in Ontario.lii
Figure 21: Low Income Exit Rates – London (CMA) + Ontario
Similarly, the low income exit rate refers to the number of people who filed taxes that were
considered to have low income the year before, but then exit low income in a given year.
Overall, in both London and Ontario, the percentage of people exiting low income increased
between 2012 and 2018. In London specifically, the low income exit rate increased from 23.6%
in 2012-2013 to 29.3% in 2017-2018. Further, while the low income exit rate has increased in
London, it has remained consistently lower than the low income exit rate in Ontario.liii
37Poverty can mean experiencing income inequality.
Figure 22: Income Gap Between Low Income and All Families in London (CMA) – Median
After Tax Income
Since 2012, on average, London’s low income families (i.e. families living with an income below
the CFLIM-AT threshold) have been making less than a third of the income of the general
population. The gap in income between low income families and all families has grown by 13.0%
since 2012, which represents an increase of $4,260. Further, this income gap has grown over time
at an average rate of 2.2% per year.liv, lv
Figure 23: Income Gap Between the Top and Bottom 10% of Earners in London (CMA) –
Median After Tax Income
A comparison of the median after tax income made by Londoners in the bottom 10% and top
10% of earners shows that the income gap between these two groups is growing by an average
of 2.0% each year. Between 2012 and 2018, the income gap between the bottom and top 10% of
earners grew by $7,200, which represents a total increase of 12.3%.lvi
38Poverty can mean not having a stable income, limiting the ability to participate
fully in society.
Figure 24: Number of Londoners Receiving Social Assistance – Cases + People
The number of social assistance cases (i.e. households receiving OW or ODSP) increased by 14.4%
between 2014 and 2019, meaning 3,770 more households required social assistance in 2019
than in 2014. Further, the number of Londoners receiving social assistance increased by 18.9%
between 2014 and 2019, from 40,201 people in 2014 to 47,800 people in 2019.lvii
According to population counts, the city of London’s total population increased by 5.4% during
the same time period. This indicates the social assistance caseload is outpacing London’s
population growth. Further, approximately 10.6% (n=40,201) of all people living in London
received social assistance in 2014 compared to 12.0% (n=47,800) in 2019, demonstrating that
overall, an increasing number of Londoners are relying on social assistance.lviii
Figure 25: Average Number of Days to Determine Social Assistance Eligibility – OW + ODSP
OW ODSP
5 5 4 4 5 3
19 50 31 24 23 25
2014 2015 2016 2017 2018 2019
39In 2019, the average number of days Londoners had to wait before receiving a decision about
their eligibility for social assistance was three days for OW and 25 days for ODSP. Overall, the
length of time to determine eligibility for OW has decreased from five days in 2014 to three days
in 2019. For ODSP, the wait time has varied each year with an overall increase from 19 days in
2014 to 25 days in 2019.lix
Figure 26: Average Number of Months Londoners Receive Social Assistance – OW + ODSP13
The average length of time Londoners required social assistance increased for both OW and
ODSP between 2014 and 2019. Specifically, the average length of time households received OW
increased from 25 months (just over 2 years) in 2014 to 38 months (just over 3 years) in 2019,
an increase of 52% (13 months). Further, households on the ODSP caseload received assistance
for 118 months (approximately 9 years and 10 months) in 2014, which increased to 124 months
(approximately 10 years and 4 months) in 2019, representing a 5.1% (6 month) increase.lx
Figure 27: Average Number of Social Assistance Cases With Employment Earnings
13
The length of time individuals have been receiving social assistance refers to the cumulative number of months
households on the caseload each year have received assistance.
40Since 2014, the percentage of social assistance cases with employment earnings has increased
for both OW and ODSP. In 2014, on average, 12.2% (n=1,357) of OW cases had reported
employment earnings, which increased to 14.2% (n=1,617) of all OW cases in 2019. For ODSP, the
percentage of cases with income from employment increased from 10.8% (n=1,622) in 2014 to
11.2% (n=2,068) in 2019.lxi
Figure 28: Level of Unemployment in London Region14
There has been an overall downward trend in London’s unemployment rate between 2012 and
2019, with 2019 seeing the lowest unemployment rate in the past eight years. Specifically, the
percentage of Londoners without employment decreased from 8.0% (n=28,064) in 2012 to 5.3%
(n=18,815) in 2019. Further, in 2019, London’s unemployment rate was lower than the overall
unemployment rate in Ontario.lxii
Indigenous Adults Experience Higher Rates of Unemployment
The “Our Health Counts Survey” conducted by SOAHAC found that Indigenous adults are
disproportionately impacted by unemployment. Specifically, in 2015, 56% of Indigenous adults
aged 15 and older in London were unemployed compared to 5.9% of adults in London and 6.8%
of adults in Ontario. For more results from this study, please visit the Our Health Counts London
website.
Number of Londoners Part of the Working Poor
Working poor refers to adults 15 years or older that are employed full-time or part-time and have
an after tax income below the LIM-AT, meaning they are working, but are still living in poverty.
In 2015, 26,085 adults living in London were considered to be part of the working poor,
representing 9.8% of the workforce. Further, a higher proportion of Londoners were part of the
working poor compared to Ontario, where 8.7% of the population was part of the working poor in
2015.lxiii
14
This data represents the London Economic Region, which includes Elgin, Middlesex, and Oxford Counties.
41More Indigenous Adults Are Part of the Working Poor Than the General Population
According to the “Our Health Counts Survey” conducted by SOAHAC, 76% of employed
Indigenous adults in London lived at or below the LICO-BT threshold in 2015, indicating they were
part of the working poor. Based on the LICO-BT, the proportion of people part of the working
poor was significantly higher amongst Indigenous adults compared to the general population in
London (8.4%) and Ontario (8.6%). For more results from this study, please visit the Our Health
Counts London website.
5.2 Food Insecurity
Poverty can mean not having enough money to eat a healthy diet and not having
enough food to eat.
Rate of Food Insecurity
According to data provided by the Middlesex-London Health Unit, approximately 1 in 7 Middlesex-
London households experienced food insecurity, meaning they didn’t have enough money or
the ability to access food that was nutritious, adequate, and deemed culturally acceptable by the
individual or household.lxiv
Percent of Income Required for Adequate Food
Based on the MBM, in 2018, a family of four living in a city the size of London with an income of
$37,799 would need to spend 29% of their annual income in order to be able to eat a nutritious
basket of food, which is equivalent to $11,045 a year.lxv
Figure 29: Average Number of Households Accessing the London Food Bank Each Month
42Overall, between 2016 and 2019, the average number of households that accessed the London
Food Bank each month decreased by 4.7%, from 3,454 households per month in 2016 to 3,293
households per month in 2019. This represents a decrease of an average of 161 households each
month. The highest monthly average occurred in 2018 with 3,523 households visiting the London
Food Bank each month.lxvi
Figure 30: Total Number of Households and Individuals Assisted by the London Food Bank
Each Year
# of Households # of Individuals
11,119 24,604 10,902 24,570 10,477 24,921 10,673 25,439
2016 2017 2018 2019
While the total number of unique households assisted by the London Food Bank decreased
overall between 2016 and 2019 by 4.0% (446 households), the total number of unique individuals
receiving support from the London Food Bank increased by 3.4% (835 people). This shift may
have occurred as a result of an increase in bigger households (i.e. households with more people)
accessing the food bank.lxvii
Figure 31: Age of Individuals Assisted by the London Food Bank Each Year
Between 2017 and 2019, people aged 18 years old or younger (i.e. children and youth) remained
the largest age group served by the London Food Bank. Further, an increasing proportion of
individuals assisted by the food bank are children and youth and older adults aged 60 or older.lxviii
43Figure 32: Number of Times Households Visited the London Food Bank Each Year
Overall, the number of visits made by unique households to the London Food Bank remained
fairly consistent between 2016 and 2019, with approximately one-third of households visiting the
London Food Bank only one time and two-thirds visiting two or more times.lxix
Figure 33: Average Number of Visits Made by Households to the London Food Bank Each
Year
The average number of times households visited the London Food Bank remained fairly
consistent at approximately four visits per household between 2016 and 2019.lxx
Figure 34: Percent of Households Accessing the London Food Bank for the First Time15
In both 2018 and 2019, for 27% of households, it was their first time receiving assistance from the
London Food Bank, while 73% of households had accessed the food bank before.lxxi
15
Reporting related to the number of people accessing the London Food Bank for the first time started in 2018.
445.3 Housing Instability
Poverty can mean not having enough money to pay for adequate shelter.
Figure 35: Total Number of Londoners Accessing Emergency Shelter Each Year
Overall, the total number of unique individuals accessing emergency shelter in London each year
has decreased by 34.1%, from 3,249 people in 2012 to 2,142 people in 2019.lxxii This means 1,107
fewer people accessed an emergency shelter in 2019 compared to 2012.
Figure 36: Annual Emergency Shelter Occupancy Rate
Occupancy rate refers to the ratio of the number of emergency shelter beds that are occupied
compared to the total number of beds that are available. The annual occupancy rate of London’s
emergency shelters increased between 2014 and 2019, from 90% in 2014 to 111% in 2019.
Further, the highest occupancy rate of 122% occurred in 2018. An occupancy rate over 100%
means emergency shelters are operating over capacity.lxxiii
45You can also read