Powertrain Plus Driving Conditions Impact on Fuel Economy
←
→
Page content transcription
If your browser does not render page correctly, please read the page content below
AEA – Brazilian Society of Automotive Engineering - SIMEA 2021

         Powertrain Plus Driving Conditions Impact on Fuel Economy
                                                                                              MSc. Fernando Fusco Rovai
                                                                                         VW do Brasil / Centro Universitário FEI

ABSTRACT
                                                                        Olmos, A. et. all [4] compared energy efficiency of a
    Energy management and vehicle fuel economy are                   vehicle on different laboratory cycles and on real drive
important automotive development drivers besides ambient             cycles.
emissions. Many technologies and solutions are being
proposed, compared and improved. Any solution demands                    Vehicle technologies are improving so fast. Regarding
expensive resources to be tested and sometimes even the              vehicle powertrain, many engines and transmissions
most accurate experimental arrangement is not enough to              combinations are possible. A conventional internal
prove its effectiveness. In this scenario numerical simulation       combustion engine can be combined to a variety of
represents an important and reliable tool to make sure even          transmission concepts, from manual to automatic. These
very small improvements, very difficult to be measured,              combinations result in different vehicle energy efficiency.
could be honestly compared. Considering that a vehicular             The engine global efficiency map shows that energy
solution could be more efficient depending on drive cycle            conversion efficiency varies with engine speed and torque.
this paper compares, by numerical simulations, the impact of         This conversion efficiency is affected by combustion effects,
vehicle powertrain plus driving conditions on a passenger car        friction, volumetric efficiency and component temperature
fuel economy. From powertrain side different transmissions,          limits.
manual (5 and 6 speed) and automatic (6 speed: dual clutch,
torque converter and CVT), are compared. From driving                    The drive cycle the vehicle is driven, according to vehicle
conditions side different test cycles (FTP75, HWY, NEDC              transmission, defines the instantaneous engine speed and
and WLTC) and vehicle loads (unloaded 1000 kg vehicle and            torque, and consequently the vehicle energy consumption, at
loaded 1500 kg vehicle) are compared.                                each cycle instant. Real life drive cycles have infinite
                                                                     possibilities, which are unviable to be reproduced. Many
INTRODUCTION                                                         standard drive cycles were defined and adopted to represent
                                                                     and approach the real life.
    Vehicle fuel economy will always be an important
research and development driver, besides emissions. Many
variables affect vehicle fuel consumption. Some of these
variables refer to vehicle concept and technology. Other
variables depends on the way the vehicle is driven.

    Hirano, Miller and Schneider [1] compared performance
and fuel economy of different transmissions in the same
vehicle on specific cycles and constant speeds. In this study
the CVT efficiency was measured below 90 percent on
electric dyno bench. CVT results were close to a 5 speed
manual transmission on fuel consumption and much better
than a 3 speed conventional automatic transmission.

    Wagner, Remmlinger and Fischer [2] compared
performance and fuel economy of a 6 speed conventional
automatic to a continuously variable transmission in the
same vehicle. In this study the continuously variable
transmission resulted in better performance for the same
vehicle fuel consumption.

    Patel, Ely and Overson [3] studied continuously variable         Figure 1. Simulated drive cycles comparison
transmission variables like shift speed and torque converter
lockup impact on performance feel.

(Allowed reproduction with source mention: AEA – Simpósio Internacional de Engenharia Automotiva – SIMEA 2021 – São Paulo, Brasil)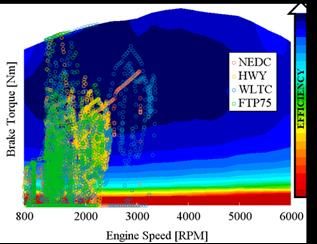
AEA – Brazilian Society of Automotive Engineering - SIMEA 2021

   Figure 1 shows the vehicle speed and displacement
profiles along time of the four drive cycles simulated and
compared in this study. Vehicle average power and engine
average global efficiency varies with drive cycle.

    The dynamic numerical 1-D simulation of a 5 speed
manual transmission vehicle along the four drive cycles
considered in this study resulted the operation points plotted
in Figure 2. The operation points of each drive cycle are plot
in a specific color. The plotted points demonstrate that
engine is not used in its best efficiency on these drive cycles.
As studied and demonstrated by Rovai [5], the best in-cycle            Figure 3. 1-D simulation GT-DRIVE® model
fuel economy is achieved operating the engine in its best
efficiency during accelerations (higher torque) but on lower               A compact passenger car was simulated considering the
engine speeds and efficiency during cruise and lower torque            drag force coefficients in Table 1. Two vehicle mass were
conditions.                                                            simulated, the unloaded (1000 kg) and the loaded (1500 kg)
                                                                       vehicle, according to NBR6601 inertia classes [6]. The
                                                                       vehicle load in practice affects drag force coefficients but in
                                                                       this study, for simplification, the same drag coefficients were
                                                                       considered for both vehicle loads.

                                                                       Table 1. Vehicle drag coefficients

                                                                           This vehicle was equipped with a four stroke, spark
                                                                       ignition, naturally aspirated internal combustion engine. All
                                                                       the engine characteristics like torque curve, global efficiency
                                                                       map, idle speed and idle control were exactly the same for
                                                                       all simulated cases. This vehicle was simulated considering
Figure 2. Engine in-cycle operating points                             engine running and idle fuel consumption when vehicle is
                                                                       stopped. The hydraulic pump required by automatic
    This paper compares the influence of the transmission              transmissions were not considered in this study.
concept on consumed fuel of a vehicle on different drive
cycles for unloaded and loaded vehicle. The transmissions                 The simulated transmission concepts are:
were simulated considering 100% efficiency. This
comparison is possible through numerical simulation but it             - 5 gear dry clutch manual transmission (MC5)
is considerable difficult, and expensive, to be done                   - 6 gear dry clutch manual transmission (MC6)
experimentally. Simulation absolute uncertainty is minored             - 6 gear dual clutch automatic transmission (DC)
is this study because it is based on comparative results. The          - 6 gear torque converter automatic transmission (TC)
performed simulations assess the transmission concept                  - Dual clutch continuously variable transmission (DC CVT)
influence on engine speed and torque and finally on vehicle            - Torque converter continuously variable transmission (TC
fuel economy.                                                          CVT)

                                                                           Table 2 indicates the considered final transmission ratios
NUMERICAL SIMULATION                                                   as V1000 that means vehicle speed to each 1000 rpm engine
                                                                       speed. The 6th gear is added for all transmission concepts and
    The GT-DRIVE® software from Gamma Technologies                     the automatic transmissions were simulated only in this
was used to perform the 1-D dynamic drive simulations.                 configuration. The gear ratios are exactly the same for all
Figure 3 illustrates the main vehicle mathematical model. To           transmission concepts. The relation between the extreme
assure the reliable comparison between simulation results the          gear ratios is defined as transmission ratio spread. The CVT
vehicle, engine, driver and ECU parts are exactly the same             transmission was simulated with the same transmission ratio
for all cases. The only differences considered were the                spread of the 6 gear versions, varying linearly from the 1st do
transmission concept and its control unit (TCU).                       the 6th gear ratio. Higher gear ratio spreads could improve
                                                                       both fuel economy and ramp gradeability.

                                                                   2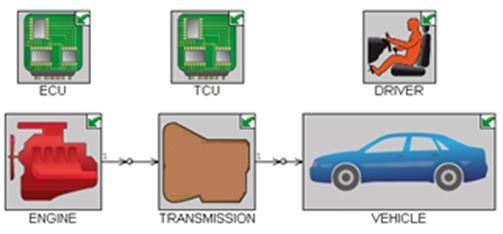
AEA – Brazilian Society of Automotive Engineering - SIMEA 2021

Table 2. Vehicle speed per gear ratio and engine speed

                                                                      Figure 5. Shift strategy for CVT concepts

    Gear shift strategy is a very significant variable for fuel
consumption. The simulated shift strategy follows the gear
shift indicator (GSI), studied by Rovai [5], and extended to
6th gear in this study, as shown in Figure 4.

                                                                      Figure 6. Simulated CVT shift speed time constants

                                                                          The performed simulations consider neutral gear for
                                                                      vehicle stopped with brake pedal pressed. This definition is
Figure 4. Shift strategy for 5 and 6 gear concepts                    important to avoid fuel consumption penalty in this condition
                                                                      for the concepts equipped with torque converter.
    Despite the standard defined shift points of NEDC, the
optimized GSI shift strategy was considered even on NEDC                  The torque converter adopted in some automatic
simulated cycle in this study in order to compare the four            transmission concepts was simulated based on two
drive cycles in its best vehicle efficiency.                          characteristics [7]: the capacity factor (KCAP) that is a torque
                                                                      and speed relationship and the torque ratio (KTR) that is a
   The gear shift time, which affects slightly fuel economy,          transmission and engine torque relationship, according to
was adjusted in 1 second for manual transmissions and in 0,5          Equations 1 and 2, respectively:
second for automatic transmissions.

    Continuously variable transmission concepts follows the
same GSI strategy in terms of fuel consumption
optimization. In this transmission concept the shift speed is                                                      (1)
defined or limited by a time constant. Figure 5 shows the
shift strategy applied to continuously variable transmissions.
Differently from Figure 4, in Figure 5 the gear ratio varies
linearly and continuously between the extremes.                                                                    (2)

    The continuously variable transmission shift speed was            where:
represented in this study by the shift time constant. Three                    wENG = engine speed output [RPM]
different time constants of 1, 2 and 5 seconds were compared                   TENG = engine torque output [Nm]
in this study. Higher time constants implies in lower                          TTRANS = transmission torque input [Nm]
transmission shift speed as shown in Figure 6.

                                                                  3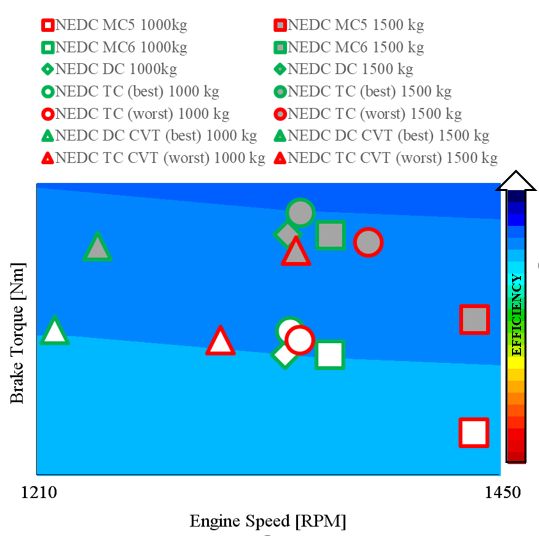
AEA – Brazilian Society of Automotive Engineering - SIMEA 2021
The combination of capacity factor and torque ratio the impact of three lockup speeds: 1200, 1500, 1800 rpm and
defines the torque converter behavior in terms of torque a lockup off condition in which lockup was disabled.
response and drive comfort. Two extreme torque converters
were simulated from intermediate capacity factor and torque The design of experiments of the performed simulations
ratio values. The HARD torque converter was defined with are detailed in Figure 9. These simulations were performed
twenty five percent lower capacity factor and twenty five for unloaded (1000 kg) and loaded (1500 kg) vehicle on
percent higher torque ratio from intermediate values, which FTP75, HWY, NEDC and WLTC drive cycles resulting in
resulting in better drive response. The SOFT torque 304 simulations.
converter was defined with twenty five percent higher
capacity factor and twenty five percent lower torque ratio The fuel consumption is numerically integrated along
from intermediate values, resulting in better drive comfort. drive cycle in steady-state steps. Cold phase impact was not
These proposals are illustrated in Figure 7. considered in this study.
Torque Lockup CVT time
Ge arse t Clutch
Conve rte r [rpm] constant [s]
5 MC
MC
DC
1200
1500
SOFT
1800
6
OFF
TC
1200
1500
HARD
1800
OFF
1
DC 2
Figure 7. Simulated torque converter behavior 5
1
The dynamic response of these two simulated torque
1200 2
converters is shown in Figure 8. During extra urban phase of
NEDC cycle, for example, the SOFT torque converter (in 5
red) is much more slippery than the HARD torque converter 1
(in blue) during vehicle accelerations. The comparison 1500 2
shown in Figure 8 was simulated without lockup for better 5
demonstration. SOFT
1
1800 2
5
1
CVT OFF 2
5
TC
1
1200 2
5
1
1500 2
5
HARD
1
1800 2
5
Figure 8. Torque converter dynamic response
1
OFF 2
The lockup strategy is another important variable for 5
torque converters. This strategy avoids the torque converter Figure 9. Simulation DOE
to slip above a defined engine speed. This study simulated
4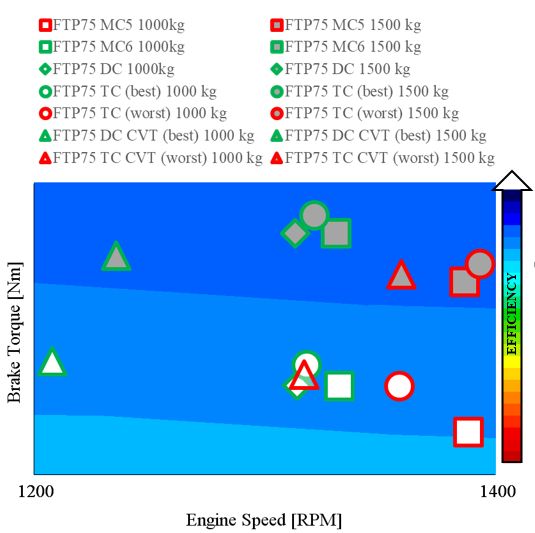
AEA – Brazilian Society of Automotive Engineering - SIMEA 2021

RESULTS AND ANALYSIS
                                                                     While HWY and NEDC cycles presented around
TORQUE CONVERTER IMPACT ON FUEL ECONOMY                          maximum 15 percent penalty on fuel consumption, FTP75
                                                                 and WLTC presents higher than 25 percent for SOFT
    The SOFT and HARD versions of torque converter and           version. These results demonstrates that more dynamic drive
its lockup impact on fuel consumption, for both unloaded         cycles in terms of accelerations and gear shifts are more
and loaded vehicle, are shown on Figures 10 to 13. The           affected by torque converter slip and lockup speed. The
lockup speeds were simulated in 1200, 1500 and 1800 engine       simulations resulted in considerable higher impact of SOFT
rpm and in the worst case lockup was turned off.                 torque converter on loaded vehicle, especially for 1800 rpm
                                                                 converter lockup and lockup off, which was not too
    The simulated cycles resulted in low vehicle load            significant with HARD torque converter.
influence on fuel consumption for HARD torque converter.
The penalty on fuel economy of SOFT torque converter                 The fuel economy results are slightly better with SOFT
increases with lockup speed. This behavior makes sense           torque converter for 1200 rpm lockup. Specifically on low
because the lower lockup speeds reduces significantly the        engine speed conditions the more slippery torque converter
torque converter slip, which is more significant in SOFT         resulted in better engine efficiency and lower fuel
version.                                                         consumption.

Figure 10. Torque converter impact on FTP75                      Figure 12. Torque converter impact on NEDC

Figure 11. Torque converter impact on HWY                        Figure 13. Torque converter impact on WLTC

                                                             5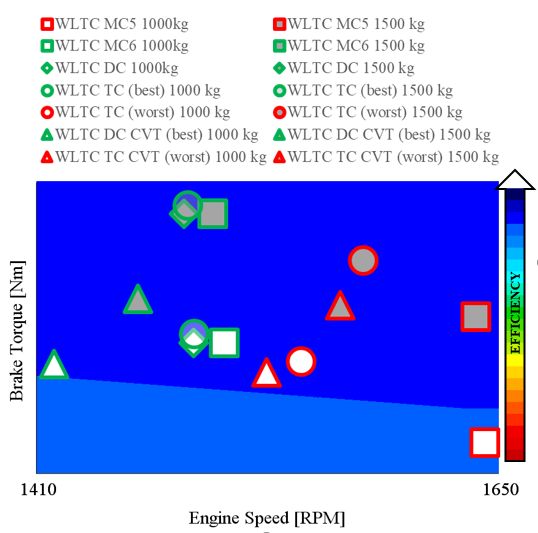
AEA – Brazilian Society of Automotive Engineering - SIMEA 2021

CVT SHIFT SPEED IMPACT ON FUEL ECONOMY
                                                                     The time constant of 1, 2 and 5 seconds impact are
   The impact of CVT shift speed time constant on fuel           presented for the simulated drive cycles. The simulated
consumption is shown from Figure 14 to Figure 21. The            clutch (DC, SOFT and HARD torque converters) and lockup
unloaded vehicle results are presented on the left and the       (1200, 1500, 1800 rpm and lockup off) of CVT
loaded vehicle results on the right for any drive cycle.         configurations are plotted.

Figure 14. Time constant impact on unloaded FTP75                Figure 16. Time constant impact on loaded FTP75

Figure 15. Time constant impact on unloaded HWY                  Figure 17. Time constant impact on loaded HWY

                                                             6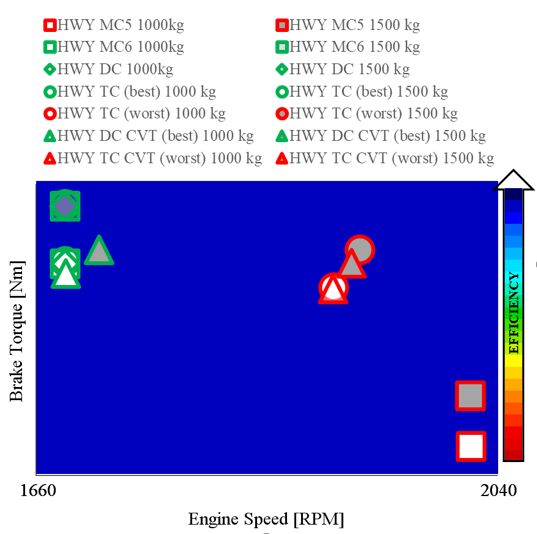
AEA – Brazilian Society of Automotive Engineering - SIMEA 2021

Figure 18. Time constant impact on unloaded NEDC                   Figure 20. Time constant impact on loaded NEDC

Figure 19. Time constant impact on unloaded WLTC                   Figure 21. Time constant impact on loaded WLTC

    The results show quite similar shift speed time constant           On the other cycles, more dynamic than HWY, higher
influence on the simulated drive cycles for the two vehicle        time constant increases fuel consumption especially and
load conditions.                                                   linearly for DC with 1200 rpm lockup.

    The lowest time constant impact occurred in HWY that               Higher lockup engine speeds are less sensitive to CVT
is a cycle with more constant speeds and mostly performed          shift speed time constant.
at lowest transmission ratio.

                                                               7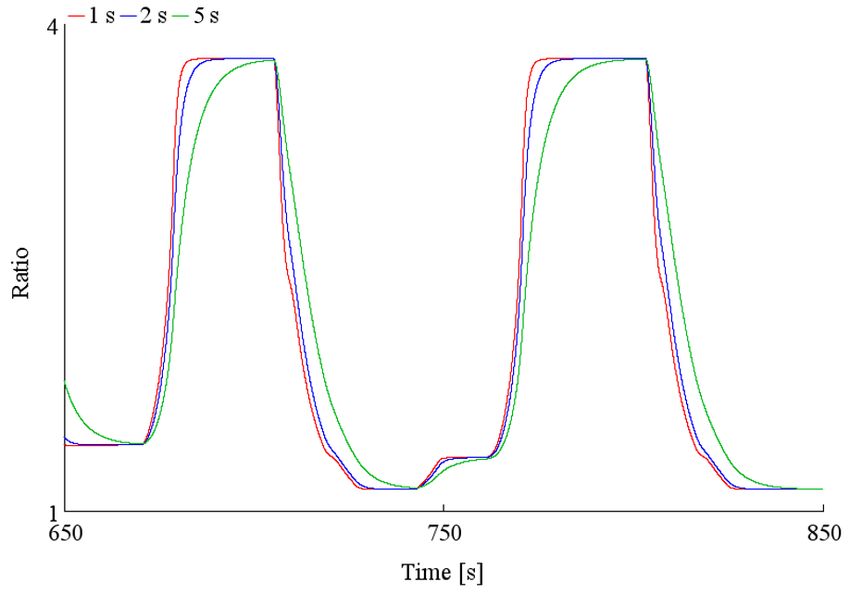
AEA – Brazilian Society of Automotive Engineering - SIMEA 2021

   Torque converter characteristics, SOFT or HARD,                        The results for loaded vehicle (1500 kg) are shown on
presented similar penalty on fuel economy for the simulated           Figure 23. The dual clutch CVT advantage are more
time constants and vehicle loads.                                     significant in this condition. The six gear transmissions
                                                                      require downshifts to the 5th or lower discrete gears while
   Lockup speed influence is noticeable in all cycles and             CVT could run on intermediate, and more efficient, gear
conditions but more significant for SOFT torque converter.            ratios. The SOFT torque converter and higher lockup speeds
                                                                      impacts are more pronounced for loaded vehicle. The more
    The best results were verified with DC clutch and 1               dynamic cycles, FTP75 and WLTC, presented more
second shift speed time constant. The results of SOFT and             variations due to frequent vehicle accelerations and
HARD torque converters with 1200 rpm lockup are quite                 downshifts.
similar and slightly higher than the results with DC.
Sometimes the SOFT torque converter presented better
efficiency than HARD version with 1200 rpm lockup,
similarly as observed and explained with torque converter
automatic transmission, but less pronounced due to CVT
transmission ratio variation during vehicle accelerations.

DRIVE CYCLE IMPACT ON FUEL ECONOMY

    Figure 22 shows the comparative results for unloaded
vehicle (1000 kg). All the results are relative to MC5 version.
The reduction on fuel consumption of a 6th gear is evident
and more pronounced on HWY due to higher cycle speeds in
which 6th gear ratio are mostly used. The dual clutch
configuration is more economical than manual clutch due to
its lower shifting time and reduced engine speed during
clutch modulation. The torque converter versions could
achieve reduction on fuel consumption similar to manual
clutch when adopting 1200 rpm lockup. But with SOFT
torque converter and higher lockup speeds the penalty on              Figure 23. Fuel economy impact on loaded vehicle
fuel economy are very significant, mainly on more dynamic
drive cycles, achieving up to 22 % higher fuel consumption.
The best result was achieved with dual clutch and CVT with                Another analysis regarding drive cycle and vehicle load
one second shift speed time constant. The SOFT torque                 influences is shown on Table 3. As the best results in terms
converter and the higher lockup speeds affect CVT                     of fuel economy were achieved with unloaded vehicle on
negatively, resulting in up to 20% higher fuel consumption.           HWY this condition was adopted as reference for any
                                                                      transmission concept.

                                                                          The worst and the best results of torque converter
                                                                      automatic transmissions (TC) are presented. For these
                                                                      applications the best results were achieved with 1200 rpm
                                                                      lockup and the worst results were achieved with SOFT
                                                                      torque converter and lockup off. The continuously variable
                                                                      transmissions with faster shift speed presented the best
                                                                      results with dual clutch (DC CVT). Continuously variable
                                                                      transmission coupled to torque converter (TC CVT)
                                                                      presented better results for 1200 rpm lockup and worse
                                                                      results for SOFT torque converter and lockup off.

                                                                          Table 3 presents the highest fuel consumption in WLTC
                                                                      for any vehicle load and transmission configuration. The
                                                                      vehicle load impact on HWY is much lower than in the other
                                                                      cycles. DC CVT presents some advantage over the best TC
                                                                      CVT only on FTP75 and unloaded vehicle and on WLTC
                                                                      and loaded vehicle. Torque converter slip and lockup
                                                                      impacts are confirmed on FTP75 and WLTC cycles,
Figure 22. Fuel economy impact on unloaded vehicle                    pronounced on loaded vehicle.

                                                                  8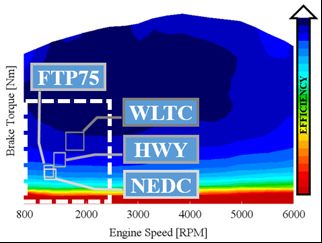
AEA – Brazilian Society of Automotive Engineering - SIMEA 2021

Table 3. Fuel consumption factors                                    the lowest ones. HWY cycle demands intermediate average
                                                                     engine speed and torque envelope and WLTC represents the
                                                                     highest envelope in terms of engine speed and torque
                                                                     averages. According to the engine efficiency scale of Figure
                                                                     24 the simulated cycles are outside the best engine efficiency
                                                                     condition.

                                                                         The average envelopes for the simulated cycles are
                                                                     detailed from Figure 25 to Figure 28. The TC CVT best
                                                                     configuration presented on Table 3 is not considered in this
                                                                     analysis. The transmission configurations are plotted with
                                                                     different marker type. The MC6, DC, TC and CVT best
                                                                     options are plotted in green lines and its worst options are
                                                                     plotted in red lines. Simulations of loaded vehicle (1500 kg)
                                                                     are plotted in gray filled marks and the unloaded vehicle
                                                                     (1000 kg) results are plotted in white filled marks.

                                                                         FTP75 results in Figure 25 shows a clear difference
                                                                     between unloaded and loaded vehicle. The MC5 version
                                                                     presented higher average engine speeds due to the narrow
                                                                     transmission ratio spread. The DC CVT resulted in lowest
                                                                     average engine speeds. The worst CVT results has higher
                                                                     average engine speed and slightly lower average engine
                                                                     torque than the best ones. The MC6, DC and the best TC
                                                                     transmissions average engine speeds do not change with
                                                                     vehicle load. The CVT and the worst TC versions runs on
                                                                     higher average engine speeds for higher vehicle loads. The
AVERAGE ENGINE SPEED AND TORQUE ANALYSIS                             better results of DC CVT presented on Figures 22 and 23 are
                                                                     explained by lower average engine speeds on Figure 25.
    It is difficult to compare all the engine operating points
along drive cycle on the engine map, as shown on Figure 2.
Alternatively, the average of in-cycle engine speed and
torque can be precisely positioned on engine map.

    The simulated engine speed and torque averages are
located in a narrow engine global efficiency region shown
inside white dotted lines on Figure 24.

                                                                     Figure 25. FTP75 averages envelope

                                                                         HWY results are plotted in Figure 26. In this drive cycle
Figure 24. Average simulation results on engine map                  the transmission ratio spread makes big difference. The MC5
                                                                     transmission runs on considerable higher engine average
    Average engine speed and torque for unloaded and                 speeds. Even the worst TC and CVT options could run in
loaded vehicle of simulated cycles are placed inside                 lower engine average speeds than MC5. The best
rectangular cycle envelopes indicated on Figure 24. FTP75            configurations for fuel consumption presented quite the same
and NEDC engine speed and torque average envelopes are               average engine speeds. Some difference was noticed on

                                                                 9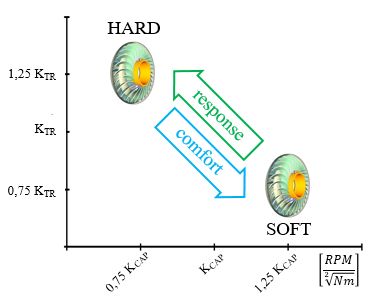
AEA – Brazilian Society of Automotive Engineering - SIMEA 2021

loaded vehicle in which the DC CVT could run on low                       In NEDC cycle the worst CVT configurations are close
average engine speed than DC and TC configurations. The               to the best TC, DC and MC6 options. The DC CVT could
worst TC and CVT configurations presented the lowest                  perform the cycle in considerable lower average engine
penalty on fuel economy than in the other drive cycles. It can        speed. The disadvantage of the worst TC and CVT results in
be explained by the more constant speeds and consequently             this drive cycle is narrow than the disadvantage verified in
less influence of torque converter slip.                              FTP75 and WLTC cycles.

                                                                          WLTC results are presented in Figure 28. This cycle
                                                                      demands more dynamic accelerations, high vehicle speeds
                                                                      and downshifts than the other simulated cycles. In these
                                                                      conditions the DC CVT presented significant advantage. The
                                                                      torque converter slip influence is similar in WLTC and in
                                                                      FTP75. The higher average engine speed of MC5
                                                                      applications, due to its lower transmission ratio spread, is
                                                                      evident. The vehicle load impacts more significantly MC6,
                                                                      DC and TC engine average torque than any CVT.

Figure 26. HWY averages envelope

    NEDC results are presented in Figure 27. This drive cycle
resulted on largest DC CVT advantages. As observed on
FTP75, on NEDC the engine average torque difference is
clear between unloaded and loaded vehicle. The MC5
reduced transmission ratio spread impact is increased by the
extra urban phase.

                                                                      Figure 28. WLTC averages envelope

                                                                      CONCLUSIONS

                                                                          The results confirm that vehicle fuel economy is
                                                                      significantly affected by many variables: vehicle load, drive
                                                                      cycle and powertrain configuration. The powertrain
                                                                      configuration is defined by the internal combustion engine
                                                                      and the transmission configuration, which determines the
                                                                      engine operating point on its efficiency map along the drive
                                                                      cycle. The integration of the instantaneous engine fuel
                                                                      consumption along the drive cycle results in calculated in-
                                                                      cycle fuel economy. The objective of this study is to compare
                                                                      the influence of these different variables on the efficiency of
                                                                      exactly the same vehicle, which is almost impossible
                                                                      experimentally. The transmission efficiency differences,
                                                                      according to Naunheimer, H. et. all [8], were not considered
                                                                      in this study.

Figure 27. NEDC averages envelope                                         Numerical simulations pointed up to 5% fuel economy
                                                                      increasing transmission ratio spread, which can be achieved

                                                                 10
AEA – Brazilian Society of Automotive Engineering - SIMEA 2021
adding a 6th gear in a conventional five speed gearbox. calibration instructor at AEA. Contacted by:
Expressive 24% reduction in fuel consumption can be fusco800@hotmail.com
obtained using a less comfortable torque converter in an
unloaded vehicle. The economy provided by the torque
converter characteristic could increase up to 36% in a loaded ACKNOWLEDGMENTS
vehicle. Continuously variable transmissions are expected to
achieve the best fuel economy results due to probable higher The author would acknowledge Volkswagen do Brasil
engine residence time around the best efficiency region of and Centro Universitário FEI for the support and the
the map. The CVT shift speed limitation does not allow the opportunity to develop this study.
engine to run continuously on its best efficiency along a
dynamic drive cycle. In this study, the CVT shift speed was
simulated varying time constant from 1 to 5 seconds, which DEFINITIONS / ABBREVIATIONS
represented about 6% penalty in fuel consumption.
CVT Continuously Variable Ratio Automatic
Except for the fastest simulated CVT shift speed, there Transmission
was no very significant fuel economy advantages of a
continuously variable transmission over an optimized six FTP75 EPA75 Federal Test Procedure
gear automatic transmission in this study.
HWY EPA Highway Fuel Economy Test
REFERENCES NEDC New European Driving Cycle
1. Hirano, S., Miller, A. L. and Schneider, K. F. "SCVT – A State WLTC Worldwide Harmonized Light Vehicles Test
of the Art Electronically Controlled Continuously Variable Cycles
Transmission," SAE Technical Paper 910410, 1991.
2. Wagner, G., Remmlinger, U. and Fischer, M. "CFT30 – A
ECU Engine Control Unit
chain Driven CVT for FWD 6 Cylinder Application," SAE
Technical Paper 2004-01-0648, 2004,
https://doi.org/10.4271/2004-01-0648. TCU Transmission Control Unit
3. Patel, D., Ely, J. and Overson, M. "CVT Drive Research
Study," SAE Technical Paper 2005-01-1459, 2005, MC5 5 gear Manual Clutch and Transmission
https://doi.org/10.4271/2005-01-1459.
4. Olmos, A., Banhara, R., Engler Pinto, C.,and Georges, M. MC6 6 gear Manual Clutch and Transmission
"Emissions, fuel economy and energy consumption of a flex
fuel vehicle in different drive cycles," SAE Technical Paper DC Dual Clutch on Automatic Transmission
2018-36-0225, 2018, https://doi.org/10.4271/2018-36-0225.
5. Rovai, F., "Right Shifting for Fuel Economy," SAE Technical
Paper 2019-36-0095, 2019, https://doi.org/10.4271/2019-36- TC Torque converter on Automatic Transmission
0095.
6. ABNT NBR6601, “Light road vehicles – Determination of DC CVT Dual Clutch on a CVT
hydrocarbon, carbon monoxide, nitrogen dioxide, carbon
dioxide and particulate material on exhaust gas,” NORMA TC CVT Torque Converter on a CVT
BRASILEIRA, Rev. 2012, ISBN 978-85-07-03739-2.
7. SAE International, “Design practices – passenger car V1000 Vehicle Speed per 1000 rpm Engine
automatic transmissions,” Library of Congress Cataloging-in-
Publication Data, 4th ed., 2012, https://doi.org/10.4271/AE-29.
GSI Gear Shift Indicator
8. Naunheimer, H., Bertsche, B., Ryborz, J., Novak, W.,
"Automotive Transmissions – Fundamentals, Selection,
Design and Application," Springer-Verlag Berlin Heidelberg, HARD Torque Converter for Better Drive Response
2nd ed., 2011, https://doi.org/10.1007/978-3-642-16214-5
SOFT Torque Converter for Better Drive Comfort
ABOUT THE AUTHOR DOE Design of Experiments
MSc. Eng. Fernando Fusco Rovai. Mechanical Engineer
and Master in Mechanical Engineering from Escola
Politecnica da USP, São Paulo, Brazil. More than 20 years’
experience working in research, development and calibration
of engine electronic control systems. Currently works on
numerical simulation focused on performance, energy
efficiency and emissions reduction at Volkswagen do Brasil.
Professor in undergraduate and specialization courses at
Centro Universitário FEI. Internal combustion engine and
11You can also read