Predict Stock Price of Tesla Based on Machine Learning - DRP
←
→
Page content transcription
If your browser does not render page correctly, please read the page content below
Highlights in Business, Economics and Management                                            FTMM 2022
Volume 5 (2023)

     Predict Stock Price of Tesla Based on Machine Learning
                                             Luren Dai *
                    Woodsworth College, University of Toronto, Toronto, Canada
                         * Corresponding author: luren.dai@mail.utoronto.ca
Abstract. With the vigorous promotion of new energy, electric vehicles have become a popular travel
choice. As the most popular brand at present, Tesla has a huge market share and its technology
and patents can guarantee the advantages of future development. At the same time, Elon Musk is a
very ambitious and powerful entrepreneur who can lead a technology company to a better future.
The stock of Tesla is also favored by many investment institutions because it brings together new
energy, automobile, artificial intelligence, and other high-tech industries. This report will mainly use
machine learning methods to predict the trend of stock prices (closing prices). Time series and the
k-nearest Neighbors algorithm are the main methods used to predict and compare the accuracy to
analyze which model is more suitable. In order to train the model, all the data of stock are divided
into a training set and a test set. At the same time, Linear Regression, Random Forest, Support
Vector Regression, and Decision Tree are also used as a reference for the analysis.
Keywords: Prediction, Machine learning, K-Nearest Neighbors, time series.

1. Introduction
    In 2003, Tesla started with core technologies such as the battery, computer software, and the
proprietary motor [1-2]. It became to be the first American car company to do so in IPO and won
several automotive awards in 2010. After nine years, it had already gotten global expansion and
opened its first "Gigafactory" outside the United States in Shanghai, China. Tesla shares are parabolic
because of the obvious global shift towards renewable energy [3-4]. The electric-car company is well
positioned for rapid growth in the coming years [5]. Its share price started at a little over $1 and
peaked at over $400. Its owner, Elon Musk, has become a successful businessman who can lead Tesla
to a better future. Its industries include new energy, batteries, and artificial intelligence. The article
shows that the future of these industries has a very good trend [6].
    Since going public, Tesla has seen its share price rise as well as profits, thanks to a more mature
technology and sales model. At the same time, because electric vehicles are in line with the future
development trend, and the company's own technology and patents are leading at the industry level,
it has attracted many investment institutions to buy shares. It has long been a matter of debate whether
computer calculations can transcend the external influences of the stock market itself. There are clear
economic incentives for applying analytical tools to stock market data.
    The article uses the data from Yahoo finance choosing the date from the whole period. At first, we
check the data to see whether there is a missing value. To make a training set, we randomly choose
80% of the data set and let the rest 20% of the data set as a test set to check the model [7-9].
    In analysis, using past data to predict the future is very strategic and computationally intensive
work. Machine learning can verify our prediction accuracy through Training Set and Test Set. Yahoo
Finance downloaded Tesla's data from the start of trading to the present. And our main analysis is the
closing price. By taking the closing price as the research object, the machine learning method is
adopted to predict. When the daily closing price is used as the reference volume, taking a five-day
period (because there are only five opening days in a week), spectrum analysis is performed to select
the most suitable parameters, and time series prediction is used to analyze the change over time. KNN
is used to compare the accuracy of this method. According to the data of the test set, the accuracy of
KNN is more than 50%. We also compare four economic models. Linear Regression, Random Forest,
Support Vector Regression, and Decision Tree are used to predict the error of such Linear models to
find out which model fits best. It is also concluded that linear regression is the best in economic
models
                                                   342
Highlights in Business, Economics and Management FTMM 2022
Volume 5 (2023)
The following parts are: the machine learning method, the result we get, and the comparison model
are in the part of the result as well as the skim and limitation of finding in the part of Discussion.
2. Method and Result
2.1. Method and result
2.1.1. Time series
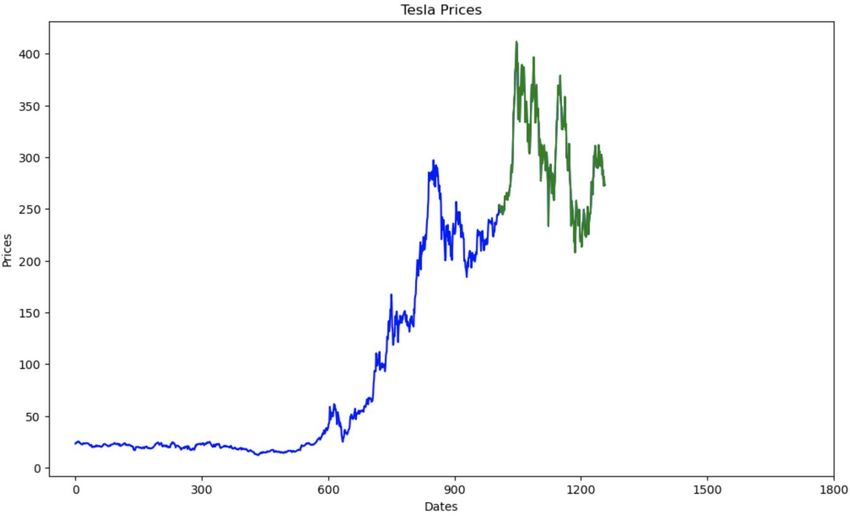
First, we generated a time-series chart of daily stock prices. From Figure 1 we can see that there
is a decreasing trend, but the variance slightly increases. The average is not constant because it does
not fluctuate around a line. Again, the variance is not constant due to the different fluctuations at each
point.
Figure 1. Tesla Price
As we get the SARIMA model from logged data, we will identify both seasonal and non-seasonal
components of this model [10]. For seasonal components, we take one difference and the ACF cut
off at lag = 2. Additionally, after one difference, PACF also appears to cut off at lag = 2 thus we
choose P = 2,d = 1, Q = 2, s = 5. And for non-seasoning components, we can see that the ACF cut off
at lag = 2 or 4. PACF cut off at lag = 2 though the parameter is insignificant. In the same way, we
choose p = 1, q = 2 or 4, and d =1. Thus, we will fit two models: ARIMA(2,1,2) ×(2, 1, 1)5 and
ARIMA(3,1,2) ×(2, 1, 2)5.
By differencing the data and getting it logged, we can remove a downward trend and get a time
series that looks like a stationary process with a constant mean and variance around 0. So we can
have a better method to distinguish stationary from non-stationary data. As we can see the persistence
in season, we will choose a difference on logged data as daily. After transformations, it looks
stationary. Now, we will get a better model and see the sample ACF and PACF by using the data.
2.1.2. KNN method
When using train-test splitting for model evaluation, the dataset is split into two parts: one is the
training data, which uses 70% of the data to fit the model. This means that the training data will be
used as the daily variation amplitude as the neighbor.
The other part is the test data, which is used to evaluate the accuracy of the model. This means that
you will make predictions for each ring number in the test data and compare these results with the
known true ring number.
343Highlights in Business, Economics and Management FTMM 2022
Volume 5 (2023)
For the kNN algorithm, a suitable value of k needs to be chosen. By choosing a model with better
k, the model will use the three nearest neighbors to predict the values of future data points. To put
data into the model, you fit the model on the training dataset.
2.2. Results
When receiving the paper, we assume that the corresponding authors grant us the copyright to use
the paper for the book or journal in question. When receiving the paper, we assume that the
corresponding authors grant us the copyright to use. From the time series model, the standard
residuals fluctuate around x=0 without significant change. It has a mean around zero, with no pattern.
Assuming the ACF of both sequences, this means that there is no peak above the blue line. And 95%
confidence intervals are meaningful. We can see that the score is above the significance level for most
lags (above the blue line) and only slightly closer to the blue line. Therefore, we cannot reject the null
hypothesis that the residuals are independent. The test set of the time series model can show the long-
term trend better.
Figure 2. Time series plot
There exists a brief upward trend and a u-shaped rise at its lowest point from the forecasted results
in the next 10 days, which means the rate will decrease to the normal level after a brief increase. From
the range of 95% prediction interval, we can see the range of prediction interval is becoming wider.
But, the range is still not wide enough compared with the value of point estimation so we make a
relatively precise prediction (Fig 2).
At the same time, the accuracy of the KNN model is about 52%. The table below shows that Linear
Regression has a higher R square, lower mean absolute percentage error, lower root mean square
error, and lower mean square error compared to the random forest, support vector regression, and
decision tree. As the linear regression model compounded the rise and fall of stocks and took into
account more digital factors, there was less margin of error (Table 1).
Table 1. the accuracy of the different models
R Square(%) MAE RMSE MSE
Linear Regression 98.31 4.487 5.864 35.482
Random Forest 97.65 5.351 6.904 48.943
Support Vector Regression 70.36 19.202 24.626 732.428
Decision Tree 96.73 6.521 8.448 70.383
344Highlights in Business, Economics and Management FTMM 2022
Volume 5 (2023)
3. Conclusion
Time series need a larger dataset which also needs more training time to predict better, but it may
not be able to predict that much because of external factors that are changing the stock price. KNN
method will classify the point even if it is an outlier. In order to overcome this, time complexity and
a large aperiodic change will influence the accuracy. For linear regression, more coefficients are
needed as a reference, in order to better predict the trend.
In terms of limitations, because there were so many choices for ACF and PACF, we could only
compare two of them, so the model we chose may not be the best one. Due to different periods of
information or external factors on the impact of stock prices, there are some outliers we did not deal
with. It might help to improve the performance of the model if we prune the data. At the same time,
the uncertainty of public opinion and the general environment leads to a large confidence interval,
which may affect the reliability of the model.
Machine learning is good at cross-validation and can be used to assess how well models perform
in practice. It is a pattern search tool with few linear relationships, and it achieves great predictive
power by aggregating different models. Training sets and test Sets are used for better verification to
get a better model. And that's very difficult econometrically. The econometric model analyzes the
economic structure through the basic underlying logic process. Therefore, when using computers to
deal with change and prediction, it is often through the basic relationship, thereby facilitating a
simulation, hypothesis analysis, and decision effect analysis, and then optimizing the decision. But
the two models can also be combined, using a machine learning model to input the variables needed
for the econometric models. It is also possible to see if the two models can explain the same
phenomenon or conclusion.
References
[1] Yahoo! (2022, September 9). Tesla, Inc. (TSLA) Stock Historical Prices & Data. Yahoo! Finance.
Retrieved September 9, 2022, from https://finance.yahoo.com/quote/TSLA/history?p=TSLA.
[2] P. Srivastava and P. K. Mishra, "Stock Market Prediction Using RNN LSTM," 2021 2nd Global
Conference for Advancement in Technology (GCAT), 2021, pp. 1-5, doi:
10.1109/GCAT52182.2021.9587540.
[3] F. L. Marchai, W. Martin and D. Suhartono, "Stock Prices Prediction Using Machine Learning," 2021 8th
International Conference on Information Technology, Computer and Electrical Engineering (ICITACEE),
2021, pp. 79-84, doi: 10.1109/ICITACEE53184.2021.9617222.
[4] Mottaghi, N., & Farhangdoost, S. (2021, May 4). Stock price forecasting in presence of covid-19
pandemic and evaluating performances of machine learning models for time-series forecasting. arXiv.org.
Retrieved September 9, 2022, from https://arxiv.org/abs/2105.02785.
[5] A. Chatterjee, H. Bhowmick and J. Sen, "Stock Price Prediction Using Time Series, Econometric,
Machine Learning, and Deep Learning Models," 2021 IEEE Mysore Sub Section International
Conference (MysuruCon), 2021, pp. 289-296, doi: 10.1109/MysuruCon52639.2021.9641610.
[6] D. Bhuriya, G. Kaushal, A. Sharma and U. Singh, "Stock market predication using a linear regression,"
2017 International conference of Electronics, Communication and Aerospace Technology (ICECA), 2017,
pp. 510-513, doi: 10.1109/ICECA.2017.8212716.
[7] Real Python. (2022, September 1). The K-nearest neighbors (knn) algorithm in Python. Real Python.
Retrieved September 1, 2022, from https://realpython.com/knn-python/#fit-knn-in-python-using-scikit-
learn.
[8] Zhou Jianbo, Chen Hao, and Sun Shubin. From the standpoint of the Literature History Review [J].
Journal of Shandong University (Philosophy and Social Sciences Edition), 2021 (4): 50 - 64. DOI:
10.19836/j.cnki.37-1100/c.2021.04.005.
[9] Yin Shuhao, Zeng Wei. Analysis of China's stock market disaster relief and preventive measures [J].
North China Finance, 3 (3), pp. 26-29.DOI: 10.3969/j.issn.1007-4392.2016.03.005.
345Highlights in Business, Economics and Management FTMM 2022
Volume 5 (2023)
[10] Marchai F. L., Martin W. and Suhartono D., "Stock Prices Prediction Using Machine Learning," 2021 8th
International Conference on Information Technology, Computer and Electrical Engineering (ICITACEE),
2021, pp. 79 - 84, doi: 10.1109/ICITACEE53184.2021.9617222.
346You can also read