PREPARING FOR THE
FUTURE OF WORK IN
THE COMMONWEALTH
OF MASSACHUSETTS
←
→
Page content transcription
If your browser does not render page correctly, please read the page content below
PREPARING FOR THE FUTURE OF WORK IN THE COMMONWEALTH OF MASSACHUSETTS

TABLE OF CONTENTS

01                                    02
Executive                       04 Context and                        09
summary                            approach

03
Top eight insights for the Commonwealth                                                                       15

03 – 01                               03 – 02                              03 – 03
Demand for office real estate    18   Hybrid work will likely drive   23   Public-transit ridership is        26
may fall as workers spend             demand for flexible childcare        expected to fall, with the
more time in residential              options, requiring the               steepest decline likely in
areas due to hybrid work              childcare business model             commuter rail
                                      to evolve

03 – 04                                                                    03 – 05
Business travel may be structurally reduced from pre-pandemic         30   Reskilling may be required at      33
levels, which could impact the hospitality and airline industries          an unprecedented scale and
and hamper Massachusetts’ competitiveness                                  pace

03 – 06                               03 – 07                              03 – 08
The Commonwealth                 41   Existing equity challenges      44   Housing options that work          47
population is likely to grow,         will intensify                       for all will be key to retaining
albeit more slowly than pre-                                               and attracting people into
pandemic                                                                   the state

2
04
Regional implications                                                                                          50

04– 01                                04 – 02                                04 – 03
Boston/Cambridge                 53   Greater Boston Urban             56    Gateway Cities                    58
                                      Residential

04 – 04                               04 – 05                                04 – 06
Suburban Greater Boston          61   Suburban – Non-Boston            64    Rural                             66
                                                                             (Tourism based economies)

04 – 07
Rural                            68

05                                    06
Going forward                   70 Methodology                         72

This report draws on extensive fact-based analyses, research and interviews conducted by McKinsey & Company.

3
01
EXECUTIVE
SUMMARY
The Commonwealth of
Massachusetts has experienced
vibrant economic growth in recent
years, propelled by a talented
workforce and good overall quality
of life. The state has become a global
leader in many disciplines, including
healthcare, biotechnology, sciences,
engineering, higher education,
technology, and finance.1 It is ranked
as one of the most attractive states
for citizens to live, and its per-capita
personal income is the third-highest
in the nation.2 Among all 50 states,
Massachusetts is ranked first in
patents per capita, first in venture

4
capital funding per GDP, and fifth in the number       a broad range of topics and regions within the
of company headquarters per capita.3 Bloomberg’s       Commonwealth to inform perspectives in this
annual State Innovation Index ranked the state         report. In addition, an Advisory Council10 was
as “the most innovative state in America,” thanks      convened, comprised of fourteen business and
to its growing concentration of entrepreneurial        education leaders from the Commonwealth across
start-ups over the past decade.4 Access to top-        diverse geographies and industries, to provide
notch educational institutions and to highly skilled   input and feedback on the emerging future of
labor pools has attracted employers of all sizes and   work impacts.
served as an important driver of Massachusetts’
growth. Massachusetts benefits from a moderate         Many of the factors impacting the future of
tax regime and is ranked 21 in terms of overall        work (such as rising income levels and an aging
tax burden by state.5 The state’s public-school        population) are not new. However, COVID-19
students place in the nation’s top tier for academic   and the substantial shifts in how Massachusetts
performance,6 and the Commonwealth is home to          residents work over the past year have
122 institutions of higher education.7                 accentuated and accelerated many of these
                                                       factors (such as the use of e-commerce and the
Despite these competitive advantages, the effects      pace of adoption of automation). Moreover, new
of COVID-19 have profoundly challenged the             factors have emerged (such as the spread of
Commonwealth. COVID-19 was not only the worst          remote and hybrid work at-scale and a reduction
public health crisis of the last hundred years, but    in business travel). The degree of change and
also an economic calamity that caused 560,000          resulting shifts in how Massachusetts residents
residents to become unemployed,8 and half of all       live and work vary across regions, industries and
small businesses to close at the pandemic’s height     occupations in the Commonwealth – as well as
in April 2020.9                                        across gender and race.

As we emerge from the pandemic, the study              To complicate matters, how these factors will
outlined in this report, Preparing for the Future of   evolve has real uncertainty; it is difficult to
Work in the Commonwealth of Massachusettes,            determine, for example, how structural the decline
explores what work could look like in                  in business travel will be, or whether there will
Massachusetts in both the near term (to 2025)          be a surplus of commercial real estate in urban
and the longer term (to 2030). It explores what        areas, or how deeply the adoption of hybrid,
the implications might be for the Commonwealth         work from home models will decrease public
and its residents across its regions, economic         transportation ridership. With these uncertainties
sectors, commercial centers, local downtowns,          in mind, three potential scenarios were considered
transportation, and public spaces.                     for how these factors may impact the future of
                                                       work in the Commonwealth. Furthermore, the
This work aims to provide a fact base and              Commonwealth is not homogeneous, and this
assessment of current and future trends to inform      report explores seven regional archetypes to assess
any workforce and economic interventions that          how the challenges and opportunities arising from
might be needed to address recent challenges           the future of work could be experienced differently
and to prepare the state and its citizens for          across the state.
a successful future. Extensive research was
conducted, including more than 60 analyses,            This report is anchored in eight core insights that
discussions with business leaders, resident and        could cause the most critical shifts impacting the
business surveys, and expert interviews across         future of work in the Commonwealth. These are: (1)

5
reduced demand for office real estate as workers         work models may need more sporadic, part-time
spend more time in residential areas due to hybrid       childcare that is closer to home, requiring the
work; (2) the need for affordable, flexible, childcare   childcare business model to change and adapt to
options that cater to the needs of the future; (3)       the new flexibilities in work schedules Reduced
ridership declines in public transit (particularly       business travel would also strongly affect Boston,
commuter rail) (4) reduced business travel; (5) a        as approximately 40 percent of Logan Airport
need for reskilling at an unprecedented scale and        traffic comprises business travelers12 (compared
pace; (6) slowing population growth; (7) greater         to about 20 percent nationwide)13. Hybrid work
equity challenges; and (8) capacity-constrained          and reduced business travel may also have
housing options that meet the requirements of            second-order effects on businesses (and their
all. These eight insights are summarized into the        employees) that depend on commuter and
four overall themes for the Commonwealth in the          business travel– particularly in the retail, food
future that we highlight below.                          and hospitality sectors. Our analysis suggests a
                                                         significant challenge for commuter rail, which
First, changing ways of working –                        could experience a 15 to 50 percent loss of its pre-
                                                         pandemic ridership base, depending on the extent
such as hybrid and remote work
                                                         of remote work adoption. Additionally, this analysis
– may shift the center of gravity                        expects demand for office real estate to decrease
away from the urban core, further                        by as much as 10 to 20 percent if remote / hybrid
reinforced if business travel                            work trends continue. On a positive note, this shift
decreases.                                               could create more vibrancy in local downtowns,
                                                         with more people working from home creating
Our analysis shows that around a third of                opportunities for businesses in these downtowns
Massachusetts residents can work remotely – a            as well as inspire placemaking efforts that would
higher percentage than in most other US states,          improve the attractiveness of areas outside the
since the Commonwealth has a high share of jobs          urban core (placemaking defined as planning,
in sectors that lend themselves to remote work,          design and management of public spaces such as
such as technology and professional services.            creation of community parks and art installations).
Surveys and interviews indicate that many remote
workers could continue with hybrid work in the           Second, the pace, scale, and
future. The impact to urban cores will depend on
                                                         breadth of reskilling needed for
the extent of this hybrid work: a day of remote
work per week could have modest impact, while            job transitions must be much
an average of three days or more of remote work          greater than before the pandemic;
per week would have more significant impact.             creating the workforce of the future
Previously, the urban cores in Massachusetts             will require extensive, thoughtful
had a large commuter population (for example,
                                                         preparation.
approximately 245,000 workers traveled into
Boston from surrounding areas in 201911). A shift
to remote/hybrid work and spending more                  COVID-19 accelerated automation, e-commerce
time closer to home could have far-reaching              and digitization as residents and businesses found
implications on transit, urban vitality, housing         these interventions useful as they worked to
(both where housing is needed as well as types           curtail physical proximity. If these trends continue,
of options on housing), local congestion and             up to 400,000 job transitions may be needed
childcare needs. For example, parents in hybrid          by 2030, with 75,000 employees having to jump

6
before the pandemic - will likely exacerbate these
multiple wage levels. This would require one of the
                                                      problems. Beyond a slower economic recovery, as
largest reskilling efforts that the Commonwealth
                                                      we look ahead, automation and reskilling needs
has ever undertaken. If done correctly, the effort
                                                      are likewise expected to have greater impact
could lead to a vibrant Massachusetts economy
                                                      on women, young people, people of color and
with new job creation absorbing the workforce         people for whom English is a second language.
released by automation trends. In particular, there   For example, the automation of office work will
could be substantial growth in healthcare (which      likely affect women disproportionately, given
could produce 210,000 to 235,000 more jobs by         that women represent about 85 percent of
2030) and in new economy sectors like artificial      administrative occupations such as assistants,
intelligence (AI), clean energy, and biotechnology.   secretaries, payroll clerks and receptionists in
This growth could be held back, however, if           the Commonwealth. Hispanic workers are more
reskilling is unable to supply sufficient talent of   strongly represented in the food and hospitality
the right capability, or if population growth and     occupations, which by 2030 are expected to
in-bound migration slows growth in the available      experience significant job losses due to future-of-
                                                      work trends.18 The Commonwealth maybe able
workforce.
                                                      to take advantage of opportunities to transition
                                                      people into higher-paying jobs, and to address
Third, the pandemic has already                       some of the longstanding inequities across the
exacerbated pre-existing inequities                   state – but without focused action it’s likely that
                                                      inequities will deepen.
for many and as we look ahead
the future of work will not be                        Fourth, the risk of future job growth
experienced equally across the                        moving outside Massachusetts is
Commonwealth.                                         rising due to the high costs of living
For example, while many white-collar workers
                                                      and doing business in the state.
enjoyed the benefits of remote work, many
women, ethnic and racial minorities, the              Remote work enables greater mobility for both
relatively less educated, and younger populations     employers and employees, thus lowering the
experienced significant disadvantages.                barrier for jobs and residents to leave the state
Unemployment in the Commonwealth peaked               or for companies to place jobs and recruit talent
in April 2020 at 16.4 percent – more than 5.4         elsewhere. To remain attractive, Massachusetts
times pre-pandemic levels14 – and remains at          must double-down on the fundamentals, as
6.4 percent (2.1 times pre-pandemic levels) as
                                                      validated in numerous surveys and conversations
of April 2021 with more than 240,000 workers
                                                      with residents and business leaders. In interviews
unemployed in the Commonwealth.15 Black
                                                      with business leaders, regulatory burdens, the
workers in Massachusetts faced unemployment
                                                      high cost and complexity of doing business,
rates that were approximately 13 percentage
points higher than rates among other racial           and access to talent came up consistently as
groups in 2021.16 Nationally, job recovery for        key challenges that impact Massachusetts’
women coming out of the pandemic is expected          competitiveness. Interviewees went as far as
to occur about 18 or more months later than           to say that they were considering looking at
for men, and for those with less education or         other states to expand their businesses or had
income, recovery could happen one to two years        heard of other peer, Massachusetts-based
later.17 The picture is expected to be no different   companies that were seeking to move their
for the Commonwealth, and a lack of access to         businesses to other states with a lower-cost of
affordable, flexible childcare – a challenge even     doing business. To capture new job growth, then,

7
the Commonwealth will likely need to address           fueling. Without proactive and focused action,
these challenges while also working to remain          Massachusetts risks losing population and job
the nation’s top hub for talent. In particular, the    growth to more cost-competitive states. But
cost of living in the state is seen as a potential     if Massachusetts can rise to the challenge and
barrier to retaining and attracting talent. In         accomplish these goals, the opportunity to create
our surveys, residents highlighted affordability       an inclusive economy that provides opportunities
as the top determinant when deciding where             for everyone and remains an attractive place for
to live, especially in the context of remote and       businesses and residents could become the next
hybrid work. Massachusetts is among the lowest-        chapter for Massachusetts.
ranked states for affordability and has some of
the highest housing costs19 and most expensive
childcare services20. Our analysis highlights need
for up to 125,000-200,000 additional housing units
by 2030 to bring Massachusetts up to national
vacancy benchmarks and 25,000-30,000 additional
childcare workers to provide sufficient and flexible
childcare. By investing in these fundamentals,
addressing the challenges that businesses believe
to be impeding Massachusetts’ competitiveness,
and continuing to maintain access to top-notch
educational institutions and to highly skilled labor
pools, Massachusetts can continue to win the fight
for job and talent growth.

With vaccination well underway, the worst of
the COVID-19 pandemic may soon be behind us.
Massachusetts (like many states) now face a host
of serious challenges – and opportunities - as
residents and businesses adapt to the future of
work. Remote and hybrid work offers employers
and employees greater mobility in choosing where
they want to work, but it raises the imperative for
Massachusetts to remain competitive. This means
leaning into its strength as a bastion for world-
class talent by reskilling and equipping residents
with the skills needed for future occupations
and retaining them with improved affordability
and meeting the fundamental needs of housing
and childcare. It means ensuring Massachusetts
remains an attractive state for employers to
create future jobs. It means adapting to where
people will spend time in the future and ensuring
offices, business, leisure and retail adapt to these
as well. And it means addressing head-on the
rising inequalities that many of these trends are

8
02
    CONTEXT
    AND APPROACH
    COVID-19 posed profound challenges
    for the Commonwealth. The significant
    job losses resulting from COVID-19
    have deeply affected Massachusetts’
    economy. Coming out of the pandemic,
    the Commonwealth now turns to the
    question of what the future of work
    in Massachusetts might look like and
    what the implications might be for the
    Commonwealth and its citizens across its
    regions, economic sectors, commercial
    centers, local downtowns, transportation,
    and public spaces.

9
It is critical to examine which COVID-related                  needed to address the challenges of the past ~15
disruptions could endure, which trends have                    months and prepare the state and its citizens
accelerated or shifted, and what that might                    for a successful future. To achieve this end,
mean for maintaining the Commonwealth’s                        this report draws on more than 60 analyses
competitiveness as an attractive place to work.                (Exhibit 1) from publicly available data as well
Sound research and an assessment of current and                as data and assumptions from Commonwealth
future trends can form the basis for workforce and             agencies, discussions with experts and business
economic interventions that will both address the              leaders, and surveys of business and consumer
challenges of the past 15 months and prepare the               communities across the Commonwealth. The
state and its citizens for a successful future.                objective is to help the Commonwealth determine
                                                               where and how interventions may prove most
The study outlined in this report, Preparing for               effective considering the challenges and potential
the Future of Work in the Commonwealth of                      opportunities resulting from COVID-19. As such,
Massachusetts, explores what work could look                   this report is meant to provide insights based
like in Massachusetts, in the near term (to 2025)              on currently available information and does
and the longer term (to 2030). This work aims                  not seek to provide specific advice or policy
to provide the fact base and an assessment of                  recommendations. Its content is not intended to
current and future trends to inform workforce                  be a forecast or prediction, and many of the factors
and economic interventions that might be                       considered are subject to change.

Exhibit 1: Tabulation of the analyses informing the future of work in the Commonwealth.

Module            Supplemental analyses

Employment        •   Employment by sector by scenario to 2025-30, including sizing of trends for business travel, remote work,
                      automation, e-commerce, rising incomes, aging population, etc.
                  •   Employment change by occupation by scenario to 2025-30
                  •   Workforce Development Area (WDA) -level analysis of employment (by scenarios and sectors) to 2025-30
                  •   Transition gap analysis by scenario, by county to 2025-2030
                  •   Wage quintile transition analysis by scenario, by county 2025 – 2030
                  •   Time spent using skill in each skill category by wage quintile in MA
                  •   Labor demand transitions made from 2007-2019 by minor standard occupational classification (SOC)
                      code
                  •   MA net payroll employment gains and losses by detailed SOC code 2007-2019
                  •   Breakdown of occupation transitions for sample occupations by 2030
                  •   Displacement analysis by scenario and WDA to 2025-30

Migration         •   Historical domestic migration analysis by state
                  •   Historical international migration analysis by country and sector
                  •   Historical net change in MA population by domestic, international, and birth rates
                  •   COVID-19 migration analysis for all US cities with 350k+ residents using USPS data
                  •   COVID-19 migration analysis for Massachusetts cities and towns using USPS data
                  •   COVID-19 migration state analysis inflows and outflows using ADP data
                  •   COVID-19 migration intrastate analysis using ADP data, including by income bracket and age
                  •   MA resident survey of 500+ respondents regarding working styles, migration, reskilling, childcare barriers
                  •   Scenario modeling of migration by WDA for 2025 and 2030 based on University of Massachusetts
                      Donahue estimates
                  •   Intra-state remote work potential based on sector employment analysis
                  •   Analysis of commuter movement by WDA from American Community Survey data

10
Module Supplemental analyses
Equity • MA COVID-19 unemployment rate versus US national rate
• MA COVID-19 unemployment by types, reason
• MA COVID-19 unemployment analysis by ethnicity, education level and gender
• MA COVID-19 long-term MA employment trajectory by gender, education and wage level
• Job transition impact of COVID-19 by gender, age, educational attainment and race/ethnicity
Transportation • Historical recovery rate analysis by travel and logistics subsectors
• Historical analysis of vehicle miles traveled relative to U.S. average using Massachusetts Departmentof
Transportation data
• COVID-19 transportation analysis of rural/urban traffic recovery relative to U.S. average
• Comparative analysis of changing commuter patterns in urban areas (hours lost and cost to city)
• Freight logistics demand analysis by scenario to 2025-30
• Historical passenger travel to Logan airport and comparative analysis of business-heavy routes from
Logan Airport
• Comparative analysis of travel recovery across multiple US airports using publicly available data
• Analysis of Logan Airport revenue and other Massachusetts Port Authority airport conditions (closing
routes, revenue decline) throughout 2020 using Massport data
• Scenario modeling of future business air travel to 2025 and 2030
• COVID-19 transportation analysis of transit versus driving trips using MBTA, Mass Turnpike data
• Public transit ridership analysis by mode (e.g., commuter rail, subway, bus)
• Scenario modeling of public transit ridership to 2025 and 2030
• Analysis of shift to auto from public transit ridership changes to 2025 and 2030 (including parking
capacity, emissions, congestion, fatalities)
• Comparative analysis of work versus non-work trips
Commercial real • COVID-19 commercial real estate analysis of rents by property type (including retail, office, industrial)
estate using CoStar Group data
• COVID-19 commercial real estate analysis of delinquency rates by property type using CoStar Group data
• Analysis by granular geography and asset class (A,B,C-type office space) using CoStar Group data
• Scenario modeling of commercial real estate demand by property type (including retail, office, industrial)
to 2025 and 2030 using CoStar Group data
• Office year over year rent/occupancy rate growth by city using Yardi data
• Comparative analyses of various surveys (UpWork, EY, PwC) assessing office space trends after COVID-19
Housing • Housing pre-COVID-19 gap, benchmarked to national occupancy levels
• Historical analysis of regional home values from 2005-2021 using Zillow Home Value Index
• Historical analysis of regional housing occupancy rates using ACS data
• COVID-19 housing analysis of MA housing rents by municipality using Zillow Observed Rent Index
• COVID-19 housing analysis of home value prices by housing type using Zillow Home Value Index
• Scenario modeling of housing supply, demand, gap by WDA to 2025 and 2030
State revenue • Scenario modeling of withheld income, sales tax, motor fuel tax to 2025 and 2030 using DOR revenue
data and previous model results
• Scenario modeling of regional property tax (including commercial, residential, industrial) to 2025 and
2030 using DLS property tax data and previous model results
• Historical tax revenue growth by category, in constant USD using Department of Revenue data, deflated
using Bureau of Labor Statistics data
• Historical budgeted tax composition analysis, using DOR data
11Many of the drivers impacting the future of surplus of commercial real estate in urban areas
work (such as rising income levels and an aging or how deeply the adoption of hybrid work from
population) are not new; however, COVID-19 home models will decrease public transportation
and the substantial shifts in how Massachusetts ridership. With these uncertainties in mind, three
residents work over the past year have potential scenarios were considered based on
accentuated and accelerated many of these trends how these drivers may impact the future for
(such as e-commerce and the pace of adoption of the Commonwealth (Exhibit 2). The scenarios
automation). Moreover, new drivers have emerged are built on a wide variety of inputs from a vast
(such as spread of remote and hybrid work at-scale array of sources and include surveys conducted
and reduction in business travel). The degree of with business leaders as well as citizens in the
these shifts varies across geographies, industries, Commonwealth to gauge likelihood of adoption
and occupations in the Commonwealth – as well of trends as well as validated in interviews with
as across gender and race. Also, the evolution of a cross-geography and cross-industry set of
many of these drivers is uncertain; it is difficult to business leaders through an Advisory Council
determine, for example, how structural the decline established for the purposes of this work.
in business travel is or whether there may be a
Exhibit 2: Scenarios studied with assumptions by scenario and sources of assumptions.
Assumptions by scenario
Scenario A: Return to
Trends pre-COVID-19 levels Sources informing our models and analyses
1. Adoption of Extent of Midpoint automation • McKinsey Global Institute Automation
automation adoption and adoption scenario (~20% adoption model leveraging US Labor
and AI displacement of workers displaced) Department O*NET database
(varies by • Survey of 800 executives on intention to
occupation)
accelerate automation adoption post-COVID
2. Shift to E-commerce Euromonitor projections, • Euromonitor retail value (Retail Selling Price)
ecommerce adoption pre-COVID-19 for the projections
same time periods (~30%)
3. Reduced Business Return to pre-COVID-19 • Oxford Economics-modeled recovery until
business travel growth travel growth rates 2022
travel recovery • Oxford Economics historical travel growth rates
4. Future Incremental 0% - return to pre- • Bureau of Labor Statistics data, Morgan Stanley
of office office space COVID-19 office space estimate
work (for reduction use
those who assumption
can work
remotely) Days eligible 1 day per week on • Multiple reports including MA Future of Work
workers spend average resident survey, PWC US Remote Work Survey,
working Real Estate Survey
remotely • Refined by MA Future of Work business
survey conducted with 223 businesses of
different sizes and industries throughout the
Commonwealth
12Assumptions by scenario
Scenario B: Trends Scenario C:
continue at levels Remote work
seen during becomes more Sources informing our models
Trends COVID-19 permanent and analyses
1. Adoption of Extent of COVID-accelerated automation • MGI Automation adoption
automation adoption and adoption scenario, 139 occupations model leveraging US Dept
and AI displacement with increased automation due to O*NET database
(varies by COVID-19 (~25% of workers displaced) • Survey of 800 executives
occupation)
on intention to accelerate
automation adoption post-
COVID
2. Shift to E-commerce 25% e-commerce adoption by 2024, • Euromonitor retail value (Retail
ecommerce adoption and 38% e-commerce adoption by Selling Price) projections
2030
3. Reduced Business travel Business travel growth reaches 75% • Oxford Economics-modeled
business growth recovery of pre-COVID-19 travel by 2023, and recovery until 2022
travel resumes at pre-COVID-19 trends • Oxford Economics historical
afterwards travel growth rates
4. Future Incremental 15% incremental reduction in office • Bureau of Labor Statistics data,
of office office space space due to increase work from home Morgan Stanley estimate
work (for reduction
those who assumption
can work
remotely)
Days eligible 2 days per week 3 days per week • Multiple reports including MA
workers spend Future of Work resident survey,
working PWC US Remote Work Survey,
remotely Real Estate Survey
• Refined by MA Future of Work
business survey conducted with
223 businesses of different sizes
and industries throughout the
Commonwealth
13The three scenarios considered include: Scenario A, in which the trends return to their original trajectory prior to the COVID-19 pandemic; Scenario B, in which the trends continue to accelerate as they did during the pandemic; and Scenario C, in which hybrid and remote work become more permanent, while the other trends continue to accelerate as they did during the pandemic. Our approach was not to look at every possible scenario, but rather to focus on three viable scenarios and their associated implications for the Commonwealth of Massachusetts. Informed by business surveys and discussions with experts and business leaders, this analysis also identifies eight insights that are most likely to have a meaningful impact on the Commonwealth. These include (1) reduced demand for office real estate as workers spend more time in residential areas due to hybrid work; (2) the need for affordable, flexible, childcare options that cater to the needs of the future; (3) ridership declines in public transit (particularly commuter rail) (4) reduced business travel; (5) a need for reskilling at an unprecedented scale and pace; (6) slowing population growth; (7) greater equity challenges; and (8) capacity-constrained housing options that cater to the needs of a diverse population.. In the following sections, this report explores each of these insights in detail. Furthermore, the Commonwealth is not homogeneous and the challenges and opportunities from the future of work will be experienced differently across the state. The report explores how each implication may differ regionally across the Commonwealth, categorized across different regional archetypes. 14
03
     TOP EIGHT
     INSIGHTS FOR THE
     COMMONWEALTH

     Based on more than 60 analyses, multiple
     surveys of business leaders and consumers
     in the Commonwealth, and discussions with
     Commonwealth leaders, eight insights stand
     out as most likely and significant, regardless
     of scenario. These eight insights can be
     categorized into several themes.

15
Changing ways of working – such The pace, scale, and breadth of
as hybrid and remote work – may reskilling needed for job transitions
shift the center of gravity away from must be much greater than
the urban core, further reinforced if before the pandemic; creating the
business travel decreases. workforce of the future will require
extensive, thoughtful preparation.
1. More time will be spent in residential areas as
per our modeling up to 32% of workers in the 5. There is an urgent and unprecedented need
state could shift to remote work 1-3 days per for reskilling, as accelerated automation and
week, impacting the need for office space, digitization and demand for talent from
surrounding infrastructure, and creating growing sectors reshape workforce needs.
placemaking opportunities in residential
areas. This will also impact housing – where it 6. Similarly, there is a need to anticipate and
is needed, as well the type of housing options prepare for potential slowing of population
available to cater to a diverse population. growth, as international immigration is
reduced by the pandemic and domestic
2. Changing childcare needs (including location migration shifts to lower cost locales.
of childcare and type of childcare) will require
childcare programs to rethink their business The pandemic has already
models in order to adapt to the changing
exacerbated pre-existing inequities
needs of working parents from hybrid and
remote work. Available childcare that is for many – and as we look ahead
accessible, flexible, affordable and high quality the future of work will not be
will become even more acute – both for the
experienced equally across the
state’s attractiveness as a place to live and
for enabling parents, particularly mothers, to
Commonwealth.
rejoin or enter the workforce.
7. In particular, unemployment created by the
3. Transit usage is likely to decrease as pandemic could intensify existing inequities
commuters opt to increasingly work from for women, those at lower income levels,
home in a remote/hybrid world. Modes people of color and those with less education.
that rely heavily on work-trips (particularly These segments are expected to fully recover
commuter rail), will be most affected and see later than the rest of the population and will
their business models challenged. also likely be disproportionately affected by
future of work trends such as automation and
4. Reduced business travel is expected to impact digitization.
Massachusetts’ food, accommodation and
hospitality sectors, as well as other businesses The risk of future job growth moving
reliant on business travel. Boston Logan is outside Massachusetts is rising due
expected to be particularly hit, due to the
to the high costs of living and doing
higher proportion of business travelers
compared to the national average and business in the state
discretionary funding from airport parking
may be severely diminished. 8. A challenge even before the pandemic,
16creating housing that is accessible and offers additional flexibilities to employers and
affordable becomes even more an imperative talent as a potential significant barrier that could
as hybrid and remote work expands and discourage future business growth in the state.
allows workers to move farther away from their
places of work. This will also lead to employers While these eight insights touch many different
competing in a wider geographic scale on aspects of work across the Commonwealth, they
expansion and new business building. may also be opportunities to invest in creating
a more vibrant, equitable, and competitive
While costs of doing business were not explored Commonwealth to sustain prosperity in the
in detail in this report, business leaders raised decade to come. Each of these eight insights, and
the high costs of doing business (through their differing impacts across regions, are explored
increased taxes, regulations, and operating in the next sections.
costs) especially when hybrid and remote work
Exhibit 3: Eight insights shaping progress toward an equitable, vibrant Commonwealth
Manage costs of
living and doing
business
Capacity Reduced
constrained demand for
housing office real
Build an options estate
equitable local
economy 8 1 Need for
Greater
equity affordable,
challenges Vibrant, flexible
7 Equitable, 2 childcare
options Adapt to
Competitive shifting center
Commonwealth of gravity
Slowing 6 3 Ridership
population decline in
growth public transit
5 4
Need for
reskilling at an Reduced
unprecedented business
scale and travel
Create the pace
workforce of
the future
1703 – 01 DEMAND FOR OFFICE REAL ESTATE MAY FALL AS WORKERS SPEND MORE TIME IN RESIDENTIAL AREAS DUE TO HYBRID WORK 18
Nine out of ten organizations will be combining       of workers, or 1.4 million, could effectively work
remote and on-site working, according to a            remotely24 (Exhibit 4). If the trend toward remote
global McKinsey survey of 100 executives across       and hybrid work continues, it will likely affect
industries and geographies as employers and           the commercial real estate market, as well as
employees return from the pandemic.21 On similar      geographic retail demand and employment. Small
lines, 52% of employees globally would prefer a       businesses that rely on commuter foot traffic
more flexible working model after the pandemic        could be particularly hard-hit.25
is over.22 Massachusetts has been one of the top
states for remote/hybrid work, as approximately       Hybrid and remote work models may drive down
40 percent of adults live in households with at       demand for office real estate. Office rent in Boston
least one adult who worked remotely due to            declined by 2.5 percent during the pandemic,
COVID-19 as of April 2021.23 A task-time analysis     and vacancy rates increased by 2.4 percent year
and examination of Massachusetts sectors              on year in March 2021 , about a 30% increase.26
and occupations reveal that up to 32 percent

Exhibit 4: Up to 32% of Massachusetts’ workforce may be able to work remotely

Remote work in MA
Projected # workers

# of workers:                  4.4M                     ~1.9M            1.4M

                                                      Theoretical      Effective
                                                      maximum of     potential for
                            MA workers              remote workers   remote work

Share of total:                100%                      42%             32%

19
Remote work potential by sector in MA
Remote education services includes university
projected # workers, ‘000s
administrative staff occupations; analysis does
Theoretical maximum not assume that effectiveness and quality
will remain comparable with a greater shift to
Non-remote
remote
Assumed potential for remote work
Effective potential as % of sector
1. 23% of remote workers said they would relocate in next 12
Education services months
773 32% Source: McKinsey Global Institute analysis, “The Future of Work
Health Care and Social Assistance after COVID-19”, April 2021
674 22%
Government, Administrative, and Support
484 30% Additionally, about 36 percent of respondents to
Professional, Scientific, and Technical Services the Massachusetts Business Survey indicated that
383 55% they expect to reduce their owned or leased real-
Retail Trade estate footprint over the next two years. But how
361 30%
hybrid and remote work will play out in practice
Accommodation and Food Services
331 is still uncertain; there is expected to be a period
9%
Manufacturing of experimentation and learning before this trend
242 25% becomes clear. Our analysis shows that office real
Other Services estate demand could fall by 10 to 20 percent by
203 27%
2030 (Exhibit 5) if the trends toward hybrid and
Finance and Insurance
201 64% remote work as well as de-densification continue
Construction (Scenarios B and C), with Class B and Class C office
195 16% space likely experiencing the biggest impact.
Wholesale Trade This effect may be partially offset by changes in
127 38%
real estate use – for example, the expansion of lab
Information
98 56% conversions as companies concentrate on in-
Transportation and Warehousing person uses for existing commercial space.
96 23%
Management Reduced foot traffic from office commuters
81 62%
may negatively affect surrounding areas. Office-
Arts, Entertainment, and Recreation
65 24% adjacent sectors (such as food services, retail
Real Estate, Rental, and Leasing and entertainment services catering to office
53 36% workers) may see demand decline, impacting
Utilities their businesses. In a survey of Massachusetts
13 21%
businesses, 26 percent responded that they may
Agriculture, Forestry, and Fishing
10 8% need to move to a different area, and 13 percent
Mining said that they may need to close their business if
0 remote work continues.27 This pattern will most
likely affect smaller businesses; such businesses
in Boston Financial District, Seaport, Beacon
Job types most likely to work remote include:
Computer and Mathematical occupations, Hill, Back Bay, and Cambridge were facing
Business and Financial Operations, Management, revenue losses of about 40 percent in May 2021,
Office and Administrative support, and legal for example, when compared to their revenues
occupations in January 2020.28 Whether COVID-19 patterns
related to remote and hybrid work actually result
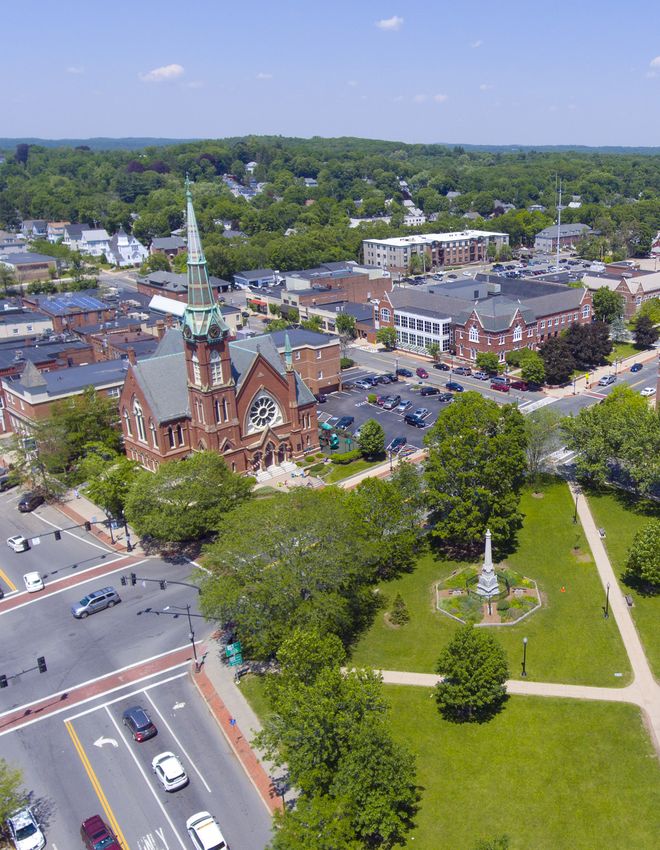
20Exhibit 5: Net demand for office real estate could drop by as much as 20% in 2030 if remote/hybrid work
trends accelerate
Net Office CRE demand by Future of Work scenario,
2018-2030 net change in million sq. ft.
Total occupied B. Trends continue C. Remote work
Workforce office space A. Return to pre- at levels seen becomes more
development area1 2018 million sq ft. COVID-19 levels during COVID-19 permanent
Boston 104 2.7 -12.7 -20.6
Metro North 46 1.4 -5.4 -8.7
South shore 10 0.3 -1.3 -2.0
Central MA 28 0.7 -3.7 -5.7
Metro South/West 65 1.8 -7.8 -12.4
Lower Merrimack Valley 15 0.5 -1.7 -2.8
Brockton 4 0.1 -0.5 -0.7
North Shore 54 1.8 -6.6 -10.5
North Central 6 0.1 -0.8 -1.2
Hampden County 17 0.4 -2.2 -3.4
Franklin/Hampshire 4 0 -0.6 -0.8
Greater Lowell 17 0.6 -1.9 -3.1
Massachusetts 370 10.4 -45.0 -71.8
1. Berkshire, Bristol, Cape & Islands, and Greater New Bedford WDAs not covered in CoStar data
Source: CoStar Data, ADP data Jan 2021 to Jan 2020, UMASS-Donahue Population projections, McKinsey Global Institute analysis,
“The Future of Work after COVID-19”, April 2021
in reduced foot traffic and increased office-space residential areas.29 This change could potentially
vacancy is still unclear, so this trend should be push about 5,000 retail jobs out of the Boston area
monitored further to understand its longer-term while increasing vitality and business activity in
implications on the Commonwealth. residential areas and local downtowns.
Conversely, with more people spending time Additionally, the rising popularity and feasibility of
in residential areas, some spending and retail remote work may allow employers and employees
activity may move to residential areas. Before to have more flexibility in where they choose to
the pandemic, about 250,000 commuters flowed locate. A Massachusetts Business Roundtable
into Boston from surrounding metro areas daily survey found that after COVID-19, members
(Exhibit 6). If 32 percent of these commuters expected that almost three times the previous
curtail their commuting habits, then some 80,000 proportion of their employees affiliated with
workers may spend more time in their local Massachusetts-based operations or locations
21would work out of state (an increase from 5 barriers to moving or expanding operations and
percent to 15 percent).30 Moreover, members employment into other states. This potential
of the Advisory Council noted that increased shift away from Massachusetts could disrupt
opportunities to work remotely have lowered employment growth and business vibrancy.
Exhibit 6: Boston receives ~250,000 net commuter inflows from surrounding metro areas, particularly
Metro South
Net receivers vs senders of commuter
flows
2018 inflows – outflows, thousand
worker
-48K 245K
0
Total in-commuters1 Total out-commuters
% of MA total, 2018 % of MA total, 2018
14.1% Metro South/West 16.5%
13.5% Boston 4.5%
11.6% Metro North 12.0%
9.3% South shore 10.1%
9.1% North Shore 10.2%
6.8% Bristol County 7.6%
6.2% Lower Merrimack Valley 6.5%
5.7% Brockton 6.3%
4.1% Greater Lowell 4.5%
3.9% North Central 4.7%
3.8% Greater New Bedford 4.2%
3.7% Central MA 3.9%
3.5% Franklin/Hampshire 3.9%
3.2% Hampden County 3.5%
1.3% Cape & Islands 1.5%
0.3% Berkshire County 0.2%
1. Includes in-commuters from other states. Bases between in and out-commuters are different
Source: American Community Survey 5-year estimates for 2018
2203 – 02
HYBRID WORK
WILL LIKELY DRIVE
DEMAND FOR
FLEXIBLE CHILDCARE
OPTIONS, REQUIRING
CHILDCARE
BUSINESS MODEL
TO EVOLVE
23The type of childcare needed may change costs, yet also ranks as having the highest
after the pandemic. Early surveys done by the quality childcare programs.33 In an independent
Massachusetts Department of Early Education assessment of state childcare, Massachusetts
and Care (EEC) show that parents in hybrid work was ranked amongst the top states on quality
models may need more sporadic, part-time day based on percentages of National Association for
care for the one to two days per week when the Education of Young Children (NAEYC) and
they go into the office and that not as many National Association of Family Child Care (NFCC)
families will seek five days of full-time care as accredited facilities.34 As of 2020, the average cost
they had before the pandemic. Per our surveys of childcare for a Massachusetts family with two
with Commonwealth business leaders, most children ages four or below was about 39 percent
employers (in occupations capable of supporting of the average household income.35 In 2019, the
remote work) are planning to adopt a hybrid state faced a severe shortage of childcare supply,
model and employee preferences have shifted with an estimated workforce gap of 25,000 to
since before the pandemic, with 63% of employees 30,000 workers to care for children ages zero to
now preferring hybrid or remote work models five.36 To compound matters, childcare center
compared to just 38% pre-COVID-19 and greater capacity was reduced by 13 percent in 2020 due
than 10 percentage more than what is observed to COVID-19. EEC estimates that in 2021, childcare
in global surveys. The location of childcare needs capacity will return to ~90 percent of pre-COVID-19
may shift; employees may seek childcare close to capacity levels. Our modeling shows that in order
home rather than close to the workplace as they to eliminate the childcare availability challenges
spend more days working from home. Increased facing working parents in Massachusetts through
demand for part-time childcare and changes in 2030, a large influx of childcare workers will be
location preferences may further challenge the necessary.
sustainability and viability of existing childcare
models. Addressing this challenge will be critical Employers are beginning to recognize the need
as the lack of available, adequate childcare is one to support workers in finding flexible, affordable
of the top barriers to getting workers back to childcare options. In the Massachusetts Future of
work (Exhibit 7). Childcare is also more relevant to Work business survey, the number of respondents
getting more women back to work. Decades of considering offering childcare support in the
research show that women do significantly more future increased by 72 percent from pre-COVID-19
housework and childcare than men—so much so numbers (from 22 percent to 39 percent of
that women who are employed full-time are often respondents).37 While helpful, such benefits
said to be working a “double shift.”31 Increased and programs alone will not solve today’s gap
childcare burdens from the pandemic have in childcare capacity or shortage of childcare
impacted women disproportionately.32 Innovation workers. There is a unique opportunity for a) EEC
will be critical to meeting the evolving needs of to help childcare programs rethink their business
families and ongoing workforce challenges in models to adapt to the changing needs of working
delivering affordable childcare. EEC is planning to parents (given hybrid work and a move from
use part of the federal stimulus funds for grants spending time in urban cores to more residential
to childcare providers to foster innovation to areas) and b) employers to also innovate and
meet the evolving needs of working families in redesign the workday in ways that provide parents
Massachusetts. more flexibility, such as shifting away from the
standard 9-5 workday and enabling working
In addition, in 2019, Massachusetts ranked parents to plan around school drop off and pick up
amongst the most expensive states in childcare times. Doing so could create a more inclusive work
24Exhibit 7: Childcare needs are a top barrier to getting workers back into the office, according to
survey respondents
Top perceived barriers to get employees back in Employers offering or considering to offer
the office1 childcare (N=223)2
Most cited responses by % in each category
Pre-COVID-19 Post-COVID-19
Ranked 1-4 Ranked 5-9 N/A
N=223 Yes
Health concerns 22% Yes
73% 9% 18% 39% No
No 61%
Employees prefer working at home 78%
61% 19% 19%
Childcare needs
60% 20% 20%
Elder care needs 1. If you have employees working remotely and would want
some or all to return to working on location/in an office for
40% 35% 25% at least some of the time vs. remotely, what do you believe
to be the biggest barriers that your employees would face
in returning to work in person?
Employees have moved/relocated further away
2. Childcare support - Check yes if you have any of the
36% 37% 27% following benefits pre-COVID or if you are anticipating
offering them to some or all employees post-COVID
Inadequate transportation options Source: MA Business Survey, April 2021
21% 49% 30%
environment that encourages greater workforce affordable childcare for ages 0-5 and before/after-
participation, especially amongst women who school care for school-aged children is likely to still
historically have disproportionately left the remain a barrier to workforce participation. In the
workforce due to childcare concerns. Massachusetts Future of Work Survey, 13 percent
of respondents with children said they might
As of April 2021, in Massachusetts, the labor force resume working or enter the workforce if they
of female workers dropped by 5.1 percent relative had access to additional childcare.39 Conversations
to pre-pandemic levels, compared to 1.7 percent with business leaders revealed that the combined
for male workers. Female employment recovery challenges of childcare and housing affordability
to pre-COVID-19 levels is expected to lag behind make it more difficult for employers to attract
males’ recovery rates by 18 months.38 This could talent to Massachusetts.
potentially contribute to workforce shortages in
high-growth jobs that tend to be staffed more
by women (such as nurses, home health aides
and teaching assistants) and may exacerbate
existing inequities. Female employment recovery
is expected to accelerate once K-12 schools go
back to being full time in-person, yet access to
2503 – 03 PUBLIC-TRANSIT RIDERSHIP IS EXPECTED TO FALL, WITH THE STEEPEST DECLINE LIKELY IN COMMUTER RAIL 26
Across US transit systems, ridership declines have                    in work from home) and non-work trips (for
been steepest in systems that have a higher share                     example, e-commerce replacing a shopping trip),
of work trips, and whose ridership base has a                         as well as 2) mode shift to either automobiles
higher share of riders who are able to work from                      or non-automobiles (for example bicycle trips
home. As a result of these two factors, commuter                      and walking) from lapsed transit riders using
rail ridership has fallen more and has been slower                    alternatives they have grown accustomed to using
to return than subway ridership, which in turn                        during the pandemic. This modeling shows that
has been slower to return than bus ridership. This                    commuter rail will be most strongly affected by
pattern is seen in the Boston metropolitan area as                    such changes; some 15 to 50 percent of its pre-
well: in January 2021 ridership was down to about                     pandemic ridership base could be lost over the
15 percent of pre-pandemic levels (versus around                      long-term, depending on the scenario and the
45 percent for bus ridership and about 20 to 30                       percentage of commuters who continue to work
percent for subway ridership).40 Public transit                       from home (Exhibit 8). Less impacted will be bus
ridership recovery by 2025 has been modeled                           ridership, with a potential loss of 5 to 20 percent;
based on two core changes, 1) the amount of                           followed by subway ridership, which could sustain
lost trips (for example, trips that are no longer                     a loss of 5 to 25 percent.
happening) for both work trips (due to increase

Exhibit 8: Up to 50% of commuter rail ridership may be lost by 2025 if remote/hybrid work becomes
more permanent and commuters sustain shift to transportation by auto

     Aggressive shift to auto        Low shift to auto          2019 average daily trip volume, ‘000s

Modeled 2025 Massachusetts public transit ridership as a share of 2019 ridership1
%
                       Overall                     Bus                          Subway                       Commuter Rail

A. Return to pre-
COVID-19 levels
                                87          94             89            96              88             95           78      86

B. Trends
continue at
levels seen                     80          88             85            93             81              88       64          73
during COVID-19

C. Remote work
becomes more                    74          83             81            89             74              81      51           60
permanent

                       ~1,000                       ~300                         ~600                        ~100

1.   Methodology and definitions detailed in appendix
Source: American Community Survey, National Transit Database

27
Commuter rail represents 31 percent of for the 2-3 days a week when they go into the
Massachusetts Bay Transportation Authority’s office instead of using public transit, there may
(MBTA’s) operating revenues ($239 million in be a shift from ridership across all modes to
2019). A 15 to 50 percent fall in ridership, therefore, transportation by automobile representing 12-
could mean a 5 to 17 percent decline in overall 14 million additional annual auto trips. This may
MBTA operating revenue, and an overall decrease drive up congestion, pollution (including NOx, CO2
in farebox recovery ratio, from 44 percent to 36 and PM2) and fatalities, while also intensifying
percent.41 Services and contracts for commuter pressure on downtown parking. These effects not
rail were already challenged prior to COVID-19 only have safety and non-mobility implications
due to operating losses and slow growth in but also could threaten the state’s ability to reduce
ridership. Future-of-work challenges could further greenhouse gases and emissions.
compound these issues and pose additional
challenges to the commuter rail business. The Additionally, road traffic has proven more resilient
sustainability of the current business model for than transit ridership throughout the pandemic.
commuter rail may then come into question, as Road trips, according to the Massachusetts
it relies on selling monthly passes to a narrow Department of Transportation, have recovered to
market of riders who are headed to either North or 85 percent of pre-pandemic levels, while public
South Station, during peak hours. transit (subway, commuter rail and bus) remained
at about 30 percent of pre-pandemic levels in
According to our modeling, remote/hybrid work February of 2021.43 This may be because work trips
could decrease peak-hour automobile vehicle represent a smaller share of road trips than transit
miles traveled by around 2 to 9 percent (Exhibit 9). trips (about 17 percent44 of road trips versus an
However, these effects may be counterbalanced by estimated 50 percent of transit trips). Further, the
less efficient “trip-chaining” (i.e. making multiple pandemic engendered negative views of transit
single-purpose trips, versus linking work and non- among consumers,45 and e-commerce and the
work trips) and an increase in home deliveries (as associated freight traffic increased.46
e-commerce is expected to make up 38 percent
of total retail spend by 2030).42 Additionally, A final finding has been that the number of
the Massachusetts Port Authority (“Massport”) vehicle miles traveled (VMT), a measurement
observed a return of regional traffic in the Sumner of traffic volume, has recovered more strongly
Tunnel and Ted Williams Tunnel, with traffic at in suburban areas; for example, traffic recovery
or exceeding pre-pandemic 2019 levels for non- on the western section of the Massachusetts
airport traffic. Massport is also seeing an increase Turnpike has been more robust than on the
in vehicle trips per passenger post-pandemic, due Boston extension. This may increase over time
to reduced transit and shared-ride use. The peak as arterial commutes are replaced by more
time of day and concentration of travel may also localized, residential traffic as remote and hybrid
change, with hybrid work leading to reductions workers stay closer to home for shopping and
in peak-hour congestion on the arterials leading entertainment.
to Boston Central Business District. Specifically,
congestion may move from being concentrated The shift of traffic to local surface roads has
in the peak, headed into and out of Boston, additional implications. The “15-minute city”
to remaining steady all day, and increasing in concept (defined as an ideal geography in which
suburban areas. most human needs and desires are located within
15 minutes of travel) may become increasingly
As more commuters choose to use automobile attractive as communities seek to mitigate surface
28Exhibit 9: A 2-9% reduction in vehicle miles traveled is possible due to remote and hybrid work trends,
but other factors could counterbalance this shift
Non work-related VMT
Work-trips as a percentage of Work commute trips that could
Work-related VMT
vehicle miles traveled, 2017 be lost due to remote work1
Larger post-COVID-19 ~2-9% potential
30% shifts (3 days of remote reduction in total
30-35% work for those eligible) vehicle miles
traveled from
remote work
Modest post-COVID-19 impact (all else
10% shifts (2 days of remote equal)2
work for those eligible)
1. Based on commuter industries
2. Decrease in auto usage for commuting likely to be be larger than any mode shift from transit to auto, however does not
include other behavioral change impacts like increased travel from road trips or visiting family
Source: ACS, National Report on Commuting Pattern and Trends in America, MA Resident Survey April 2021
road congestion. Similarly, placemaking (defined An increase in suburban congestion and VMT
as planning, design and management of public could likewise lead to an increase in CO2 emissions
spaces such as creation of community parks and and accidents on surface roads, thus eroding
art installations), suburban retrofitting (such as residents’ quality of life and safety. Finally, the
redevelopment/urbanization to increase density demand for electric vehicles (EV) and charging
and walkability), and downtown densification stations may rise as EV costs decrease, and
will likely take on new importance, making land residents shift to short-range trips (since EVs often
use and transportation design increasingly have only short ranges of travel) and charge their
interdependent. Demand for bike/pedestrian/ vehicles closer to home.
anywhere-to-anywhere infrastructure will rise.
29You can also read