PUBLICATIONS Water Resources Research - IMPREX
←
→
Page content transcription
If your browser does not render page correctly, please read the page content below
PUBLICATIONS
Water Resources Research
RESEARCH ARTICLE                           genRE: A Method to Extend Gridded Precipitation Climatology
10.1002/2017WR021201
                                           Data Sets in Near Real-Time for Hydrological Forecasting
Key Points:                                Purposes
 Generalized REGNIE (genRE) is
  designed to extend climatological        B. van Osnabrugge1,2       , A. H. Weerts1,2, and R. Uijlenhoet2
  precipitation data sets in near
                                           1
  real-time using (sparse)                  Operational Water Management Department, Deltares, Delft, The Netherlands, 2Hydrology and Quantitative Water
  measurement networks                     Management Group, Department of Environmental Sciences, Wageningen University & Research, Wageningen, The
 genRE successfully mimics
  climatological precipitation data sets
                                           Netherlands
  (HYRAS/EOBS) over daily, monthly,
  and yearly time frames
 A 1.2 3 1.2 km hourly precipitation      Abstract To enable operational flood forecasting and drought monitoring, reliable and consistent meth-
  data set (1996–2015) was created for     ods for precipitation interpolation are needed. Such methods need to deal with the deficiencies of sparse
  the Rhine basin in western Europe
  with genRE, extendable in real time
                                           operational real-time data compared to quality-controlled offline data sources used in historical analyses. In
                                           particular, often only a fraction of the measurement network reports in near real-time. For this purpose, we
Supporting Information:                    present an interpolation method, generalized REGNIE (genRE), which makes use of climatological monthly
 Supporting Information S1                background grids derived from existing gridded precipitation climatology data sets. We show how genRE
 Data Set S1–S17                          can be used to mimic and extend climatological precipitation data sets in near real-time using (sparse) real-
                                           time measurement networks in the Rhine basin upstream of the Netherlands (approximately 160,000 km2).
Correspondence to:                         In the process, we create a 1.2 3 1.2 km transnational gridded hourly precipitation data set for the Rhine
B. van Osnabrugge,
bart.vanosnabrugge@deltares.nl             basin. Precipitation gauge data are collected, spatially interpolated for the period 1996–2015 with genRE
                                           and inverse-distance squared weighting (IDW), and then evaluated on the yearly and daily time scale
Citation:                                  against the HYRAS and EOBS climatological data sets. Hourly fields are compared qualitatively with RADO-
van Osnabrugge, B., Weerts, A. H., &       LAN radar-based precipitation estimates. Two sources of uncertainty are evaluated: station density and the
Uijlenhoet, R. (2017). genRE: A method     impact of different background grids (HYRAS versus EOBS). The results show that the genRE method suc-
to extend gridded precipitation
climatology data sets in near real-time    cessfully mimics climatological precipitation data sets (HYRAS/EOBS) over daily, monthly, and yearly time
for hydrological forecasting purposes.     frames. We conclude that genRE is a good interpolation method of choice for real-time operational use.
Water Resources Research, 53. https://     genRE has the largest added value over IDW for cases with a low real-time station density and a high-
doi.org/10.1002/2017WR021201
                                           resolution background grid.

Received 26 MAY 2017
Accepted 17 OCT 2017
Accepted article online 24 OCT 2017

                                           1. Introduction
                                           Accurate and reliable areal gridded precipitation is one of the most important hydrometeorological input
                                           variables for hydrological model development and calibration, extreme value estimation, as well as for oper-
                                           ational hydrological forecasting. With the advent of high temporal and spatial resolution hydrological mod-
                                           els (e.g., Bierkens et al., 2015; Wood et al., 2011), there is an increasing need for estimates of precipitation at
                                           equally high temporal and spatial resolutions (Euser et al., 2015; Melsen et al., 2016). For operational hydro-
                                           logical forecasting, high-resolution forcing data are needed to derive the best estimates of the initial condi-
                                           tions at the start of the forecast. Subsequently, data assimilation techniques (Liu et al., 2012; Rakovec et al.,
                                           2012, 2015) may be used to further improve these initial state estimates. High-resolution historical precipita-
                                           tion data are also needed to resolve the model tendencies of the weather forecasts with equally high
                                           accuracy.
C 2017. The Authors.
V
This is an open access article under the
                                           In Europe, current and past efforts to construct transnational (gridded) data sets of precipitation have
terms of the Creative Commons              mainly focused on climatological analyses (Haylock et al., 2008; Isotta et al., 2014; Photiadou et al., 2011;
Attribution-NonCommercial-NoDerivs         Rauthe et al., 2013). The derived data sets have space-time resolutions appropriate for climatological analy-
License, which permits use and             ses, where trends encompassing periods of decades are investigated. However, they do not meet the high
distribution in any medium, provided
                                           resolutions needed for local modeling of streamflow, where relevant processes need to be resolved at sub-
the original work is properly cited, the
use is non-commercial and no
                                           daily time scales (Ficchı et al., 2016; Lobligeois et al., 2014), and local spatial differences in precipitation can
modifications or adaptations are            be large, especially in mountainous areas (Tobin et al., 2011). Such areas are not covered in sufficient detail
made.                                      in the current gridded data sets.

van OSNABRUGGE ET AL.                             genRE: METHOD FOR NRT PRECIPITATION INTERPOLATION                                                           1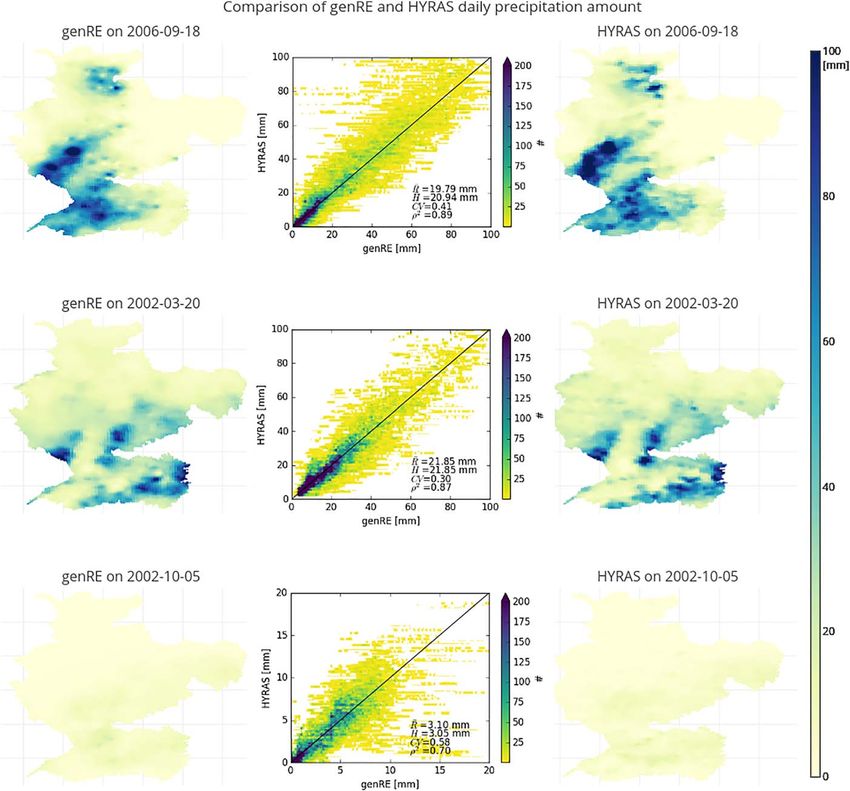
Water Resources Research                                                                 10.1002/2017WR021201

                            Currently available gridded data sets are not available in near real-time, needed for hydrological forecasting,
                            either. Deriving high-quality near real-time gridded forcing data for operational hydrological forecasting is a
                            challenge. While some European national meteorological agencies provide this kind of information in near
                            real-time, for many national hydrological agencies this information is not available. As a consequence, the
                            task of deriving aerially averaged rainfall in near real-time is often conducted by the responsible hydrologi-
                            cal forecasting agencies. For transboundary catchments (e.g., Danube, Elbe, Oder, Rhine, and Sava), this is
                            an even greater challenge.
                            Additionally, hydrological models are calibrated to a certain spatial distribution of precipitation (Euser et al.,
                            2015). For example, a structural overestimation of precipitation in one region might be compensated for in
                            the model with larger soil stores to dampen the peak flow resulting in good calibration scores, but for the
                            wrong reasons (Kirchner, 2006). An important requirement for the hydrological forecasting agencies is
                            therefore that the real-time precipitation estimates should reflect the climatology of the data used for
                            calibration.
                            The main issue hampering the derivation of high-quality precipitation information in near real-time is the
                            limited availability of rain gauge data, either due to restrictions in the equipment and infrastructure used or
                            due to restrictions placed on the data by the data provider. Many more historical observations are often
                            available for deriving climatological daily precipitation grids, providing important information on oro-
                            graphic and other effects on areal precipitation which is difficult to derive in near real-time.
                            It seems therefore attractive to capture this hard-won information from climatological gridded precipitation
                            data sets and use it to emulate and extend these high-quality data sets in near real-time for hydrological
                            forecasting purposes, but based only on operationally available data.
                            With this goal in mind, we describe in this paper an interpolation method for operational use called genRE.
                            We propose that genRE is a suitable candidate to bridge the gap between high-quality offline climatological
                            data sets and the real-time operational data sets needed by hydrological forecasting agencies.
                            The genRE method is evaluated regarding its capacity to emulate the HYRAS climatological data set (Rauthe
                            et al., 2013) for hydrological forecasting purposes in the Rhine basin in western Europe upstream of the
                            Dutch border. However, the method is not only applicable in the Rhine basin but can be employed in any
                            (transnational) basin to derive gridded areal precipitation data sets for operational streamflow forecasting if
                            a suitable gridded climatological precipitation data set is available.
                            The aim of this work is therefore: (1) to investigate if the genRE method indeed mimics and extends clima-
                            tological precipitation data sets in near real-time using (sparse) real-time rainfall measurement networks, (2)
                            to create a high-resolution (near real-time) gridded precipitation data set for the purpose of high-resolution
                            hydrological modeling of streamflow and (re)forecasts in the Rhine basin, and (3) to evaluate the precipita-
                            tion interpolation procedure used, in a hydrological sense.
                            Considering our aims, we answer the following research questions:
                            1. Does the use of a background grid based on a reference climatological gridded data set for interpolation
                               of hourly rain gauge observations result in comparable climatology and realistic areal precipitation fields
                               at different (yearly, daily, and hourly) temporal scales for operational forecasting?
                            2. What is the effect of station density on the quality of the obtained gridded data sets, and how is the
                               background grid affected by the length of the employed climatological reference?
                            3. Does the use of the genRE method lead to modeled discharges which are consistent with those obtained
                               with the reference climatology as forcing for a model that is calibrated on the latter?
                            The data and study area are presented in section 2. Sections 3.1 and 3.2 describe the genRE interpolation
                            method and the employed hydrological model. The evaluation setup is explained in section 4. The results
                            are presented in section 5, followed by discussion and conclusion in sections 6 and 7.

                            2. Study Area and Data
                            2.1. Rain Gauge Data
                            The Rhine basin upstream of the Dutch border (approximately 160,000 km2) is part of eight different coun-
                            tries (Figure 1). To ensure a smooth transition over the basin borders, data were also collected for The

van OSNABRUGGE ET AL.              genRE: METHOD FOR NRT PRECIPITATION INTERPOLATION                                                        2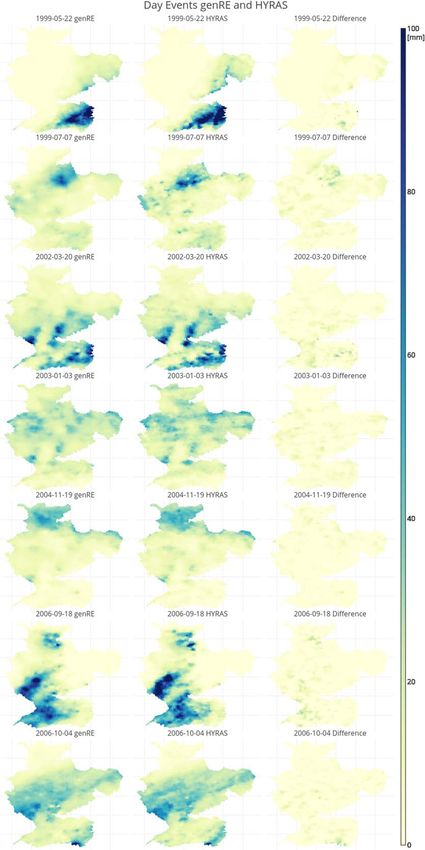
Water Resources Research                                                                     10.1002/2017WR021201

                            Figure 1. Overview of the Rhine basin in UTM32N projection with Digital Elevation Model as background. The thick black
                            lines delineate the eight major subcatchments with names in italic blue. The thin grey lines represent 148 smaller sub-
                            catchments. The black squares show the locations of four streamflow measurement stations used in Figure 12.

                            Netherlands. Consequently, precipitation data were collected from seven different providers. Some of the
                            data are freely available (Netherlands, Germany). Other data could be accessed after subscription (Switzer-
                            land), or were provided without fee after contacting the provider (Luxembourg, Belgium, France). Data for
                            the Austrian and Liechtensteinian part of the basin (five stations) were collected from an operational archive

van OSNABRUGGE ET AL.              genRE: METHOD FOR NRT PRECIPITATION INTERPOLATION                                                              3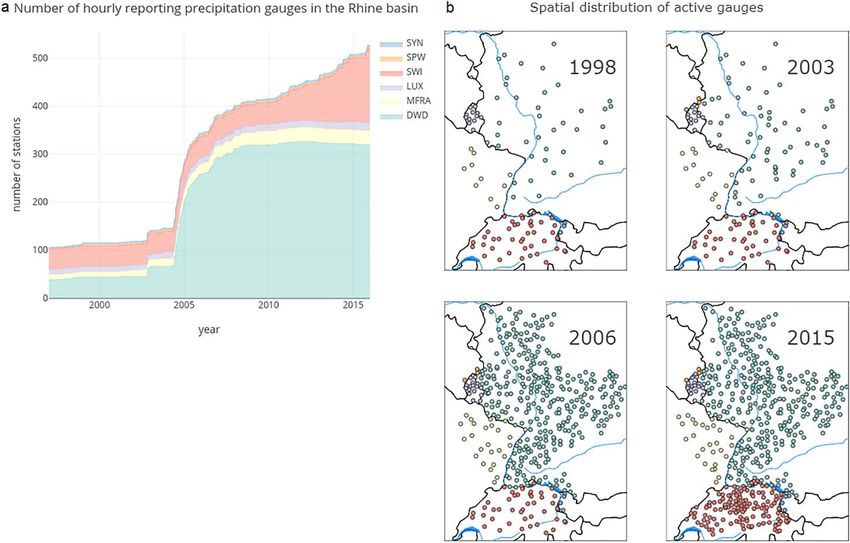
Water Resources Research                                                              10.1002/2017WR021201

                            of SYNOP precipitation stations provided by the Bundesanstalt f€    ur Gew€asserkunde (BfG, Germany).
                            Although a tiny part (51 km2) of the Rhine basin can be found in Italy, no data were collected from that
                            country. A complete list of data providers and how the data were accessed is given in supporting informa-
                            tion Table S1.
                            All available stations with hourly resolution have been used in the interpolation scheme. It was decided to
                            start interpolation in June 1996 as this was the start time of the hourly precipitation gauge series made
                            available on the DWD climate data server which covers Germany.
                            The total number of stations contributing to the data set at each time step and their spatial distribution are
                            shown in Figure 2. Two things are worth noticing. First, the number of stations available in near real-time
                            steadily increases over time, with the quickest increase between 2004 and 2008. To stress the point of the
                            limited availability of real-time data, keep in mind that the complete observation network includes more
                            stations than in the 2015 figure, for the whole period. Second, the number of stations with measured data
                            at each individual (hourly) time step fluctuated. Large downward peaks resembled moments in time where,
                            for example, no data were recorded for any of the German stations. The loss of station coverage for a large
                            part of the domain is incidental and is dealt with through a preprocessing step in the interpolation proce-
                            dure, detailed in section 3. For clarity, those outings are not shown in Figure 2a.
                            The data were checked for outliers. The check relies on simple thresholds based mainly on record values
                            measured in Germany and expert opinion of operational forecasters in the Rhine basin (Weerts et al., 2008).
                            Individual hourly values above 90 mm and below 0 mm were removed from the data set, which resulted in
                            the removal of only seven occurrences of values above this threshold and two instances of erroneous
                            reporting of negative precipitation. As a secondary check, time series were checked against multiple thresh-
                            olds for different aggregation times: 50, 90, 120, 150, and 250 mm for 1, 3, 6, 12, and 24 h, respectively.
                            Instances where the threshold was exceeded were flagged and investigated manually to assess if the
                            recording was plausible.
                            It should be noted that no check was performed on the long-term consistency (temporal homogeneity) of the
                            time series and that artifacts of changing measurement conditions are to be expected. Together with the chang-
                            ing measurement density this makes the created data set unsuitable for trend analysis (Peterson et al., 1998).

                            2.2. Reference Precipitation Climatology Data Sets
                            In this study, we compare our gridded precipitation estimates with three gridded precipitation data sets
                            (Table 1).
                            1. The HYRAS (HYdrologische RASterdatens€atze) v2.0 (Rauthe et al., 2013) data set, which was obtained via
                               the Bundesanstalt f€ur Gew€asserkunde (BfG).
                            2. The E-OBS v13.1 (Haylock et al., 2008) gridded data set, which was retrieved from the European Climate
                               Assessment and Dataset website.
                            3. RADOLAN (Bartels et al., 2004) gauge adjusted precipitation estimates, taken from the data feed of the
                               experimental operational forecasting system for the Rhine running at Deltares.
                            2.2.1. HYRAS
                            The HYRAS data set has been developed by the German Weather Service (DWD) (Rauthe et al., 2013). The
                            data set covers the so-called KLIWAS domain, which comprises a number of transboundary river basins that
                            flow through Germany, including the Rhine. The gridded estimates are created using the REGNIE method,
                            which is explained in section 3.1, from a database of at maximum 6,000 stations spread over the larger
                            KLIWAS domain. Based on Rauthe et al. (2013, Figure 2), we estimate that the station density is at least com-
                            parable with the state of the hourly real-time reporting network of Figure 2b for the year 2015.
                            2.2.2. EOBS
                            The European Daily High-Resolution Observational Gridded Dataset (E-OBS) (Haylock et al., 2008) is based
                            on daily precipitation observations from the European Climate Assessment and Dataset (ECA&D; http://
                            www.ecad.eu) and interpolated with a three-step method. At the time of writing, 62 stations were active
                            inside the Rhine basin out of a total of 11,383 stations in the complete database (European Climate Assess-
                            ment & Dataset, 2017). First, monthly sums are interpolated using trivariate thin-plate splines with latitude,
                            longitude, and elevation as variables. Second, the daily anomalies are interpolated using universal Kriging.
                            Last, the monthly and daily steps are combined. The method provides daily standard errors for every grid
                            square.

van OSNABRUGGE ET AL.             genRE: METHOD FOR NRT PRECIPITATION INTERPOLATION                                                     4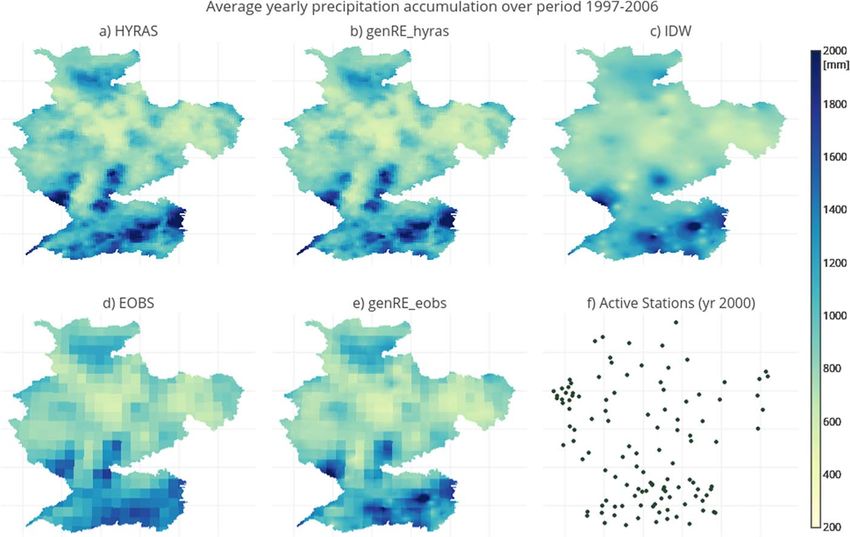
Water Resources Research                                                                                  10.1002/2017WR021201

Figure 2. (a) Number of available precipitation gauges for each time step inside the Rhine basin upstream of the Dutch border. DWD: Deutscher Wetterdienst,
MFRA: Meteo France, LUX: Administration de la gestion de l’eau du Grand-Duch    e de Luxembourg, SWI: Meteo Swiss, and SYN: SYNOP stations from operational
archive; (b) spatial distribution of hourly reporting gauges for 4 years during the interpolation period. The black lines represent country borders and the blue lines
show the location of two major rivers: the Rhine from south to north and the Danube from west to east.

                                         2.2.3. RADOLAN
                                         RADOLAN (Radar-Online-Aneichung) (Bartels et al., 2004) is another precipitation product from the DWD. It
                                         merges gauge measurements from 1,300 stations with radar-derived precipitation from 16 weather radars cover-
                                         ing Germany. The merge is based on interpolating gauge precipitation and anomalies between gauge and radar
                                         data in different ways and then taking a weighted sum of the different components. Due to the range of the
                                         rain radars, the French part of the Rhine basin is also included. The Swiss part of the basin is excluded, however.

                                         3. Methods
                                         3.1. genRE Interpolation Method
                                         The genRE method was inspired by a method from the DWD (German weather service) called REGNIE
                                                                          €he,’’ which translates as ‘‘regionalized precipitation amounts’’) (Rauthe
                                         (‘‘REgionalisierte NIEderschlagsho
                                         et al., 2013). Because we deviate in a number of ways from the original REGNIE method to make it more
                                         generally applicable and applicable in real-time, we refer to the method as used in this paper as generalized
                                         REGNIE or genRE.
                                         The genRE and REGNIE interpolation method are two-step methods. First, monthly precipitation back-
                                         ground grids (MBGs) are derived, one for each month of the year, with the expected precipitation amount
                                         for each grid cell for that month. In particular, the MBGs can be derived from existing gridded climatological
                                         data sets by calculating the average monthly precipitation sum.
                                         Second, the monthly precipitation background grids are used in inverse-distance squared weighting as
                                         follows:

van OSNABRUGGE ET AL.                            genRE: METHOD FOR NRT PRECIPITATION INTERPOLATION                                                                   5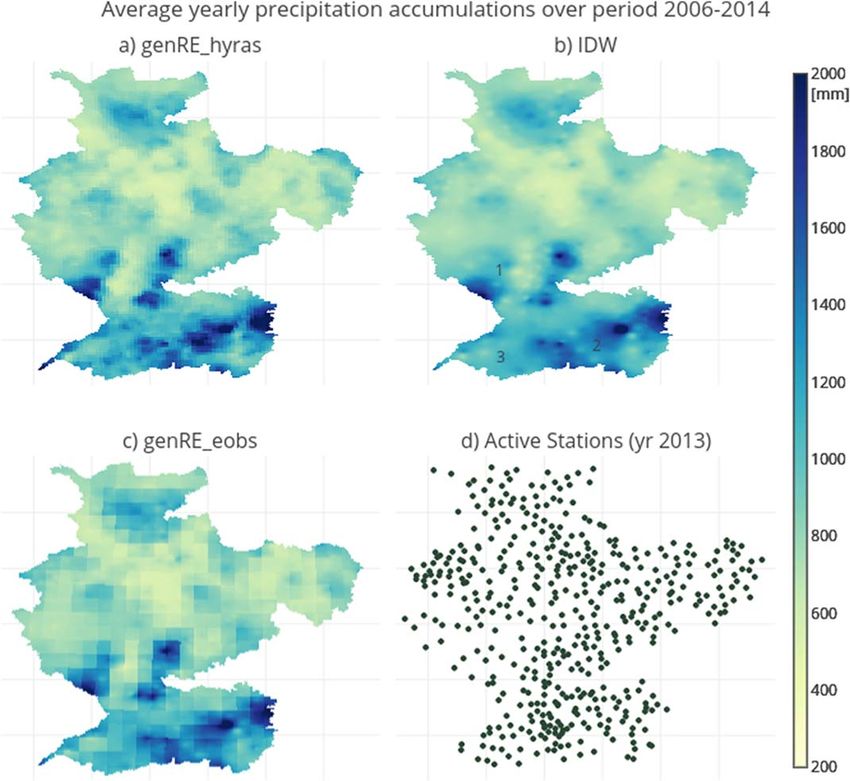
Water Resources Research                                                                   10.1002/2017WR021201

                            To calculate precipitation P at a given grid cell x from a number of n surrounding gauges, first calculate the
                            ratio between the value of the monthly background grid at location x and the value of the monthly back-
                            ground grid at the gauge location for every gauge i to create a set of multipliers mi;x from the gauges to
                            the given grid cell. Hence, mi;x would change based on the month:
                                                                                         MBGx
                                                                               mi;x 5                                                        (1)
                                                                                         MBGi

                            Next, determine a set of weights based on inverse-distance squared weighting between all gauges (typically
                            the n closest gauges) and the grid cell. This step can have a threshold for maximum distance as well. di;x is
                            the distance between gauge i and cell x:
                                                                                         1
                                                                                             =di;x 2
                                                                            wi;x 5 Pn           1= 2
                                                                                                                                             (2)
                                                                                         i51      di;x

                            Finally, use the weights and the multipliers to predict the precipitation at grid cell x:
                                                                                   X
                                                                                   n
                                                                            Px 5         Pi mi;x wi;x                                        (3)
                                                                                   i51

                            This formulation makes the role of the background grid clear. Precipitation measurements at locations that
                            are expected to be dry get amplified for cells that are expected to be wet and measurements at expected
                            wet locations are dampened for cells expected to be dry. Note that since mi;x has a range of [0,1), mi;x is
                            indeed a multiplier and not a weight.
                            For implementation, we use a slightly different form. Substituting equation (1) in equation (3) and taking
                            MBGx out of the summation gives:
                                                                                     Xn
                                                                                          Pi
                                                                         Px 5MBGx              wi;x                                          (4)
                                                                                     i51
                                                                                         MBG i

                            In this form, genRE can be easily implemented with an existing inverse-distance squared weighting package.
                            First relative precipitation, Pi =MBGi , is interpolated with inverse-distance squared weighting and then the
                            resulting relative precipitation field can be multiplied with the MBG to get the desired precipitation fields.
                            The main difference between REGNIE (Rauthe et al., 2013) and genRE is that the REGNIE method specifically
                            uses Multiple Linear Regression (MLR) to derive the montly precipitation background grids, based on five
                            explanatory variables: geographical longitude and latitude, height above sea level, exposition, and moun-
                            tain slope at the stations. In genRE, the background grids are calculated from existing climatological data
                            sets.
                            There are two reasons for using existing climatological data sets over deriving monthly climatological data
                            sets from raw data independently. First, as shown in this paper, using an existing climatology forces the
                            interpolation to spatially mimic the reference climatology, which is a quality sought after by flood forecast-
                            ers as calibrated models might be ‘‘tuned’’ to a certain areal distribution of rainfall (Andreassian et al., 2001).
                            Second, many flood forecasting agencies are tasked with deriving areal rainfall for their domains, but have
                            only access to a limited part of the available measurements. In many cases, the resources (time, people, and
                            money to purchase data) are lacking and thus this approach offers an alternative to other makeshift
                            solutions.
                            Two additional, smaller, differences between REGNIE and genRE are that we extend the use of genRE to
                            also interpolate on an hourly basis, where REGNIE was developed to interpolate daily accumulations, and
                            that we interpolate to each grid square in the field and do not copy station data directly to the related grid
                            square as is done in REGNIE. The first is not a methodological difference, but an extension of the use of the
                            algorithm for use at shorter time scales. The second decision was made because we did not see any reason
                            to give special treatment to cells containing stations, favoring a continuous approach. An additional advan-
                            tage is that the original measurements cannot be retrieved from the interpolated results, which can help
                            navigating data sharing agreements that prohibit sharing station data, but allow sharing of the interpolated
                            product.

van OSNABRUGGE ET AL.              genRE: METHOD FOR NRT PRECIPITATION INTERPOLATION                                                          6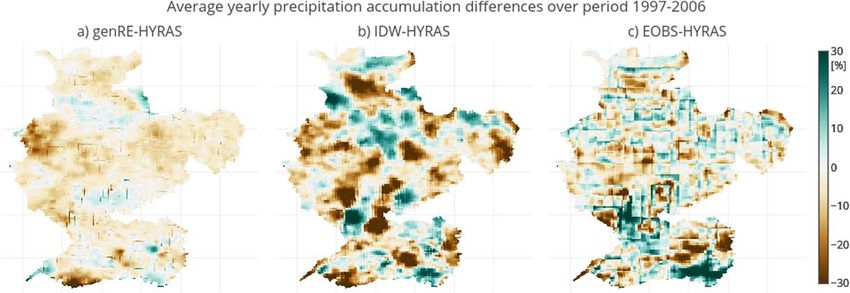
Water Resources Research                                                                10.1002/2017WR021201

                            3.2. Monthly Background Grids
                            The background grids are calculated from the HYRAS 2.0 gridded data set (Rauthe et al., 2013). This is done
                            simply by summation of the daily precipitation amounts for each calendar month over the full time span of
                            the HYRAS data set (1951–2006) and then dividing this by the total number of days. This results in 1 back-
                            ground field per calendar month, 12 in total, at the grid used in HYRAS (ETRS89-LCC with 5 3 5 km spatial
                            resolution). The background grids are included in the supporting information (S1). To calculate mi;x for each
                            grid cell, we resampled the background fields with nearest neighbor resampling to our model grid (1.2 3
                            1.2 km spatial resolution and projection in UTM32N). This was repeated to calculate background grids using
                            EOBS (Haylock et al., 2008) data for the period 1995–2016 to investigate the effect of the choice of back-
                            ground grid on interpolation results.
                            The nearest neighbor method for resampling the grids to our model grid was chosen to prevent smoothing
                            and to ensure that the background values at the station’s locations would not change. However, as a conse-
                            quence, multiple pixels from the 1.2 3 1.2 km grid that fall within one pixel of the lower resolution climato-
                            logical grids receive the same background grid value.

                            3.3. Implementation of genRE for the Rhine Basin
                            The method is already effectively employed as interpolation method in the operational flood forecasting
                            and drought monitoring system called ‘‘RWsOS Rivieren,’’ part of a clustered multihazard early warning sys-
                            tem operated by the Dutch Ministry of Infrastructure and the Environment (in Dutch: Rijkswaterstaat, RWS)
                            (Weerts et al., 2008). This genRE setup, however, was not yet evaluated for its intended purpose, namely to
                            closely mimic the HYRAS climatology, over a longer time period. genRE was implemented with the Delft-
                            FEWS (Werner et al., 2013) operational forecasting platform. The inverse-distance squared weights were cal-
                            culated from the eight closest stations (n 5 8) within a maximum distance of 100 km. A distance of 100 km
                            was chosen to ensure that there was full coverage for the whole basin at any time step. This is acceptable
                            as it is close to the decorrelation distance of hourly precipitation in the Netherlands, which is 90 km in
                            winter and 30 km in summer (van de Beek et al., 2012).
                            Specific to this Delft-FEWS implementation of genRE is how gaps in station data were handled. A gap filling
                            step was necessary because whole sections of the observation network did fail at the same time and sec-
                            ondly because of how the inverse-distance squared weighting was implemented in FEWS. In our FEWS
                            implementation, the active gauge network and related weights were calculated once for each day. A gauge
                            was included for interpolation for all days between the station’s first and last record in the database. During
                            preprocessing, it was verified for each station visually if there were any large gaps during this period. If nec-
                            essary, the active period was adjusted to remove unnecessary gaps. Still, stations could have missing data,
                            reflecting operational circumstances. Incidental gaps in station data were then filled in a two-step hierarchi-
                            cal procedure: (1) genRE itself is used to assign precipitation values for the station without data; (2) if gaps
                            remained, relative precipitation values are interpolated linearly in time with a maximum gap of 1 time step.

                            3.4. Hydrological Model of the Rhine Basin
                            The hydrological model used is the HBV (Hydrologiska Byråns Vattenbalansavdelning) model concept
                                    €m et al., 1997) applied to a 1.2 3 1.2 km grid as implemented in the open source hydrological
                            (Lindstro
                            modeling framework OpenStreams/wflow (Schellekens, 2016). The generated runoff is routed through the
                            river network with a kinematic wave approach (Schellekens, 2016). In the following, we refer to this model
                            as wflow_hbv.
                            The parameters for wflow_hbv were derived from an earlier HBV model, HBV-148, that is used in the daily
                            operational forecasting suite for the river Rhine at RWS. HBV-148 consists of 148 subcatchments where each
                            subcatchment is a hydrological response unit (HRU). The HRUs were parameterized through calibration with
                            a Generalised Likelihood Uncertainty Estimation (GLUE) like procedure (Beven & Binley, 1992), using HYRAS
                            precipitation as forcing data (Winsemius et al., 2013a, 2013b). To transfer parameters from HBV-148 to
                            wflow_hbv, every grid cell in wflow_hbv inherited the parameters of the subcatchment in HBV-148 the cell
                            belongs to.
                            During preliminary testing, the resulting streamflow generation of wflow_hbv was shown to be very close
                            to the streamflow generation of HBV-148. This gave confidence that the model behaves well enough to use
                            it for our current purpose of investigating the influence of different precipitation forcing data on streamflow

van OSNABRUGGE ET AL.              genRE: METHOD FOR NRT PRECIPITATION INTERPOLATION                                                      7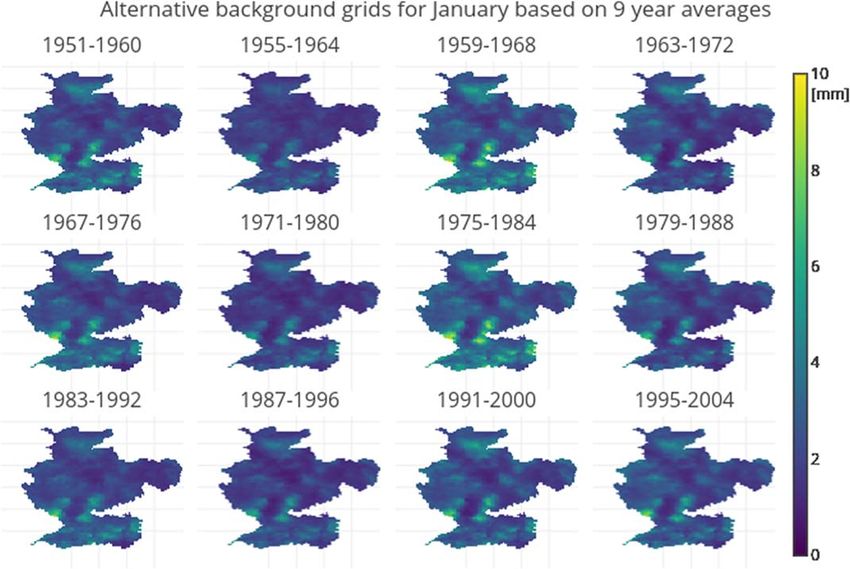
Water Resources Research                                                                             10.1002/2017WR021201

                            generation without the need to spatially aggregate the input forcing to the 148 subcatchments or costly
                            recalibration of wflow_hbv. This is not too surprising, as spatial proximity is known as a strong parameter
                                                             €schl, 2004).
                            regionalization method (Merz & Blo

                            4. Experimental Setup
                            To answer our research questions, we constructed several experiments. Concerning the first question, we
                            hypothesized that the climatology of interpolated precipitation gridded data sets made with genRE resem-
                            ble their donor climatology. This implies that the genRE climatology resembles the HYRAS climatology
                            where HYRAS is used as reference and that it resembles the EOBS climatology if EOBS is used as reference.
                            If no background grid is used, in which case genRE defaults to inverse-distance squared weighting, informa-
                            tion on orographic effects, etc., is lost.
                            To test this hypothesis, genRE was applied with background grids derived from the HYRAS and EOBS clima-
                            tologies, respectively, and the obtained climatology (yearly sums and monthly averages) was compared
                            with plain inverse-distance squared weighting and the HYRAS and EOBS climatologies for the period 1997–
                            2006. Furthermore, we compared genRE with the HYRAS data set for daily accumulations and with the
                            RADOLAN gauge adjusted radar product for hourly fields. The latter comparison is only qualitative to reflect
                            on the spatial detail found with the present day gauge network with genRE.
                            We expect that as the station density increases, the influence of the background grid will diminish. For this
                            purpose, the obtained spatial patterns of yearly precipitation accumulations are compared for two time
                            periods of interpolation: 1997–2006 and 2006–2014. During the latter period, the station density is much
                            higher as the number of stations has increased from roughly 100 stations to 500 stations inside the basin
                            (see also Figure 2 in the data section).
                            To investigate the effect of density in a quantitative manner, the Pearson correlation coefficient was calcu-
                            lated between the yearly sum grids from plain inverse-distance squared weighting and the genRE method
                            for each year. The correlation is expected to increase with station density.
                            The variability in the background grid was investigated by taking a 9 year moving average of monthly pre-
                            cipitation amounts from the HYRAS data record of 56 years resulting in 47 possible background grids for
                            each month. These were normalized by dividing them by the value of the background grid obtained by
                            averaging over all 56 years. Then, the 47 normalized values were used to determine the standard deviation
                            for each grid cell for each month. The 9 year moving average was chosen to reflect the time span over
                            which the results were analyzed, which is 10 years (1997–2006) and 9 years (2006–2014).
                            Additionally, minimum and maximum background grids were calculated for each month by taking the mini-
                            mum and maximum of all 47 possible background grid values for each pixel, respectively.
                            Finally, the hydrological model is fed with both genRE precipitation and HYRAS precipitation. The modeled
                            discharge for each location is extracted from the model grid by determining on which pixel the streamflow
                            gauge is located. Where the gauge coordinates did not coincide with the right streamflow pixel, as deter-
                            mined by visual comparison between the locations of streams in openstreetmap and the stream network
                            from the model, the gauge coordinates were adjusted to match the right stream in the model.
                            The hydrological impact of choosing the HYRAS or genRE data set as precipitation forcing over the period
                            1997–2006 is expressed by calculating the Kling-Gupta Efficiency (KGE) (Gupta et al., 2009). To exclude sites
                            where the model performed nonbehaviorally and thus to limit the effect of model setup on our analysis of
                            the effect of precipitation forcing, we only analyze pairs for which the model results were deemed behav-
                            ioral, expressed as a KGE > 0.5 for at least one of the applied forcings. The model runs start on 1 June 1996
                            and the first half year is used as spin-up period.
                            The Kling-Gupta efficiency is calculated by:
                                                                     qffiffiffiffiffiffiffiffiffiffiffiffiffiffiffiffiffiffiffiffiffiffiffiffiffiffiffiffiffiffiffiffiffiffiffiffiffiffiffiffiffiffiffiffiffiffiffiffiffiffiffiffi
                                                               KGE512 ðr21Þ2 1ða21Þ2 1ðb21Þ2                                                  (5)

                                                                                            rm
                            With,                                                     a5
                                                                                            ro

van OSNABRUGGE ET AL.               genRE: METHOD FOR NRT PRECIPITATION INTERPOLATION                                                           8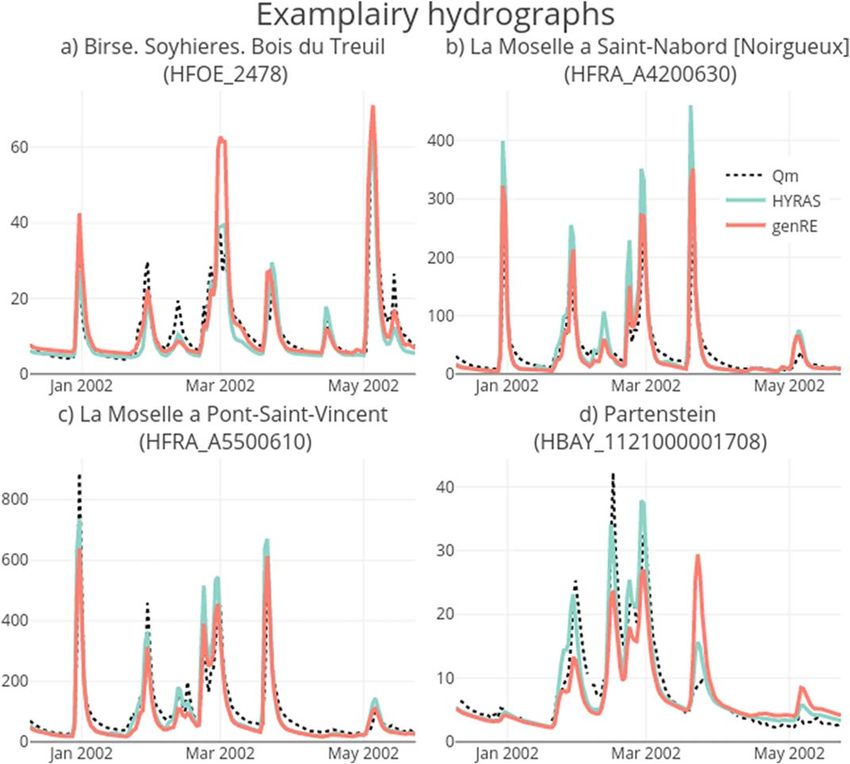
Water Resources Research                                                                  10.1002/2017WR021201

                                                                                       lm
                                                                                  b5
                                                                                       lo

                            In which r is the linear correlation coefficient between modeled and observed values, r the standard devia-
                            tion and l the mean of modeled (m) and observed (o) flows.

                            5. Results
                            5.1. Climatological Evaluation of genRE Approach
                            To show the influence of the genRE method, three interpolation schemes were used: genRE with HYRAS as
                            background grid, genRE with EOBS as background grid, and plain inverse-distance squared weighting. The
                            results were compared with their respective reference climatologies. Following the rationale behind the
                            genRE approach, the expectation was that the interpolated products would closely match the spatial pat-
                            terns found in their respective climatology reference.
                            The genRE products match indeed their reference climatologies, especially when compared with plain
                            inverse-distance squared weighting, and the influence of the genRE method is clear in that Figures 3b and
                            3e resemble their reference climatologies in Figures 3a and 3b. There are clear differences in spatial patterns
                            of yearly average precipitation accumulations between methods and between reference climatologies.
                            The genRE, IDW, and EOBS climatologies are significantly different from the HYRAS climatology (Figure 4).
                            At first sight Figure 3 seemed to indicate that, even for the period (1997–2006) with relatively low network
                            density, the yearly patterns found in HYRAS are well emulated with the genRE method. However, the genRE
                            method results in 4% less rainfall over the whole Rhine basin compared to HYRAS over the period 1997–
                            2006 (Figure 4).
                            The largest biases are concentrated in a number of regions. First, large biases are seen in Luxembourg and
                            southern Switzerland (Figure 4a), where genRE yields up to 30% less precipitation than HYRAS. Second,
                            there are a number of distinct points (e.g., clear red and blue dots in Switzerland) where genRE underesti-
                            mates or overestimates precipitation compared to HYRAS, which seem to be related to locations where indi-
                            vidual stations in genRE have a large weight because of the lesser station density compared to HYRAS.
                            Although locally the differences between genRE and HYRAS are substantial, those differences are smaller
                            than those between IDW and HYRAS (Figure 4b).
                            The EOBS climatology has the same spatial distribution of precipitation as the HYRAS climatology
                            and genRE, but much more diluted due to the coarser spatial grid as rain rates are a function of scale
                            (Tan et al., 2017). The effect of averaging over larger regions becomes especially significant when the EOBS
                            climatology precipitation values are projected on the higher-resolution grid of genRE (as would be the case
                            when using EOBS data with a high-resolution hydrological model). Although the bias of the EOBS climatol-
                            ogy compared to the HYRAS climatology is small, large local differences due to the spatial averaging are
                            visible, following a raster-like pattern (Figure 4c). Local differences between the HYRAS and EOBS reference
                            climatologies are much larger than between HYRAS and ‘‘emulated HYRAS’’ with the genRE method
                            (Figure 4a). A raster-like pattern is also, but less, visible in the other subfigures, which is caused by resolution
                            differences between the genRE and climatological HYRAS grid.
                            The differences in climatology between HYRAS and genRE persist also when evaluating the grids on multi-
                            year monthly averages (Figure 5), with the largest average biases during autumn and winter. Based on the
                            spatial pattern, we noted structural underestimation or overestimation of precipitation in the same areas as
                            before.
                            For the 1997–2006 period, genRE underestimates precipitation sums compared to both HYRAS and EOBS in
                            most subbasins for January, February, and October–December. Additionally, genRE underestimates precipi-
                            tation sums compared to HYRAS in the Moselle subbasin for the whole year.
                            In Figure 6, we compare seven of the most extreme rainfall events, which gave the highest areally averaged
                            precipitation over the different main subbasins according to HYRAS in the period 1996–2006. The matching
                            patterns are evident, although HYRAS has a sharper delineation of local peaks and between precipitating
                            and nonprecipitating areas. For example, for the event of 18 September 2006, genRE shows clearly two
                            maxima in the Vosges area, while HYRAS shows a more homogeneous field, due to the higher station

van OSNABRUGGE ET AL.              genRE: METHOD FOR NRT PRECIPITATION INTERPOLATION                                                         9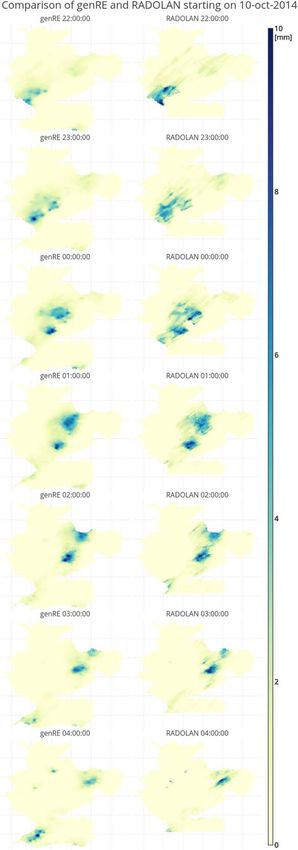
Water Resources Research                                                                             10.1002/2017WR021201

Figure 3. Spatial distribution of average yearly accumulations over the period 1997–2006 obtained with: (a) HYRAS reference climatology; (b) genRE approach
with HYRAS as background grid; (c) plain inverse-distance squared weighting; (d) EOBS reference climatology; and (e) genRE approach with EOBS as background
grid. (f) The state of the gauge network for a representative year (year 2000).

Figure 4. Differences (%) between methods in terms of average yearly climatology projected on the high-resolution (1.2 3 1.2 km) model grid. (a) genRE
(with HYRAS)—HYRAS; (b) IDW—HYRAS; (c) EOBS—HYRAS.

van OSNABRUGGE ET AL.                          genRE: METHOD FOR NRT PRECIPITATION INTERPOLATION                                                          10
Water Resources Research 10.1002/2017WR021201
Figure 5. Average monthly precipitation accumulations for major Rhine subbasins for genRE, HYRAS, and EOBS.
density underlying the latter. Likewise, for the event of 7 July 1999, HYRAS distinguishes between two local
peaks in the northern part, whereas genRE merges these peaks into one general area of intense rainfall.
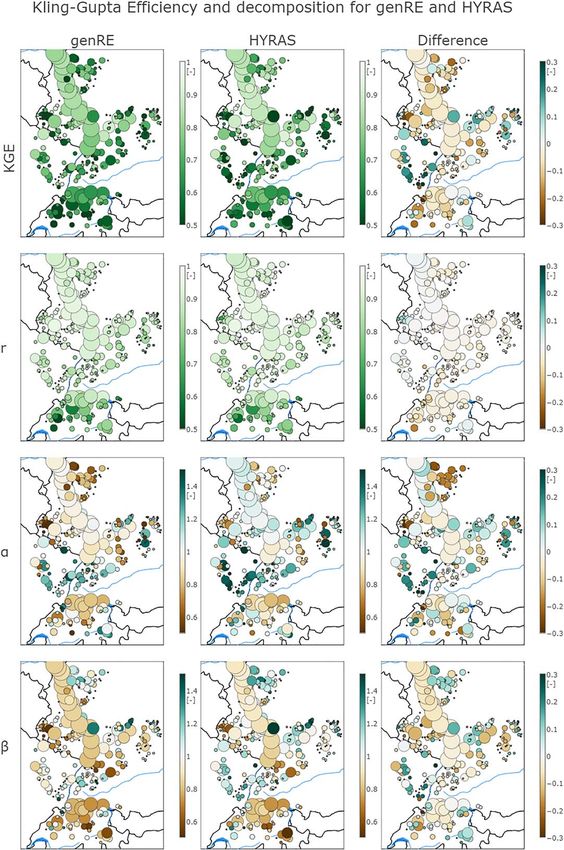
The differences between genRE and HYRAS are quantified for three events in Figure 7: two of the six
extreme events from Figure 6, and one randomly chosen less extreme precipitation event (5 October 2002).
Evaluating on a pixel by pixel basis yields a high coefficient of determination (q2) and a low coefficient of
variation (CV) of the residuals for the two extreme events. For less extreme events, the coefficient of deter-
mination decreases and the coefficient of variation increases.
Large deviations from the 1:1 line can be traced back to inclusion or exclusion of individual gauges. For
example, locations where HYRAS includes gauge locations with high-intensity rainfall which are not avail-
able on an hourly basis and thus not included in genRE lead to horizontal stripes in the upper left-hand part
of the scatter density plots. The horizontal stripes are caused by the resolution difference; genRE produces
25 values for each HYRAS value.
In a similar manner, genRE incorporates a smoothing effect, which causes the precipitation to extend over a
larger area. In the scatter density plot for the event of 5 October 2002 (Figure 7), we see most of the devia-
tion from the 1:1 line in the lower right-hand part of the figure, which means that there are areas which
yield a relatively high precipitation value in genRE, but not in HYRAS. This smoothing behavior is a trait of
inverse-distance squared weighting. The difference in smoothing can be attributed to the number of sta-
tions on one hand, and the fact that we use more stations for each weighting in genRE (eight closest sta-
tions) than in HYRAS (four closest stations) on the other, which we did because of the limited station
density of our base data.
So far, genRE has been compared to the existing HYRAS and EOBS climatological data sets. However, genRE
has been designed to provide hourly precipitation fields for supporting operational forecasting in the Rhine
basin. To evaluate these fields, genRE fields were qualitatively compared with RADOLAN raingauge cor-
rected weather radar-based imagery.
Figure 8 shows the temporal evolution of a precipitation field passing over the Rhine basin in 2014. The
location and timing of genRE and RADOLAN precipitation coincide. The precipitative areas in genRE do not
extend over a larger area than in RADOLAN. This suggests that the station density underlying genRE has
reached a point where it is sufficient (in relation to the areal scale of the Rhine basin) to capture the most
relevant details of areal precipitation as shown by the RADOLAN merged gauge-radar product.
5.2. Influence of Station Density on genRE and Variability of the Background Grid
To estimate the influence of the station density on the genRE method, the spatial patterns were compared
for two time periods of interpolation: 1997–2006 (Figure 3) and 2006–2014 (Figure 9). During the latter
period, the station density is much higher as the number of available stations jump from 150 to 400 dur-
ing the years 2005–2006. As indicated by Figure 10, there is no change in spatial distribution of rainfall
between the two periods.
There is notably less difference between the spatial patterns found with the genRE approach and inverse-
distance squared weighting than in the previous period with lower station density (Figure 9). Some features,
van OSNABRUGGE ET AL. genRE: METHOD FOR NRT PRECIPITATION INTERPOLATION 11Water Resources Research 10.1002/2017WR021201
Figure 6. Daily accumulations of seven extreme precipitation events from genRE (left), HYRAS (middle) and their differ-
ence (right).
van OSNABRUGGE ET AL. genRE: METHOD FOR NRT PRECIPITATION INTERPOLATION 12Water Resources Research 10.1002/2017WR021201
Figure 7. Maps and scatter density plots of areal precipitation according to genRE and HYRAS for 3 days. The shown statistics are the basin average for genRE and
HYRAS (R and H), the coefficient of variation (CV), and the coefficient of determination (q2).
however, remain: the second precipitation maximum in the Vosges area (annotated with 1 in Figure 9b)
and two areas in the Alps (annotated 2 and 3).
To quantify this, the Pearson correlation coefficient was calculated between the grids calculated with plain
IDW and the genRE method (with HYRAS as background grid) for each year. The correlation between IDW
and genRE did indeed increase steadily with the number of stations included in the interpolation, from 0.85 with
110 stations to 0.96 with 480 stations between the years 1997 and 2015 (supporting information Figure S7).
The large variability of monthly precipitation amounts in the Rhine basin, as recorded in the reference cli-
matology, makes that the choice of years to calculate the background grid has significant impact on the
absolute values of the background grid. The maximum range, i.e., the difference between the minimum
and maximum value for one grid point over all 47 background grids, equaled 1.42 times the average
van OSNABRUGGE ET AL. genRE: METHOD FOR NRT PRECIPITATION INTERPOLATION 13Water Resources Research 10.1002/2017WR021201
background value. In general, the range was between 0.3 and 1 times
the average value (supporting information Figures S2–S6).
The genRE method, however, as shown in equation (1) (section 3.1), is
only affected by the local spatial gradients of precipitation in the
background grid and not by absolute background values. For each
monthly background grid from any 9 year average, the spatial pattern,
indicating where it is relatively wet and where it is relatively dry,
remained the same (Figure 10). However, there are differences in local
gradients leading to multipliers that have the same direction (amplify-
ing or dampening) for each possible background grid but different
magnitudes.
5.3. Resulting Effects on Discharge Simulations
The choice of forcing data set has distinct implications on model per-
formance as expressed by the KGE and its decomposition in correla-
tion (r), bias of the variance (a), and bias of the mean (b) (Figure 11).
Notably, HYRAS scores better for Switzerland, while genRE leads to
unexpected improvements in the Moselle. These are the same areas
as those where genRE and HYRAS showed the strongest systematic
differences in yearly precipitation amounts. The difference between
HYRAS and genRE KGE scores for the downstream reaches of the
Rhine are small (dKGE 0.05).
Looking at the KGE decomposition, there is little difference in correla-
tion score. Larger differences are found in the relative variability (a)
and relative bias (b). In the main reach of the Rhine, the variability of
flows is slightly underestimated by genRE and slightly overestimated
with HYRAS leading to mixed results in the difference column. Vari-
ability is too low in Switzerland and too high in the Moselle area, for
both forcing data sets (Figure 11, a).
There is a negative bias in mean discharge for both forcing data sets
for the Rhine River and Switzerland, but this negative bias is smaller
for HYRAS than for genRE. Streamflow mean is also negatively biased
in Luxembourg for both forcing data sets. HYRAS leads to overestima-
tion of mean streamflow in the Moselle area and the Lower Rhine
basin (Figure 11, b).
The ambiguity of the calculated difference scores (right column, Fig-
ure 11) is exemplified by the four hydrographs shown in Figure 12.
For the same basin and in a short time period, both data sets can
result in under and overshoot of modeled discharge peaks, with little
to distinguish between the two. Note that these stations were not
used for model calibration.
6. Discussion
6.1. Discussion of Experimental Setup and Results
Table 1 gave an overview of some important properties of the HYRAS
and EOBS data set in comparison with the data set created with the
genRE approach. As can be seen, the reference data sets differed in
temporal and spatial resolution. Therefore, a choice had to be made
Figure 8. The passing of a precipitation event on 10–11 October 2014 as on which resolution the comparisons were made.
detected by (left) genRE and (right) RADOLAN.
A choice often made is to aggregate the higher-resolution product to
the lower resolution product (Rios Gaona et al., 2015, 2017). Chen and
van OSNABRUGGE ET AL. genRE: METHOD FOR NRT PRECIPITATION INTERPOLATION 14Water Resources Research 10.1002/2017WR021201
Figure 9. Spatial distribution of average yearly accumulations over the period 2006–2014 obtained with: (a) genRE
approach with HYRAS as background grid; (b) plain inverse-distance squared weighting; and (c) genRE approach with
EOBS as background. (d) The current state of the gauge network.
Knutson (2008) in particular argue that comparing precipitation data sets at different resolutions is unfair.
Aggregating to the native resolutions of the reference data sets would have meant, however, that any dif-
ference due to the higher resolution of genRE would be ignored, especially in regions with strong topogra-
phy. We focused here on the application of the high-resolution product in a similar high-resolution model,
and thus evaluated the performance of the gridded rainfall products on the hydrological model grid. As a
result of this approach, we noted that the EOBS spatial resolution is too coarse for high-resolution hydrolog-
ical modeling, with very large local differences which exceeded the differences between genRE and HYRAS.
Concerning the yearly precipitation differences between genRE and HYRAS, two methodological factors
which could contribute to the large biases in the affected areas were investigated, but not presented in the
results, the choice of using the eight instead of the four closest stations for inverse-distance interpolation
and the inclusion of a large number of stations just outside the Rhine basin domain which were not
included in the HYRAS interpolation. Applying these changes led to even larger negative biases in Luxem-
bourg and to insignificant change elsewhere. The lack of evidence that methodological differences are the
cause of the found biases combined with the fact that the largest negative bias is during winter hint that
the biases might be partially snow related as snow measurements are very sensitive to the equipment used
(Rasmussen et al., 2012). More generally, malfunctioning gauges can lead to underestimation of precipita-
tion means as malfunctioning gauges mostly report less rainfall, adding to the need for automated quality
control (Steiner et al., 1999).
Routing the genRE and HYRAS precipitation fields through a gridded hydrological model showed some
complex interaction between forcing and model bias. Even though we assumed that the HYRAS reference
van OSNABRUGGE ET AL. genRE: METHOD FOR NRT PRECIPITATION INTERPOLATION 15Water Resources Research 10.1002/2017WR021201
Figure 10. Twelve out of forty-seven background grids for January calculated from the HYRAS climatological data set.
precipitation climatology is more reliable than our genRE product, the hydrological model is less biased and
scored higher KGE scores for the Moselle area. Overall, the wflow_hbv model, here derived without recali-
bration from the HBV-148 model, can be improved upon.
6.2. Outlook
There are multiple deterministic and (geo)statistical methods to choose from for interpolating precipitation
gauge data. After an extensive literature review Ly et al. (2013) concluded that geostatistical methods seem
preferable for the interpolation of monthly and annual rainfall, but that for daily rainfall geostatistical meth-
ods and IDW provide comparable results. This conclusion supports the rationale behind the genRE method,
namely to derive the spatial relationships between grid cells on the monthly time scale and use IDW for the
hourly interpolation. It is also the approach used in the method behind EOBS.
The novelty of the genRE method is not the interpolation method itself, but the use of existing climatologi-
cal grids as secondary variable to guide the interpolation, thereby extending those climatological grids in
real-time without the need for additional data. In that respect, there are multiple ways to build upon both
the idea of combining monthly climatologies with daily or hourly anomalies, and the idea of extracting geo-
statistical information from climatological data sets. For example, the climatological grids could be used to
derive the parameters for geostatistical methods, or the background climatology could be used directly as a
secondary variable in, for example, Kriging with External Drift (KED). Still, the simplicity of the genRE
approach is favorable for operational circumstances. For example, the European Flood Awareness System
(EFAS) chose IDW over geostatistical methods to maintain their operational gridded precipitation product
for robustness (Ntegeka et al., 2013).
There are also several ways to further improve the data set we created with the genRE method. First, there is no
substitute for more, and more accurate, measurements, including automated verification. The latter is difficult as
a distinction needs to be made between real outliers (extreme events) and errors. Here static thresholds were
used, but there are methods in development for more dynamic automated verification (Blenkinsop et al., 2017).
A legitimate concern is the validity of the background grids under changing atmospheric circulation pat-
terns. For western Europe, both measurement and model-based studies have shown evidence of changing
circulation patterns (Bardossy & Caspary, 1990) and precipitation amounts (e.g., Frei et al., 2006). For the
van OSNABRUGGE ET AL. genRE: METHOD FOR NRT PRECIPITATION INTERPOLATION 16Water Resources Research 10.1002/2017WR021201
Figure 11. Kling-Gupta Efficiency (KGE) scores and their decomposition (r: correlation coefficient, a: measure of relative
variability, b: measure of relative bias) for 346 discharge gauging stations for two interpolated precipitation forcings
(genRE and HYRAS) and their difference. In the difference column, positive values indicate more optimal scores for genRE
over HYRAS and negative scores the opposite.
van OSNABRUGGE ET AL. genRE: METHOD FOR NRT PRECIPITATION INTERPOLATION 17Water Resources Research 10.1002/2017WR021201
Figure 12. Four exemplary hydrographs of measured (black dots) and modeled streamflow in the Rhine basin for two dif-
ferent forcings (genRE: orange, HYRAS: green). The locations (a–d) are notated in Figure 1.
Rhine basin in particular, different magnitudes of change of seasonal average precipitation were found for
topographical features in the basin, most notably for the Rhine valley (Hurkmans et al., 2009, Figure 6; Pho-
tiadou et al., 2016). As HYRAS is meant to be updated in the near future, it would be wise to calculate new
background fields when these become available.
The variability in the background grid derived from different subsets of the original data could be used to
construct ensembles, although this would probably count as ‘‘adding uncertainty in an ad hoc manner’’ as
criticized in Newman et al. (2017). In this respect, it should be noted that the whole genRE method is an ‘‘ad
hoc’’ method and is not meant to replace established methods to create climatological data sets, but rather
to fill the gap between those relatively static exercises and the more dynamic reality found in transboun-
dary operational hydrological forecasting.
Table 1
Properties of the Reference Data Sets as Compared to genRE
genRE HYRAS EOBS RADOLAN
Time step Hour Day Day 15 min
Grid size 1.2 3 1.2 km 5 3 5 km 0.258 1 3 1 km
Period 1996–current 1951–2006 1950–current 2005–current
Domain Rhine basin KLIWAS Europe Germany
Updates Near real-time Sporadic Monthly Near real-time
Reference This paper Rauthe et al. (2013) Haylock et al. (2008) Bartels et al. (2004)
van OSNABRUGGE ET AL. genRE: METHOD FOR NRT PRECIPITATION INTERPOLATION 18Water Resources Research 10.1002/2017WR021201
Finally, the usefulness of the proposed method could be further demonstrated by applying the method in
other (transboundary) river basins and with other climatological gridded data sets. For the Rhine basin, pro-
gress is underway to deliver interpolated products for temperature and potential evaporation in the same
spatial and temporal resolution.
7. Conclusions
In this paper, a method to extend high-quality gridded precipitation climatology data sets in near real-time
for hydrological forecasting purposes was described. It is called generalized REGNIE (genRE), linking its ori-
gins to the original REGNIE method used in creating the HYRAS climatology data set (Rauthe et al., 2013).
The aims of this paper were: (1) to investigate if the genRE method can indeed be used to mimic and
extend climatological precipitation data sets in near real-time using (sparse) real-time measurements; (2)
create a high-resolution (near real-time) gridded precipitation data set for the purpose of high-resolution
hydrological modeling of streamflow and (re)forecasts in the Rhine basin; and (3) evaluate the precipitation
interpolation procedure used, in a hydrological sense.
The genRE method yields interpolated fields that closely match the reference climatology used in the
method on the yearly, monthly, daily, and hourly time scale. The method has the largest added value when
employed with sparse gauge networks, which suits the purpose of the method. The variation in the back-
ground grid for HYRAS was estimated to be of the same order of magnitude as the relative differences
found between the genRE method and the HYRAS climatology. This shows the dependence of the genRE
Acknowledgments method on the selected reference climatology and the associated natural variability.
This work is partly supported by the
IMPREX project funded by the Our work resulted in a gridded 1.2 3 1.2 km resolution hourly precipitation data set for the period 1996–2016,
European Commission under the to be updated in real-time, covering the entire Rhine basin. The data set is unique in spatial and temporal res-
Horizon 2020 framework program
(grant 641811) and partly by the Dutch olution compared to climatological data sets such as HYRAS and EOBS. Furthermore, it uses a simple interpola-
Ministry of Infrastructure and the tion method and can be updated in real-time. This precipitation data set successfully mimics HYRAS in terms
Environment. Meteorological data for
of matching spatial patterns, showing a low yearly bias and a high correlation coefficient for daily accumula-
this research have been gratefully
received from the Deutscher tions. Differences in simulated discharges using HYRAS and genRE as expressed in KGE scores are overall rela-
Wetterdienst Climate Data Center; tively small, but can be significant for individual peak flow simulations.
KNMI Data Centrum; Meteo France;
Federal Office of Meteorology and
Climatology MeteoSwiss;
Administration de la gestion de l’eau
References
du Grand-Duche de Luxembourg; and Andr eassian, V., Perrin, C., Michel, C., Usart-Sanchez, I., & Lavabre, J. (2001). Impact of imperfect rainfall knowledge on the efficiency and
Service Publique de Wallonie the parameters of watershed models. Journal of Hydrology, 250(1–4), 206–223. https://doi.org/10.1016/S0022-1694(01)00437-1
Departement des Etudes et de l’Appui Bardossy, A., & Caspary, J. (1990). Theoretical and applied climatology detection of climate change in Europe by analyzing European atmo-
a la Gestion. Discharge data have been spheric circulation patterns from 1881 to 1989. Theoretical and Applied Climatology, 42, 155–167. https://link-springer-com.ezproxy.
gratefully received from SCHAPI library.wur.nl/content/pdf/10.1007%2FBF00866871.pdf
(Service Central d’Hydromet eorologie Bartels, H., Weigl, E., Reich, T., Lang, P., Wagner, A., Kohler, O., & Gerlach, N. (2004). Projekt RADOLAN—Routineverfahren Zur Online-
et d’Appui a la Prevision des Aneichung Der Radarniederschlagsdaten Mit Hilfe von Automatischen Bodenniederschlagsstationen (Ombrometer) (Final report). Offenbach
Inondations) through ‘‘Banque am Main, Germany: Deutscher Wetterdienst, Abteilung Hydrometeorologie.
HYDRO’’; Bundesamt f€ ur Umwelt BAFU; Beven, K., & Binley, A. (1992). The future of distributed models: Model calibration and uncertainty prediction. Hydrological Processes, 6, 279–
Bundesanstalt f€ ur Gew€asserkunde 298. https://doi.org/10.1002/hyp.3360060305
(BfG); Administration de la gestion de Bierkens, M. F. P., Bell, V. A., Burek, P., Chaney, N., Condon, L. E., David, C. H., . . . Wood, E. F. (2015). Hyper-resolution global hydrological
l’eau du Grand-Duche de Luxembourg; modelling: What is next? Hydrological Processes, 29(2), 310–320. https://doi.org/10.1002/hyp.10391
Bavarian Environment Agency, www. Blenkinsop, S., Lewis, E., Chan, S. C., & Fowler, H. J. (2017). Quality-control of an hourly rainfall dataset and climatology of extremes for the
lfu.bayern.de; Landesanstalt f€ ur UK. International Journal of Climatology, 37(2), 722–740. https://doi.org/10.1002/joc.4735
Umwelt, Messungen und Naturschutz Chen, C.-T., & Knutson, T. (2008). On the verification and comparison of extreme rainfall indices from climate models. Journal of Climate, 21,
Baden-W€ urttemberg, LUBW; 1605–1621. https://doi.org/10.1175/2007JCLI1494.1
Landesamtes f€ ur Umwelt, European Climate Assessment & Dataset. (2017). EOBS precipitation station meta data. Retrieved from http://www.ecad.eu/download/
Wasserwirtschaft und Gewerbeaufsicht ensembles/download.php#station
Rheinland-Pfalz; Landesamt f€ ur Euser, T., Hrachowitz, M., Winsemius, H. C., & Savenije, H. H. G. (2015). The effect of forcing and landscape distribution on performance and
Umwelt- und Arbeitsschutz Saarland; consistency of model structures. Hydrological Processes, 3743(April), 3727–3743. https://doi.org/10.1002/hyp.10445
and Landesamt f€ ur Natur, Umwelt und Ficchı, A., Perrin, C., & Andr
eassian, V. (2016). Impact of temporal resolution of inputs on hydrological model performance: An analysis
Verbraucherschutz Nordrhein- based on 2400 flood events. Journal of Hydrology, 538(July), 454–470. https://doi.org/10.1016/j.jhydrol.2016.04.016
Westfalen. The Rhine precipitation Frei, C., Sch€oll, R., Fukutome, S., Schmidli, J., & Vidale, P. L. (2006). Future change of precipitation extremes in Europe: Intercomparison of
data set created with genRE in this scenarios from regional climate models. Journal of Geophysical Research, 111, D06105. https://doi.org/10.1029/2005JD005965
study is available for download Gupta, H. V., Kling, H., Yilmaz, K. K., & Martinez, G. F. (2009). Decomposition of the mean squared error and NSE performance criteria: Impli-
through the 4TU centre for research cations for improving hydrological modelling. Journal of Hydrology, 377(1–2), 80–91. https://doi.org/10.1016/j.jhydrol.2009.08.003
data with https://doi.org/10.4121/ Haylock, M. R., Hofstra, N., Klein Tank, A. M. G., Klok, E. J., Jones, P. D., & New, M. (2008). A European daily high-resolution gridded data set of
uuid:c875b385-ef6d-45a5-a6d3- surface temperature and precipitation for 1950–2006. Journal of Geophysical Research, 113, D20119. https://doi.org/10.1029/2008JD010201
d5fe5e3f525d (Van Osnabrugge et al., Hurkmans, R., Terink, W., Uijlenhoet, R., Torfs, P., Jacob, D., & Troch, P. A. (2009). Changes in streamflow dynamics in the Rhine basin under
2017). three high-resolution regional climate scenarios. Journal of Climate, 23, 679–699. https://doi.org/10.1175/2009JCLI3066.1
van OSNABRUGGE ET AL. genRE: METHOD FOR NRT PRECIPITATION INTERPOLATION 19You can also read