Rapid loss of immunity is necessary to explain historical cholera epidemics - Ed Ionides & Aaron King
←
→
Page content transcription
If your browser does not render page correctly, please read the page content below

Rapid loss of immunity is necessary to
 explain historical cholera epidemics

               Ed Ionides & Aaron King

                    University of Michigan
  Departments of Statistics and Ecology & Evolutionary Biology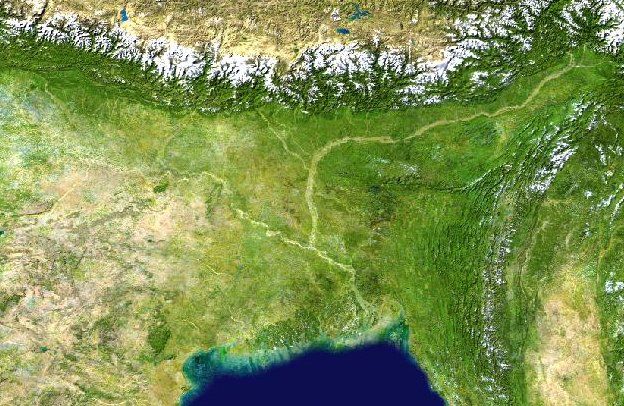
Bengal: cholera’s homeland

Bengal: cholera’s homeland

Bengal: cholera’s homeland

Bengal: cholera’s homeland
Bengal: cholera’s homeland
Cholera: unsolved puzzles
    I   Mode of transmission
          I   contaminated water: environmental reservoir
          I   food-borne/direct fecal-oral
          I   transient hyperinfectious state (
Cholera: unsolved puzzles
I Mode of transmission
I contaminated water: environmental reservoir
I food-borne/direct fecal-oral
I transient hyperinfectious state (yr
Dacca cholera mortality
0 1000 3000 5000
J
F
M
A
M
Cholera: unsolved puzzles
J
J
A
S
O
N
DCholera: unsolved puzzles
I Mode of transmission
I contaminated water: environmental reservoir
I food-borne/direct fecal-oral
I transient hyperinfectious state (Cholera: unsolved puzzles
I Mode of transmission
I contaminated water: environmental reservoir
I food-borne/direct fecal-oral
I transient hyperinfectious state (Cholera: unsolved puzzles
I Mode of transmission
I contaminated water: environmental reservoir
I food-borne/direct fecal-oral
I transient hyperinfectious state ( 3 yr immunity following severe infection
I community study of reinfections in Matlab, Bangladesh:
I risk of reinfection equal to risk of primary infection
I 1.6 yr average duration between primary infection and
reinfection
I retrospective statistical analyses (Koelle & Pascual 2004):
7–10 yr immunity following severe infectionInapparent infections
I most cholera infections are mild or asymptomaticInapparent infections
I most cholera infections are mild or asymptomatic
I reports of the asymptomatic:symptomatic ratio range from
3 to 100Inapparent infections
I most cholera infections are mild or asymptomatic
I reports of the asymptomatic:symptomatic ratio range from
3 to 100
I it is easy to underestimate the degree to which one
underestimates a quantity one cannot observeInapparent infections
I most cholera infections are mild or asymptomatic
I reports of the asymptomatic:symptomatic ratio range from
3 to 100
I it is easy to underestimate the degree to which one
underestimates a quantity one cannot observe
I Needed: an approach that allows indirect inference about
unobserved variablesInapparent infections
I most cholera infections are mild or asymptomatic
I reports of the asymptomatic:symptomatic ratio range from
3 to 100
I it is easy to underestimate the degree to which one
underestimates a quantity one cannot observe
I Needed: an approach that allows indirect inference about
unobserved variables
I historical cholera mortality records are a rich source of
information, but have been difficult to fully exploitHistorical cholera mortality
Jaipaguri
Rangpur
Dinajpur
Malda
Bogra
Mymensingh
Rashahi
Pabna
Mohrshidabad
Birbhum Dacca
Nadia
Burdwan Faridpur Tippera
Jessore
Bankura
Noakhali
Hooghly
HowrathCalcutta
Khulna Bakergang
Midnapur
24 Parganas
ChittagongHistorical cholera mortality
Jaipaguri
Rangpur
Dinajpur
Malda
Bogra
Mymensingh
Rashahi
Pabna
Mohrshidabad
Birbhum Dacca
Nadia
Burdwan Faridpur Tippera
Jessore
Bankura
Noakhali
Hooghly
HowrathCalcutta
Khulna Bakergang
Midnapur
24 Parganas
ChittagongHistorical cholera mortality
Dacca
5000
4000
cholera mortality
3000
x[[dist]]
2000
1000
0
1890 1900 1910 1920 1930 1940
year
x$timeHistorical cholera mortality
Jaipaguri
Rangpur
Dinajpur
Malda
Bogra
Mymensingh
Rashahi
Pabna
Mohrshidabad
Birbhum Dacca
Nadia
Burdwan Faridpur Tippera
Jessore
Bankura
Noakhali
Hooghly
HowrathCalcutta
Khulna Bakergang
Midnapur
24 Parganas
ChittagongHistorical cholera mortality
Midnapur
3000
2000
cholera mortality
x[[dist]]
1000
0
1890 1900 1910 1920 1930 1940
year
x$timeHistorical cholera mortality
Jaipaguri
Rangpur
Dinajpur
Malda
Bogra
Mymensingh
Rashahi
Pabna
Mohrshidabad
Birbhum Dacca
Nadia
Burdwan Faridpur Tippera
Jessore
Bankura
Noakhali
Hooghly
HowrathCalcutta
Khulna Bakergang
Midnapur
24 Parganas
ChittagongHistorical cholera mortality
Jaipaguri
3000
2000
cholera mortality
x[[dist]]
1000
0
1890 1900 1910 1920 1930 1940
year
x$timeHistorical cholera mortality
Jaipaguri
Rangpur
Dinajpur
Malda
Bogra
Mymensingh
Rashahi
Pabna
Mohrshidabad
Birbhum Dacca
Nadia
Burdwan Faridpur Tippera
Jessore
Bankura
Noakhali
Hooghly
HowrathCalcutta
Khulna Bakergang
Midnapur
24 Parganas
ChittagongHistorical cholera mortality
Bakergang
5000
4000
3000
cholera mortality
x[[dist]]
2000 1000
0
1890 1900 1910 1920 1930 1940
year
x$timeSIRS model
m-
M
b λ(t) - γ k ε- ... kε- R
P -
S I - R1 k
6
kε
parameter symbol
force of infection λ(t)
recovery rate γ
disease death rate m
mean long-term immune period 1/ε√
CV of long-term immune period 1/ kSIRS model
m-
M
b λ(t) - γ k ε- ... kε- R
P -
S I - R1 k
6
kε
parameter symbol
force of infection λ(t)
recovery rate γ
disease death rate m
mean long-term immune period 1/ε√
CV of long-term immune period 1/ kSIRS model
m-
M
b λ(t) - γ kε- ... kε- R
P -
S I - R1 k
6
kε
parameter symbol
force of infection λ(t)
recovery rate γ
disease death rate m
mean long-term immune period 1/ε√
CV of long-term immune period 1/ kSIRS model
m-
M
b λ(t) - γ kε- ... kε- R
P -
S I - R1 k
6
kε
parameter symbol
force of infection λ(t)
recovery rate γ
disease death rate m
mean long-term immune period 1/ε√
CV of long-term immune period 1/ kSIRS model
m-
M
b λ(t) - γ k ε- ... kε- R
P -
S I - R1 k
6
kε
parameter symbol
force of infection λ(t)
recovery rate γ
disease death rate m
mean long-term immune period 1/ε√
CV of long-term immune period 1/ kSIRS model
m-
M
b λ(t) - γ k ε- ... kε- R
P -
S I - R1 k
6
kε
I(t)
λ(t) = eβtrend t βseas (t) + ξ(t) +ω
P(t)SIRS model
m-
M
b λ(t) - γ k ε- ... kε- R
P -
S I - R1 k
6
kε
I(t)
λ(t) = eβtrend t βseas (t) + ξ(t) +ω
P(t)
βtrend = trend in transmissionSIRS model
m-
M
b λ(t) - γ k ε- ... kε- R
P -
S I - R1 k
6
kε
I(t)
λ(t) = eβtrend t βseas (t) + ξ(t) +ω
P(t)
βseas (t) = seasonality in transmission
semimechanistic approach: use flexible functionSIRS model
m-
M
b λ(t) - γ k ε- ... kε- R
P -
S I - R1 k
6
kε
I(t)
λ(t) = eβtrend t βseas (t) + ξ(t) +ω
P(t)
ξ(t) = environmental stochasticitySIRS model
m-
M
b λ(t) - γ k ε- ... kε- R
P -
S I - R1 k
6
kε
I(t)
λ(t) = eβtrend t βseas (t) + ξ(t) +ω
P(t)
ω = environmental reservoirSIRS model
m-
M
b λ(t) - γ k ε- ... kε- R
P -
S I - R1 k
6
kε
I(t)
λ(t) = eβtrend t βseas (t) + ξ(t) +ω
P(t)
P(t) = censused population sizeSIRS model
dS dP(t)
= + δ P(t) − (λ(t) + k Rk + δ) S
dt dt
dI
= λ(t) S − (m + γ + δ) I(t)
dt
dR1
= γ I − (k + δ) R1
dt
..
.
dRk
= k Rk −1 − (k + δ) Rk
dt
Stochastic force of infection:
I(t)
λ(t) = eβtrend t βseas (t) + ξ(t) +ω
P(t)Likelihood maximization by iterated filtering
I new frequentist approach
(Ionides, Bretó, & King, PNAS 2006)
I can accommodate:
I continuous-time models
I nonlinearity
I stochasticity
I unobserved variables
I measurement error
I nonstationarity
I covariates
I based on well-studied sequential Monte Carlo methods
(particle filter)
I “plug and play” property
I Implemented in pomp, an open-source R package
(www.r-project.org)Duration of immunity
●●●●●●●●
●●●● ●●●●
●●●●● ●●
−3800
profile log likelihood
●
●
●
●
●●
loglik
●●
−3820
●
●●●
●●●
●● ●
●
●●
−3840
●●
●
0.01 0.05 0.10 0.50 1.00 5.00 ●
immune period (yr)SIRS model
m-
M
b λ(t) - γ k ε- ... kε- R
P -
S I - R1 k
6
kε
parameter symbol
force of infection λ(t)
recovery rate γ
disease death rate m
mean long-term immune period 1/ε√
CV of long-term immune period 1/ kSIRS model predictions
I estimated cholera fatality (across districts):
0.0039 ± 0.0021.SIRS model predictions
I estimated cholera fatality (across districts):
0.0039 ± 0.0021.
I in the historical period, fatality in severe cases was c. 60%SIRS model predictions
I estimated cholera fatality (across districts):
0.0039 ± 0.0021.
I in the historical period, fatality in severe cases was c. 60%
I model prediction: lots of silent sheddersSIRS model predictions
I estimated cholera fatality (across districts):
0.0039 ± 0.0021.
I in the historical period, fatality in severe cases was c. 60%
I model prediction: lots of silent shedders
I evidence for silent shedders is mixed and weakSIRS model predictions
I estimated cholera fatality (across districts):
0.0039 ± 0.0021.
I in the historical period, fatality in severe cases was c. 60%
I model prediction: lots of silent shedders
I evidence for silent shedders is mixed and weak
I Q: is it necessary that all exposed individuals become
infectious?Two-path model
m-
M
cλ(t) γ kε- ... k ε- R
-
I - R1 k
b kε
P -
S
ρ
(1 − c)λ(t) -
Y
parameter symbol
force of infection λ(t)
probability of severe infection c
recovery rate γ
disease death rate m
mean long-term immune period 1/ε√
CV of long-term immune period 1/ k
mean short-term immune period 1/ρTwo-path model
m-
M
cλ(t) γ kε- ... k ε- R
-
I - R1 k
b kε
P -
S
ρ
(1 − c)λ(t) -
Y
parameter symbol
force of infection λ(t)
probability of severe infection c
recovery rate γ
disease death rate m
mean long-term immune period 1/ε√
CV of long-term immune period 1/ k
mean short-term immune period 1/ρTwo-path model
m-
M
cλ(t) γ kε- ... k ε- R
-
I - R1 k
b kε
P -
S
ρ
(1 − c)λ(t) -
Y
parameter symbol
force of infection λ(t)
probability of severe infection c
recovery rate γ
disease death rate m
mean long-term immune period 1/ε√
CV of long-term immune period 1/ k
mean short-term immune period 1/ρTwo-path model
dS dP(t)
= k Rk + ρ Y + + δ P(t) − (λ(t) + δ) S
dt dt
dI
= c λ(t) S − (m + γ + δ) I(t)
dt
dY
= (1 − c) λ(t) S − (ρ + δ) Y
dt
dR1
= γ I − (k + δ) R1
dt
..
.
dRk
= k Rk −1 − (k + δ) Rk
dt
Stochastic force of infection:
I(t)
λ(t) = eβtrend t βseas (t) + ξ(t) +ω
P(t)Model comparison model log likelihood AIC two-path -3775.8 7591.6 SIRS -3794.3 7622.6 SARMA((2,2)×(1,1)) -3804.5 7625.0 Koelle & Pascual (2004) -3840.1 — seasonal mean -3989.1 8026.1
Goodness of fit

          district       r2    district         r2
          Bakergang    0.856   Jessore        0.754
          Bankura      0.559   Khulna         0.735
          Birbhum      0.509   Malda          0.596
          Bogra        0.570   Midnapur       0.666
          Burdwan      0.589   Mohrshidabad   0.631
          Calcutta     0.756   Mymensingh     0.805
          Chittagong   0.712   Nadia          0.734
          Dacca        0.848   Noakhali       0.701
          Dinajpur     0.078   Pabna          0.690
          Faridpur     0.785   Rangpur        0.594
          Hooghly      0.569   Rashahi        0.690
          Howrath      0.769   Tippera        0.767
          Jaipaguri    0.109   24 Parganas    0.839
Goodness of fit
r2Simulated vs. actual data
5000 Dacca actual Faridpur actual
c(0, 5500)
c(0, 5500)
actual
2500 0
5000
c(1891,
Dacca1941)
simulated Faridpur
c(1891, simulated
1941)
simulated
c(0, 5500)
c(0, 5500)
2500 0
1891 1901 1911 1921 1931 1941 1891 1901 1911 1921 1931 1941
c(1891, 1941) c(1891, 1941)
SIRS modelSimulated vs. actual data
5000 Dacca actual Faridpur actual
c(0, 5500)
c(0, 5500)
actual
2500 0
5000
c(1891,
Dacca1941)
simulated c(1891, 1941)
Faridpur simulated
simulated
c(0, 5500)
c(0, 5500)
2500 0
1891 1901 1911 1921 1931 1941 1891 1901 1911 1921 1931 1941
c(1891, 1941) c(1891, 1941)
two-path modelParameter estimates
I cholera fatality: 0.07 ± 0.05Parameter estimates
I cholera fatality: 0.07 ± 0.05
I probability of severe infection: ĉ = 0.008 ± 0.005Parameter estimates
I cholera fatality: 0.07 ± 0.05
I probability of severe infection: ĉ = 0.008 ± 0.005
I Rˆ0 = 1.10 ± 0.27c(0, max(seas))
R0(t)
0.0 2.5 5.0 7.5 10.0
J
F
Parameter estimates
M
A
M
J
J
A
S
O
N
D
JParameter estimates
I cholera fatality: 0.07 ± 0.05
I probability of severe infection: ĉ = 0.008 ± 0.005
I Rˆ0 = 1.10 ± 0.27Parameter estimates
I cholera fatality: 0.07 ± 0.05
I probability of severe infection: ĉ = 0.008 ± 0.005
I Rˆ0 = 1.10 ± 0.27
I duration of long-term immunity: 2.6 ± 1.8 yrParameter estimates
I cholera fatality: 0.07 ± 0.05
I probability of severe infection: ĉ = 0.008 ± 0.005
I Rˆ0 = 1.10 ± 0.27
I duration of long-term immunity: 2.6 ± 1.8 yr
I duration of short-term immunity: 0.3–8.3 wkParameter estimates
I cholera fatality: 0.07 ± 0.05
I probability of severe infection: ĉ = 0.008 ± 0.005
I Rˆ0 = 1.10 ± 0.27
I duration of long-term immunity: 2.6 ± 1.8 yr
I duration of short-term immunity: 0.3–8.3 wk
I geographical variability in force of infectionGeographical patterns
environmental reservoir
ωGeographical patterns
transmission, Jan–Feb
b0Geographical patterns
transmission, Mar–Apr
b1Geographical patterns
transmission, May–Jun
b2Geographical patterns
transmission, Jul–Aug
b3Geographical patterns
transmission, Sep–Oct
b4Geographical patterns
transmission, Nov–Dec
b5Contrasting views of endemic cholera dynamics
View of Koelle & Pascual (2004):
I long-term immunity (7–10 yr)
I modest asymptomatic ratio (c. 70:1)
I spatial heterogeneity slows epidemic
I seasonal drop in transmission stops epidemic
I waning of immunity interacts with climate drivers on
multi-year scaleContrasting views of endemic cholera dynamics
New view:
I rapidly waning immunity
I high asymptomatic ratio (>160:1)
I susceptible depletion slows and stops epidemic
I loss of immunity replenishes susceptibles rapidly
I waning of immunity interacts with climate drivers on
seasonal scale
I multi-year climate drivers?Public health implications
I What determines the switch probability c?Public health implications
I What determines the switch probability c?
I serological profile data suggest c declines with agePublic health implications McCormack et al. (1969)
Public health implications

    I   What determines the switch probability c?
I serological profile data suggest c declines with age
I dose/hyperinfectiousness
I foodborne/direct fecal-oral mode is most important
I lower doses provide short-term immunityPublic health implications
I What determines the switch probability c?
I serological profile data suggest c declines with age
I dose/hyperinfectiousness
I foodborne/direct fecal-oral mode is most important
I lower doses provide short-term immunity
I unintended consequences of neglect of household
transmission?Public health implications
I What determines the switch probability c?
I serological profile data suggest c declines with age
I dose/hyperinfectiousness
I foodborne/direct fecal-oral mode is most important
I lower doses provide short-term immunity
I unintended consequences of neglect of household
transmission?
I presence of vibriophage in environment?Alternative hypotheses?
I inhomogeneities
I behavioral effectsExtensions
I Recent data (1966–2005, Matlab, Bangladesh)
I Discrete population continuous time models
I Other diseases
I malaria
I measles
I influenzaSeasonality
R. G. Feachem (1982) on the seasonal patterns of cholera
epidemics in Bengal:
They are such a dominant feature of cholera
epidemiology, and in such contrast to the other
bacterial diarrhoeas which peak during the monsoon
in mid-summer, that their explanation probably holds
the key to fundamental insights into cholera
transmission, ecology, and control.Seasonality
R. G. Feachem (1982) on the seasonal patterns of cholera
epidemics in Bengal:
They are such a dominant feature of cholera
epidemiology, and in such contrast to the other
bacterial diarrhoeas which peak during the monsoon
in mid-summer, that their explanation probably holds
the key to fundamental insights into cholera
transmission, ecology, and control.
to understand seasonality, we must allow for the interaction of
short-term immunity with seasonal environmental driversThanks to . . .
I Mercedes Pascual
I Menno Bouma
I Carles Bretó
I Katia Koelle
I Diego Ruiz Moreno
I Andy Dobson
I the R project (www.r-project.org)
I NSF/NIH Ecology of Infectious DiseasesThank you!
You can also read