Recovery coupling in multilayer networks - Nature
←
→
Page content transcription
If your browser does not render page correctly, please read the page content below
ARTICLE
                  https://doi.org/10.1038/s41467-022-28379-5                OPEN

                  Recovery coupling in multilayer networks
                  Michael M. Danziger              1✉   & Albert-László Barabási1,2,3

                  The increased complexity of infrastructure systems has resulted in critical interdependencies
                  between multiple networks—communication systems require electricity, while the normal
                  functioning of the power grid relies on communication systems. These interdependencies
1234567890():,;

                  have inspired an extensive literature on coupled multilayer networks, assuming a hard
                  interdependence, where a component failure in one network causes failures in the other
                  network, resulting in a cascade of failures across multiple systems. While empirical evidence
                  of such hard failures is limited, the repair and recovery of a network requires resources
                  typically supplied by other networks, resulting in documented interdependencies induced by
                  the recovery process. In this work, we explore recovery coupling, capturing the dependence
                  of the recovery of one system on the instantaneous functional state of another system. If the
                  support networks are not functional, recovery will be slowed. Here we collected data on the
                  recovery time of millions of power grid failures, finding evidence of universal nonlinear
                  behavior in recovery following large perturbations. We develop a theoretical framework to
                  address recovery coupling, predicting quantitative signatures different from the multilayer
                  cascading failures. We then rely on controlled natural experiments to separate the role of
                  recovery coupling from other effects like resource limitations, offering direct evidence of how
                  recovery coupling affects a system’s functionality.

                  1 Network Science Institute, Northeastern University, Boston, MA, USA. 2 Division of Network Medicine, Department of Medicine, Harvard Medical School,

                  Boston, MA, USA. 3 Department of Network and Data Science, Central European University, Budapest, Hungary. ✉email: mmdanziger@gmail.com

                  NATURE COMMUNICATIONS | (2022)13:955 | https://doi.org/10.1038/s41467-022-28379-5 | www.nature.com/naturecommunications                             1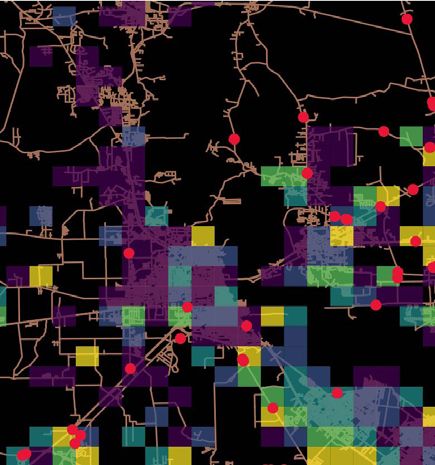
ARTICLE                                                                  NATURE COMMUNICATIONS | https://doi.org/10.1038/s41467-022-28379-5

A
        s critical infrastructure systems have increased in size and          support networks are not fully functional, the delivery of
        complexity, so has the interdependence between them-                  resources critical for recovery will be slowed or impaired (Fig. 1b).
        communication systems require electricity from the                    Indeed, while a blocked road or an internet outage in a given
power grid, whose functioning and maintaining relies, however,                location will not cause a power outage, it may delay the repair of
on communication systems. Both networks rely on the trans-                    power outages in the affected area. And because the damage may
portation system for repairs, and in turn, transportation needs               continue regardless of the system’s ability to recover, impaired
both electrical power and a functioning communication system.                 recovery could eventually lead to a system’s collapse. Such
These multiple interdependencies, and their consequences for                  recovery-based interdependencies were well documented in the
resilience, have inspired an extensive literature on coupled mul-             aftermath of Hurricane Sandy: at least 85 incidents of recovery
tilayer networks, crossing disciplinary boundaries1–10.                       interdependence were reported, including the dependency of the
   The common hypothesis behind the current multilayer net-                   power grid’s recovery on other networks17.
work modeling framework is one of hard interdependence, where
a node or link failure in one network causes node or link failures            Results
in another network, which in turn may induce additional failures              Here we show how recovery coupling affects a network’s func-
in the original network, resulting in a domino-like cascade of                tionality, finding that its signatures and dynamics are different
failures across multiple systems3 (Fig. 1a). Despite the many                 from the much-studied multilayer cascading failures, as well as
modeling insights it has offered, evidence of such hard cascading             from interdependent networks with coupling20–24. To empirically
failures remains limited in real systems. For example, while                  test the developed framework, we collected data on millions of
communications and some transit networks do depend directly                   power grid failures in the contiguous United States, finding evi-
on electricity, failures in these networks rarely cause electrical            dence of striking nonlinear behavior in recovery following large
failures8. Furthermore, while cascading failures in the electric grid         perturbations, consistent with the model predictions.
are well documented11–16, despite a decade-long body of litera-
ture on the subject, we continue to lack convincing empirical
evidence of these cascades, inducing cascades of failures in other            Network damage and recovery at constant rates. Consider two
infrastructure systems.                                                       infrastructure systems X and Y, each composed of N elements
   While direct evidence of hard coupling across multiple net-                (nodes). Each network is described by its adjacency matrix, Xij
works is limited, there are multiple accounts of interdependencies            and Yij, and we label the nodes geographically so that co-located
not considered by the current modeling frameworks, those                      nodes xi and yi, have the same index i. At any moment, each node
induced by the recovery process8,17–19. Indeed, the repair and the            can either be functional (xi = 1, yi = 1) or non-functional (xi = 0,
recovery of a network following a local or global failure requires            yi = 0). A non-functional node can cause secondary damage
resources typically supplied by other networks. For example,                  either by isolating its neighbors from the rest of the network, or
restoring failed power components requires that the repair crews              via cascading mechanisms16. Though a single node or link failure
have access to transportation (road networks) and coordination                can render other parts of the network nonfunctional, once the
through communications (cellular networks and internet). If the               initial failure is repaired, typically the secondary failures will also
                                                                              return to functionality25. For example, though a downed power

Fig. 1 Damage and recovery in interdependent networks. a Under the hard coupling model, when node x1 fails, it causes a cascade across both networks
that disables the entire system. b With recovery coupling on the same network, when node x1 fails it is repaired using resources from network Y delivered
through node y1. Failures in network Y will impair that repair process.

2                 NATURE COMMUNICATIONS | (2022)13:955 | https://doi.org/10.1038/s41467-022-28379-5 | www.nature.com/naturecommunications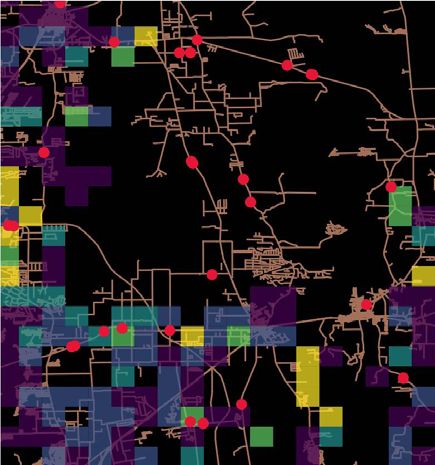
NATURE COMMUNICATIONS | https://doi.org/10.1038/s41467-022-28379-5 ARTICLE
line may cut off power to many homes, once the line is repaired, obtaining
the power will be restored to each home without needing the
individual repair of each component. γrX;i ðtÞ ¼ gðhyii ðtÞÞ ¼ gð1Þ g 0 ð1Þð1 hyii ðtÞÞ þ oðð1 hyii ðtÞÞ2 Þ;
Assuming a constant damage rate γdμ and a constant repair rate ð3Þ
γrμ , the fraction of primary failed nodes in each network fμ evolves
where g(x) is an unknown function that represents the functional
in time as dependence of the repair rate of system X on the state of network
Y around site i, which we assess with the network average
f_μ ¼ γdμ ð1 f μ Þ γrμ f μ ; ð1Þ
1
hyii ðtÞ ¼ ∑ Y y ðtÞ; ð4Þ
reaching the equilibrium damage fraction k þ 1 i ij j
to capture the fact that repair resources are drawn from the
1
hf μ i ¼ : ð2Þ neighborhood of the failure and are affected by the networks
1 þ γrμ =γdμ which supply them. Thus ⟨y⟩i may represent the dynamically
evolving accessibility, or availability of electricity. In (4), the
The damage rate γdμ is largely exogenous and determined by variable ⟨y⟩i(t) captures the temporally evolving local state of
weather, accidents, or component failures. The repair rate γrμ , in network Y, which may itself co-evolve with the state of the nodes
contrast, is determined by the resources available for repair, such in network X if dependencies exist between the two systems.
as crew and supplies. Denoting with γXr;0 ¼ gð1Þ the elastic repair rate and with
Equations (1)–(2) predict a linear relationship between the α ¼ g 0 ð1Þ=gð1Þ, we obtain
number of damaged nodes and the number of repairs executed γrX;i ðtÞ ¼ γXr;0 ð1 αð1 hyii ðtÞÞÞ; ð5Þ
within a given time window, analogous to the elastic balance
between displacement and restoring forces in stress-strain enabling us to describe the expected behavior of g(x) to first order
relationships in materials science26,27. A constant damage rate with the assumption that α ∈ (0, 1). Specifically, we assume
γdμ leads to γdμ N sites being damaged at any time, and temporal that damage in Y will not improve repair in X (g 0 ð1Þ ≥ 0 ! α ≥ 0)
and that the repair rate must remain positive
variability can be modeled by replacing the constant γdμ with a
(jg 0 ð1Þj ≤ jgð1Þj ! α ≤ 1).
stochastic variable from a representative distribution (see If damage is sporadic and uncorrelated across both systems, the
supplementary note 3). simultaneous failure of xi and yi for a given i is rare, and when the
failures are limited to a single network, recovery is not impaired
Observed outage recovery behavior. To empirically test the (Fig. 1b). However, if damage in X and Y is correlated in time or
validity of elastic recovery, we built an Outage Observatory, a space, simultaneous damage of nearby sites in X and Y will occur
suite of continually running web crawlers that record live- with higher frequency and based on Eq. (5) we expect a reduction
updating outage maps28–30 from electrical utilities around the in the repair rate. Such correlations are often caused by severe
United States (Fig. 2a). During 2019 the Observatory recorded weather events, the main source of disruptions to all infra-
over 5 million power outages, capturing the geographic location structure systems in the United States32–34. These events are
and time of each outage and the repair time for each incident highly localized in time and space, simultaneously damaging the
(Fig. 2e). By comparing the number of repairs and outages electric, communications, and transportation networks. Hurri-
occurring in a utility at any time, we can construct the damage- cane Sandy, for example, induced failures across the power grid
repair curves for each utility (Fig. 2b and c), finding that for most and communications networks (downed lines, flooded control
utilities the recovery follows the linear response of Eq. (1) 95% of centers) and transportation networks (flooded roads). These
the time, whose slope provides the repair rate (supplementary simultaneous failures lead to recovery delays, as power outages
note 5 for details). However, we also observed multiple large could not be repaired because roads were flooded. At times, the
disruptions, for which the number of repairs systematically and coupling was bi-directional: some flooded roads had pumping
significantly deviates from the linear pattern characterizing the systems for drainage, which could not be operated without
elastic behavior (Fig. 2d). We have been able to link many of these electricity17.
to large events such as severe winds, rainfall, snowfall, and fires.
For example, a derecho system that struck the Northern Midwest Recovery coupling case study: Tropical Storm Imelda. When
on 19 July 201931 caused over 55,000 outages, resulting in over 60 there are many outages at once, the repair time can also be
million lost customer hours. Each perturbation impacts the power affected by resource limitations, like a limited number of repair
grid and its support systems in different ways, hence the precise crew members and trucks. Yet resource limitations are expected
deviation from linearity cannot be inferred from the number of to impact the whole service area equally. If, however, the slow-
outages alone. Though each large failure has its unique cause and down is limited to regions where the support infrastructure is
recovery dynamics, when we place all perturbations on the same damaged, recovery coupling is the main driving factor. To dis-
graph we observe a remarkable universality, finding that all large tinguish between these two mechanisms, we relied on natural
events display similar nonlinear behavior (Fig. 2d). experiments, when exogenous shocks simultaneously affected the
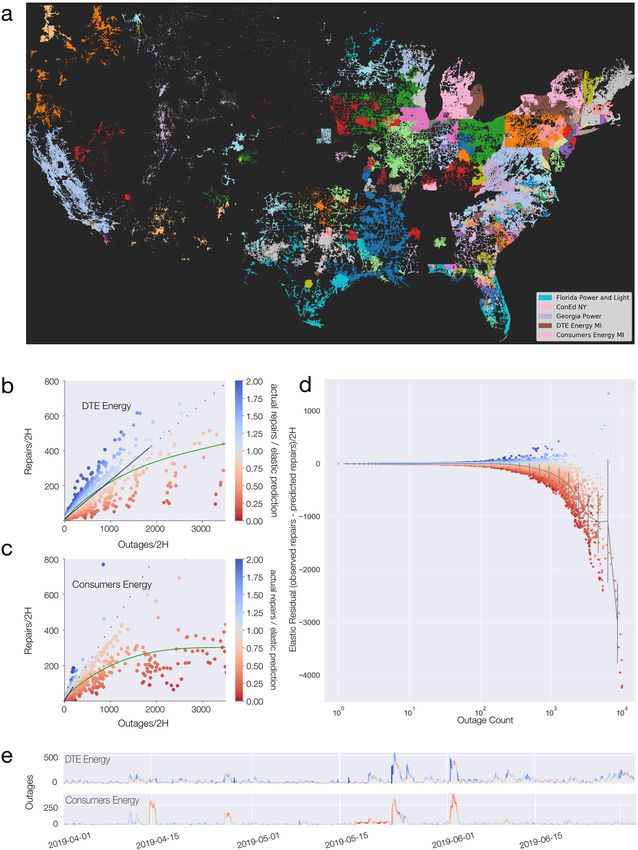
electrical network and its support networks. In September 2019,
Modeling recovery coupling. The loss of elasticity during Tropical Depression Imelda caused widespread power outages
extreme perturbations indicates that the hypothesis of a constant and flooding in Houston, Texas, and the surrounding area
repair rate is not sufficient to explain the system’s behavior. Given (Fig. 3a). We analyzed the duration for all power outages in the
that the repair process requires resources from other networks, vicinity of flooded roads, using areas without flooding as control,
we hypothesize that a multi-network approach could explain the allowing us to test whether the slowdown in outage repairs was
observed deviation. To model the observed dependency, we allow due to system-wide drains on resources or on the dependence of
the repair rate γrX;i of the primary network X (e.g., power grid) at the repair rate on road networks. We also considered a temporal
node i to depend on the state of the support network Y (e.g., road control, inspecting the repair times of outages reported over the
or communication network) at the same location (Fig. 1b), previous 60 days in the same area (Fig. 3b, e). We find that the
NATURE COMMUNICATIONS | (2022)13:955 | https://doi.org/10.1038/s41467-022-28379-5 | www.nature.com/naturecommunications 3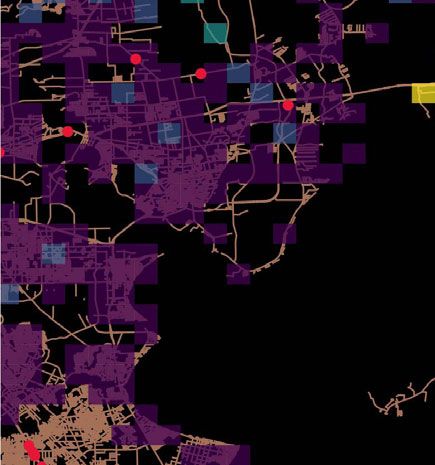
ARTICLE                                                                NATURE COMMUNICATIONS | https://doi.org/10.1038/s41467-022-28379-5

slowdown in outage restoration is heavily localized in both space           observed separation of outage survival curves at different dis-
and time around the flooded roads: while more than 95% of the                tances from flooded roads offers direct evidence of multilayer
outages located more than 30 km from the flooded roads were                  recovery coupling, illustrating how damage in a non-electrical
repaired within 10 h, 40% of the failures occurring within 5 km of          infrastructure impacts the functionality of the electrical
a flooded road remained unrepaired after 10 h. Furthermore, even             infrastructure.
during the storm, outages far from flooded roads were repaired at               Further evidence of the proposed phenomenon is provided by
the same rate as without a storm (spatial control, Fig. 3e). The            the coexistence of elastic behavior far from the flooded roads with

4               NATURE COMMUNICATIONS | (2022)13:955 | https://doi.org/10.1038/s41467-022-28379-5 | www.nature.com/naturecommunications
NATURE COMMUNICATIONS | https://doi.org/10.1038/s41467-022-28379-5                                                                         ARTICLE

Fig. 2 Elastic and inelastic recovery in the power grid. a Locations of outages recorded by the Outage Observatory, colored by the utility serving that area.
b, c Repairs executed vs total outages recorded for each 2-h window for DTE Energy (b) and Consumers Energy (c), two large utilities in Michigan. An
elastic response implies that a constant fraction of outages are repaired at any given time. When the number of outages is small, the response is elastic but
when the system experiences a large number of outages it can become increasingly inelastic. Red and blue indicate the deviation from elastic response in
the downward and upward direction, respectively. d The elastic residual is the difference between the observed repair and the predicted repair based on an
elastic response. Comparing the 30 utilities with the most outages, we find a universal downward deviation, (more red points). e The number of outages
observed at each moment for DTE Energy and Consumers Energy. Because the deviation from elasticity can be quantified for each time window, we can
use the color map of panels (b, c) to indicate system elasticity over time. Measurements of elastic and inelastic recovery for more utilities can be found in
Supplementary Figs. 3 and 4.

inelastic behavior near them (Fig. 3c, d). We note that the repair              of the curve, while lower values of α do not, providing further
amounts are not only below the elastic prediction, but decrease                 evidence that the general deviation from elasticity is consistent
with increased damage, in line with the prediction that the                     with recovery coupling.
deviation from elasticity is not due to resource constraints which
tend toward saturation of repair per unit time (Supplementary
note 2 and ref. 35).                                                            Discussion
                                                                                The 27 September 2003 blackout in Italy is often used to illustrate
Recovery coupling simulations and phase space. To understand                    how the interdependence of communications and electrical
the implications of recovery coupling for multilayer network                    infrastructure can cause cascading failures3,40. However, a closer
resilience, we consider the symmetric case in which the network                 look at the sequence of events indicates that though transmission
structure, damage, and recovery parameters are the same in both                 network overload cascades triggered the power outage41, depen-
systems. Since the two systems support each other, we let the                   dence of repair activities on the communication network which
repair rate of Y be influenced by the state of X in the same                     was itself disabled, prolonged the recovery process42. Here we
manner as Eq. (5): γrY;i ðtÞ ¼ gðhxii ðtÞÞ. In the symmetric case               demonstrated that such recovery coupling can lead by itself to a
fx = fy = f, leading to a single equation that governs the state of             collapse of functionality. More importantly, we have shown that
the system. If the failures are uniformly distributed, we can use               the signatures of recovery coupling are directly observable during
percolation theory36,37 to analytically derive the equation that                severe weather events, indicating that the proposed mechanisms
governs the expected fraction of primary failures in the coupled                have direct relevance to real multilayer networks. Domino-like
system,                                                                         dependencies, which could co-occur, further amplify this danger,
                                                                                though some interdependencies have been shown to reduce
                                          1                                     cascading43.
                  f ¼        γr;0
                                                             ;           ð6Þ
                        1þ          ð1  αð1  uð1  f ÞÞÞ                         The data-driven approach presented here enables a more
                             γd
                                                                                precise understanding of infrastructure interdependence. For
where u(x) is the probability that a link does not lead to the                  example, we find that while the set of flooded roads as a whole
largest connected component when a random fraction 1 − x of                     caused slowdowns in power outage repairs, some impaired roads
the nodes are removed, and is determined by the network                         had much stronger effects than others. The roads in downtown
topology. Equation (6) has one or two stable solutions depending                Houston caused only minor delays when flooded, while in
                                                                                Beaumont and Northeast Houston flooded roads caused severe
on the value of the control parameter γγd . The non-symmetric case
                                         r;0

                                                                                delays (Fig. 3a). Improving the precision with which we measure
has similar results, as we shown in supplementary note 1 and                    infrastructure vulnerability is particularly important in light of
Supplementary Fig. 1. In contrast, the uncoupled case (2), which                aging infrastructure and climate change.
we recover from (6) for α = 0, has a single stable solution. The                   Our findings reinforce the importance of engineering for
new solution describes a stable fixed point at f = 1 (all nodes                  resilience not only through strengthening critical infrastructure,
failed), which persists even for high recovery rates γγd (see Fig. 4a).
                                                       r;0
                                                                                but also focusing on the socio-technological layers needed to
                                                                                restore the infrastructure when damaged. These recovering sys-
The existence of two stable solutions for f for the same recovery
                                                                                tems may supply electricity, fuel or access, or they may provide
rate γγd indicates that for a wide range of conditions, recovery
       r;0

                                                                                human connections through social networks, which have also
coupled networks are resilient: they display functionality com-                 been shown to play a powerful role in disaster recovery44.
parable to the uncoupled case and return to full functionality                     Recovery coupling has relevance for other systems affected by
following small perturbations38,39. However, a sufficiently large                multiple networks. A pertinent example is the impact of loss of
perturbation can force the system to cross the unstable branch,                 healing ability during aging. Living organisms display a funda-
pushing it into a dynamically stable non-functional state (Fig. 4a).            mental asymmetry between damage and repair, similar to what
This is more likely with correlated perturbations across layers, as             we observe in infrastructure networks: damage is typically caused
we show in Supplementary Fig. 2. The existence of this behavior                 by external factors (oxidants, pathogens, shocks, etc.) while repair
analytically predicts a “catch 22” phase that follows a sufficiently             is endogenous and is governed by multiple coupled networks
large disaster: infrastructure system X cannot be repaired because              (regulatory, metabolic and signaling) requiring diverse resources
it requires resources from Y, and Y cannot be repaired because it               (nutrients, oxygen, immune cells, etc.). From this perspective our
requires resources from X. The fact that the collapsed state per-               work complements recent network-based modeling of the rela-
sists even for high repair rates and low damage rates predicts that             tion between repair and aging45,46, illustrating how the well-
it is harder to bootstrap a broken system than it is to maintain the            documented loss of healing ability in individual systems47, can
functionality of one that is damaged but still working. Synthe-                 lead to systemic frailty, where the organisim can lose its ability to
sizing elastic residual curves (Fig. 4c) like the observations in               respond to shocks that it could tolerate under normal
Fig. 2d, we find that the full coupling α = 1 reproduces the shape               conditions48.

NATURE COMMUNICATIONS | (2022)13:955 | https://doi.org/10.1038/s41467-022-28379-5 | www.nature.com/naturecommunications                                    5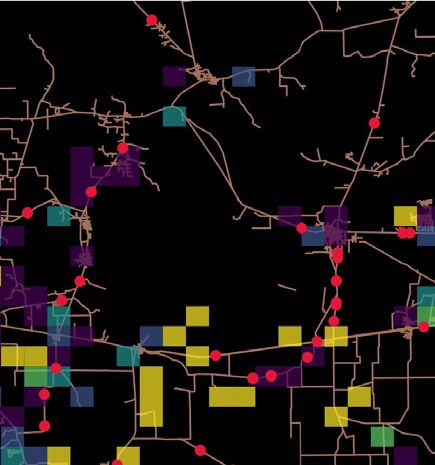
ARTICLE                                                                         NATURE COMMUNICATIONS | https://doi.org/10.1038/s41467-022-28379-5

Methods                                                                              identify the outage’s location and duration. For more detail about the data col-
Data. Outage data were collected by taking regular snapshots (several per hour) of   lection, see supplementary note 4 and Supplementary Table 1. To download the
the outage maps published by electric utilities around the United States. Each       data used in this analysis, visit https://github.com/mmdanziger/recovery-coupling.
snapshot contains a geotagged list of all outages active at that time, including
transmission and distribution outages. A single outage is reported for each inci-
dent, even if many customers are affected. By comparing snapshots from moment        Simulation. We performed discrete-time simulations where at each time point we
to moment, and noting the first and last time that the outage appeared, we can        scan all nodes in each node. For every operational node, we switch it to inopera-

6                   NATURE COMMUNICATIONS | (2022)13:955 | https://doi.org/10.1038/s41467-022-28379-5 | www.nature.com/naturecommunications
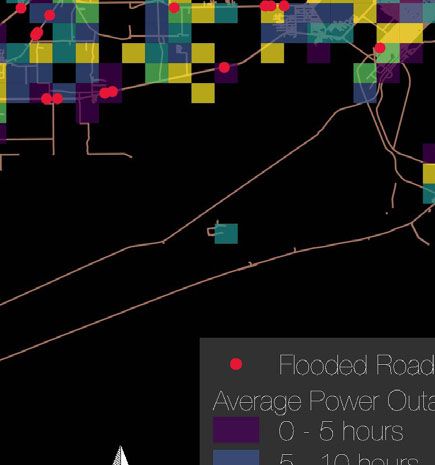
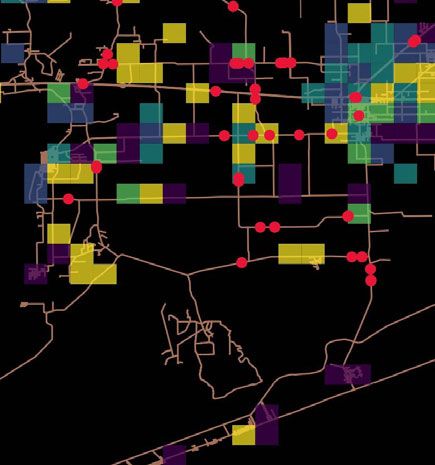
NATURE COMMUNICATIONS | https://doi.org/10.1038/s41467-022-28379-5                                                                                             ARTICLE

Fig. 3 Empirical evidence for recovery coupling. a Average outage duration and location of flooded roads during Tropical Depression Imelda. Delayed
restoration occurred primarily around Beaumont and Northeast Houston, where most flooded roads were located. b Number of outages (orange) and
flooded roads (blue) during Imelda. The shaded orange curve shows the middle quartiles of outages for the same times (hour and day) with no storm,
offering a time control. c The recovery of outages during Imelda that were far (≥10 km) from flooded roads is well approximated by an elastic (linear)
response. d Outages near (
ARTICLE                                                                             NATURE COMMUNICATIONS | https://doi.org/10.1038/s41467-022-28379-5

22. Morone, F., Ma, L., Makse, H. & Scala, A., Enhancing network resilience via           46. Taneja, S., Mitnitski, A. B., Rockwood, K. & Rutenberg, A. D. Dynamical
    self-healing, 2016 IEEE Workshop on Environmental, Energy, and Structural                 network model for age-related health deficits and mortality. Phys. Rev. E 93,
    Monitoring Systems (EESMS) https://doi.org/10.1109/eesms.2016.7504816                     022309 (2016).
    (2016).                                                                               47. Meinberg, E., Clark, D., Miclau, K., Marcucio, R. & Miclau, T. Fracture repair
23. Stippinger, M. & Kertész, J. Enhancing resilience of interdependent networks              in the elderly: Clinical and experimental considerations. Injury 50, S62–S65
    by healing. Phys. A: Stat. Mech. its Appl. 416, 481 (2014).                               (2019).
24. Smith, A. M. et al. Competitive percolation strategies for network recovery.          48. Lang, P.-O., Michel, J.-P. & Zekry, D. Frailty syndrome: a transitional state in
    Sci. Rep. 9, https://doi.org/10.1038/s41598-019-48036-0 (2019).                           a dynamic process. Gerontology 55, 539–549 (2009).
25. National Academies of Sciences Engineering and Medicine, Enhancing the
    resilience of the Nation’s electricity system (National Academies Press, 2017).
26. Dessavre, D. G., Ramirez-Marquez, J. E. & Barker, K. Multidimensional approach        Acknowledgements
    to complex system resilience analysis. Reliab. Eng., Syst. Saf. 149, 34 (2016).       A.L.B. was supported by NSF CRISP (1735505) and by ONR N00014-18-9-001. M.M.D.
27. Fink, G. A., Griswold, R. L. & Beech, Z. W. Quantifying cyber-resilience              would like to thank D. Aldrich, B. Barzel, S.P. Cornelius, A. Gates, A. Grishchenko, S.
    against resource-exhaustion attacks, in 2014 7th International Symposium on           Havlin, G. Menichetti R.Q. Wang and H. Wu for the many helpful conversations which
    Resilient Control Systems (ISRCS) pp. 1–8 (2014).                                     advanced this research.
28. Ji, C. et al. Large-scale data analysis of power grid resilience across multiple US
    service regions. Nat. Energy 1, 16052 (2016).                                         Author contributions
29. Dobson, I. Electricity grid: when the lights go out. Nat. Energy 1, 16059 (2016).     M.M.D. collected the data, developed the model and analyzed the results. M.M.D. and
30. Duffey, R. B. Power restoration prediction following extreme events and               A.L.B. designed the research and wrote the paper.
    disasters. Int. J. Disaster Risk Sci. 10, 134–148 (2018).
31. Borghoff, W. R. A meteorological assessement of the initial development of
    the 19 july 2019 wisconsin derecho, in 100th American Meteorological Society          Competing interests
    Annual Meeting (AMS, 2020).                                                           A.-L.B. is the founder of Scipher Medicine, Inc., which applies network medicine to
32. Brown, R., Gupta, S., Christie, R., Venkata, S. & Fletcher, R. Distribution           biomarker development, of Foodome, Inc., which applies data science to health, and
    system reliability assessment: momentary interruptions and storms. IEEE               Datapolis, Inc., which focuses on human mobility. M.M.D. declares no competing
    Trans. Power Deliv. 12, 1569 (1997).                                                  interests.
33. Liu, H., Davidson, R. A. & Apanasovich, T. V. Statistical forecasting of electric
    power restoration times in hurricanes and ice storms. IEEE Trans. Power Syst.
    22, 2270–2279 (2007).
                                                                                          Additional information
                                                                                          Supplementary information The online version contains supplementary material
34. Mukherjee, S., Nateghi, R. & Hastak, M. A multi-hazard approach to assess
                                                                                          available at https://doi.org/10.1038/s41467-022-28379-5.
    severe weather-induced major power outage risks in the U.S. Reliab. Eng., Syst.
    Saf. 175, 283 (2018).
                                                                                          Correspondence and requests for materials should be addressed to Michael M. Danziger.
35. Zhang, X., Ruan, Z., Zheng, M., Barzel, B. & Boccaletti, S. Epidemic spreading
    under infection-reduced-recovery. Chaos, Solitons, Fractals 140, 110130
                                                                                          Peer review information Nature Communications thanks the anonymous, re-viewer(s)
    (2020).
                                                                                          for their contribution to the peer review of this work. Peer reviewer reports are available.
36. Cohen, R. & Havlin, S. Complex Networks: Structure, Robustness and Function
    (Cambridge University Press, 2010).
                                                                                          Reprints and permission information is available at http://www.nature.com/reprints
37. Barabási, A.-L. & Pósfai, M. Network Science (Cambridge University Press, 2016).
38. Menck, P. J., Heitzig, J., Marwan, N. & Kurths, J. How basin stability                Publisher’s note Springer Nature remains neutral with regard to jurisdictional claims in
    complements the linear-stability paradigm. Nat. Phys. 9, 89–92 (2013).                published maps and institutional affiliations.
39. Gao, J., Barzel, B. & Barabási, A.-L. Universal resilience patterns in complex
    networks. Nature 530, 307 (2016).
40. Rosato, V. et al. Modelling interdependent infrastructures using interacting
    dynamical models. Int. J. Crit. Infrastruct. 4, 63 (2008).                                              Open Access This article is licensed under a Creative Commons
41. Pourbeik, P., Kundur, P. & Taylor, C. The anatomy of a power grid blackout -                            Attribution 4.0 International License, which permits use, sharing,
    root causes and dynamics of recent major blackouts. IEEE Power Energy Mag.            adaptation, distribution and reproduction in any medium or format, as long as you give
    4, 22 (2006).                                                                         appropriate credit to the original author(s) and the source, provide a link to the Creative
42. Bologna, S. & Setola, R. The need to improve local self-awareness in cip/ciip,        Commons license, and indicate if changes were made. The images or other third party
    in First IEEE International Workshop on Critical Infrastructure Protection            material in this article are included in the article’s Creative Commons license, unless
    (IWCIP’05) 6 pp (2005).                                                               indicated otherwise in a credit line to the material. If material is not included in the
43. Korkali, M., Veneman, J. G., Tivnan, B. F., Bagrow, J. P. & Hines, P. D. H.           article’s Creative Commons license and your intended use is not permitted by statutory
    Reducing cascading failure risk by increasing infrastructure network                  regulation or exceeds the permitted use, you will need to obtain permission directly from
    interdependence, Sci. Rep. 7, https://doi.org/10.1038/srep44499 (2017).               the copyright holder. To view a copy of this license, visit http://creativecommons.org/
44. Aldrich, D. Building Resilience: Social Capital in Post-Disaster Recovery             licenses/by/4.0/.
    (University of Chicago Press, 2012).
45. Vural, D. C., Morrison, G. & Mahadevan, L. Aging in complex
    interdependency networks. Phys. Rev. E 89, 022811 (2014).                             © The Author(s) 2022

8                     NATURE COMMUNICATIONS | (2022)13:955 | https://doi.org/10.1038/s41467-022-28379-5 | www.nature.com/naturecommunications
You can also read