Rhode Island's Funding Formula After Ten Years: Education Finance in the Ocean State - April 2022
←
→
Page content transcription
If your browser does not render page correctly, please read the page content below
Rhode Island’s
Funding Formula
After Ten Years:
Education
Finance in the
Ocean State

The Third in a Series
on Municipal Finance

April 2022
Abbreviations

AEWAV – Adjusted Equalized Weighted Assessed Value
ADM – Average Daily Membership
BEP – Basic Education Program
ESEA – Elementary and Secondary Education Act
ESSA – Every Student Succeeds Act
ESSER – Elementary and Secondary School Emergency Relief
FY – Fiscal Year
FRPL – Free and Reduced-Price Lunch
IDEA – Individuals with Disabilities Education Act
LEA – Local Education Agency
LEP – Limited English Proficiency
MOE – Maintenance of Effort
NCES – National Center for Education Statistics
RADM – Resident Average Daily Membership
RIDE – Rhode Island Department of Education
SNAP – Supplemental Nutrition Assistance Program
SSR – State Share Ratio
SSRC – State Share Ratio for the Community
SSF – Student Success Factor
UCOA- Uniform Chart of Accounts

 Page 2 of 50
Table of Contents

Section Page

I. Introduction 4

II. The History of Education Finance 7

III. Education Revenues 15

IV. Education Spending 34

V. RIPEC Comments 43

 Appendix 46

 Page 3 of 50
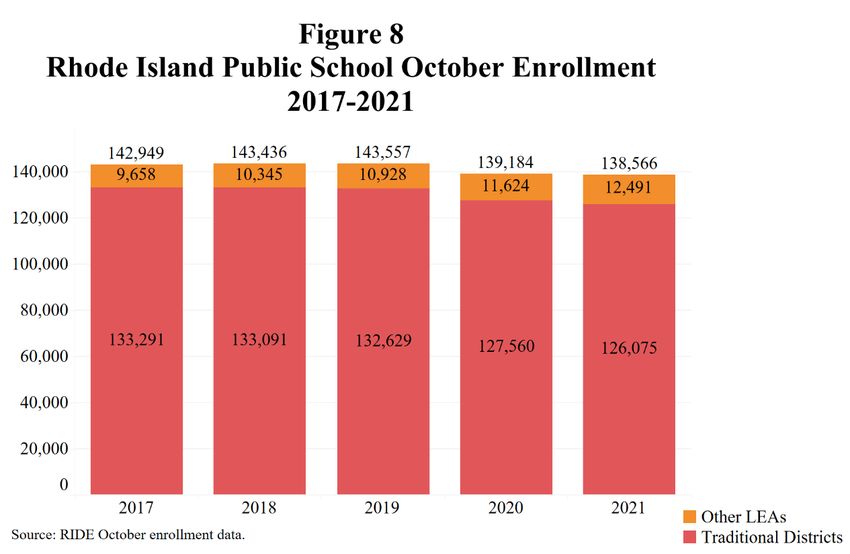
I. Introduction

While government plays a large role in many aspects of modern American life, there is perhaps no
area of government that affects as many people or is as fundamental to the workings of our society
as our public elementary and secondary education system. Most American children—50.7 million
students as of 2018—spend their formative years attending public schools, which are foundational
to the creation and maintenance of a strong economy and a functioning democracy.1 The
importance of public education in the U.S. is reflected in the sheer size of the investment of public
dollars into this system each year. State and local governments spent $717.7 billion on elementary
and secondary education in fiscal year (FY) 2019, a figure that represents 18.1 percent of all state
and local expenditures that year.2 This public investment also supports a significant employment
sector; as of 2019, total school staff—including teachers, administrators, and support staff—
numbered 6.7 million nationwide.3

Going back centuries, the American system of public education has adhered to the principle that
elementary and secondary education should be a local exercise. When it comes to financing
education, however, the respective roles of federal, state, and local governments have become
deeply intertwined and vary both among and within states. While local administration may be an
important feature of American public education, stark socioeconomic inequalities among
municipalities and differences among states have given rise to a complex patchwork of state
funding formulas and federal grant programs aimed to assist local governments in providing a
sufficient education to students.

The workings of Rhode Island’s education finance system are highly consequential for the finances
of every municipality in the state—education is by far the largest local expenditure in Rhode
Island, comprising 60.1 percent of all municipal spending in FY 2019.4 This report seeks to
describe this system, which collectively educates over 130,000 students across 63 local education
agencies (LEAs), which include regular school districts, regional school districts, state-run
schools, and charter schools.5 Rhode Island has 36 traditional school districts, including 32

1
 As of 2018, there were 50.7 million public elementary and secondary school students, compared to 5.7 million private
school students and 1.6 million homeschooled students. U.S. Department of Education, National Center for Education
Statistics, Digest of Education Statistics, 2020.
2
 U.S. Census Bureau, 2019 Annual Survey of State and Local Government Finances; RIPEC calculations.
3
 This number reflects the total number of full-time equivalent jobs. U.S. Department of Education, National Center
for Education Statistics, Common Core of Data (CCD), "State Nonfiscal Survey of Public Elementary/Secondary
Education," 2019-20.
4
 R.I. Division of Municipal Finance, Rhode Island Municipal Transparency Portal; Rhode Island Department of
Education (RIDE), UCOA data; RIPEC calculations. Education expenditures funded by state education aid are
categorized as local expenditures for purposes of this calculation.
5
 This figure includes over 2,000 students enrolled in public pre-kindergarten programs. RIDE, October 2021
enrollment data.

 Page 4 of 50
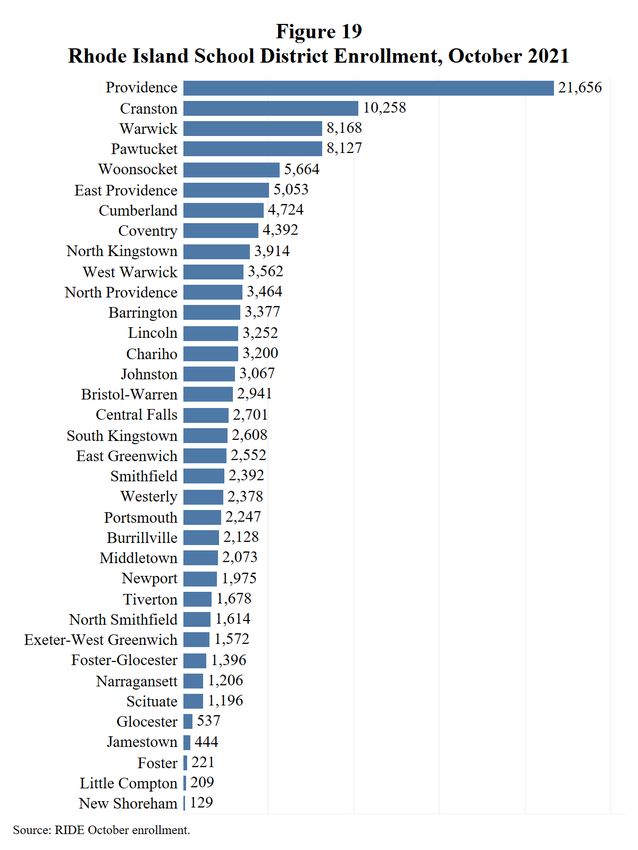
municipal school districts and four regional school districts (Bristol-Warren, Chariho, Foster-
Glocester, and Exeter-West Greenwich).6

This report describes how Rhode Island’s education finance system attempts to account and adjust
for two key factors that have provoked greater involvement by state and federal governments in
matters of education finance nationwide. The first is the variation in socioeconomic and
demographic characteristics among public school populations. Education finance systems
typically recognize that certain student populations—including students from disadvantaged
backgrounds, students with special needs, and those who speak English as a second language—
require greater resources. As of October 2021, 40.6 percent of Rhode Island public school students
qualified for free or reduced-price lunch (FRPL), 15.9 percent had individualized education plans,
and 11.3 percent were categorized as limited English proficient (LEP); however certain districts
have proportions of these student populations that are significantly higher than the statewide total.7
The second key factor is that districts with higher proportions of students requiring greater
resources are frequently constrained in raising local revenues for education and other essential
municipal services due to a lack of property wealth. Despite efforts by Rhode Island policymakers
to account for these factors in targeting state aid, inequalities persist.

In addition to this introduction, there are five sections in this report. Section II summarizes the
history of education finance in both the United States and Rhode Island. Section III gives an
overview of education revenues in Rhode Island, including an analysis of the state’s education
funding formula, and compares Rhode Island’s education revenue mix to that of the New England
region and the U.S. Section IV breaks down education expenditures across Rhode Island districts
and compares education spending in Rhode Island to the region and nation. Finally, Section V
provides RIPEC comments and policy recommendations.

This report is the third in a series on municipal finance. The first, “An Introduction to Municipal
Finance in Rhode Island,” provided a foundational overview of the state’s structures of municipal
finance.8 The second, “A System Out of Balance: Property Taxation Across Rhode Island,”
supplied an in-depth analysis of property taxation, by far the largest source of local revenue in the
state.9 Subsequent reports in RIPEC’s municipal finance series will focus on other major
expenditure categories. As with the other reports in this series, this report includes figures available

6
 Chariho Regional School District encompasses the towns of Charlestown, Richmond, and Hopkinton. Foster and
Glocester appear as municipal districts and as a combined regional district because the towns operate their own
elementary schools but share a middle school and a high school. The great majority—91.0 percent—of Rhode Island
public school students attend traditional school districts. The remaining 9.0 percent attend state or charter public
schools. School district enrollment figures are included in the appendix of this report. RIDE, October 2021 enrollment
data; RIPEC calculations.
7
 Free or Reduced-Price Lunch is a federal program that is frequently used as a proxy measure for low-income students.
Students with annual household incomes under 185 percent of the federal poverty line, or $51,338 for a family of 4 in
2022, qualify for the program. RIDE, October 2021 enrollment data; U.S. Department of Health and Human Services,
Annual Update of the HHS Poverty Guidelines, January 21, 2022.
8
 Rhode Island Public Expenditure Council, “An Introduction to Municipal Finance in Rhode Island,” April 2021.
9
 Rhode Island Public Expenditure Council, “A System Out of Balance: Property Taxation Across Rhode Island,”
January 2022.

 Page 5 of 50
on RIPEC’s website that allow for user interaction and manipulation. The data dashboard that
corresponds with this report is available here.

 Page 6 of 50
II. The History of Education Finance

This section provides a general overview of the structure of school funding programs throughout
U.S. and Rhode Island history, dating from the colonial period to present.

School Funding in the United States

The Origins of Locally Administered Education

The local character of public schools in the United States dates to the 17th century when religious
instruction was the primary motive for the earliest colonial schools. Approaches to establish and
operate schools differed across the colonies based on prevailing local religious beliefs. Such was
the case in colonial Massachusetts, where some of the earliest statutes on education were enacted.
The Massachusetts Law of 1647, which required towns to either support the salary of a teacher or
set up a grammar school, was enacted directly on behalf of the Puritan church, which was
concerned that voluntary schooling in homes was insufficient to establish the literacy required of
followers of Puritan religious theory.10

The earliest compulsory education laws were weakly enforced, and significant numbers of children
received the bulk of their education in family settings.11 Access to formalized schools was highly
unequal in terms of income, race, and gender, among other factors. However, in the mid-19th
century, a period of rapid urbanization coincided with a successful movement, mostly in Northern
states, to establish free, non-denominational schools. As part of this movement, state governments
began to assert a larger role in both shaping and financing systems of public education, including
the enactment of more effective compulsory education laws and elimination of tuition fees.12
While local governments maintained primary responsibility for raising education revenues, states
began increasing education appropriations after the Civil War, and by 1890, 18.4 percent of
government revenues for public schools came from state governments.13

Property Taxation for Public Education

By 1915, every state in the U.S. had enacted a compulsory education law and consistent streams
of tax revenues became necessary to support rapidly growing public school systems, a

10
 Ellwood Patterson Cubberley, Public education in the United States, a study and interpretation of American
educational history; an introductory textbook dealing with the larger problems of present-day education in the light
of their historical development, (Boston, Hughton Mifflin: 1919).
11
 Michael S. Katz, “A History of Compulsory Education Laws,” The Phi Delta Kappa Educational Foundation, 1976.
12
 Nancy Kober and Diane Stark Rentner, “History and Evolution of Public Education in the US,” Center for Education
Policy, George Washington University, 2020.
13
 Total government revenues for public education in 1890 were $141 million. Charles S. Benson and Kevin
O’Halloran, “The Economic History of School Finance in the United States,” Journal of Education Finance, vol. 12,
no. 4 (1987): 495–515.

 Page 7 of 50
responsibility that continued to fall primarily on local governments.14 During this period, property
taxes became the primary means of raising revenue for local governments and thus became closely
associated with education finance—from 1902 to 1932, total local revenues in the U.S. grew by
$5.28 billion, with property tax revenue accounting for $3.54 billion, or 67.0 percent, of that
growth.15 From 1903 to 1930, total revenue receipts for public elementary and secondary education
grew from $253 million to $2.09 billion, with the share raised by local governments remaining
constant above 80 percent.16

Federal Involvement in Education Finance

The federal government remained distant from matters of education finance until the 20th century,
when growing attention was paid to inequities in school funding.17 In 1930, the state with the
lowest expenditures per student, Georgia, spent less than one quarter per student than the state with
the highest per pupil expenditures, New York. Several initiatives were proposed in Congress that
sought to equalize these inequities between the late 19th century and the mid-20th century, but none
were successful.18

It was not until President Lyndon Johnson’s Great Society initiatives that the federal government
began taking a more significant role in financing elementary and secondary education. Johnson’s
administration linked federal involvement in education finance to his War on Poverty program and
proposed a system of categorical aid targeted to schools with relatively high levels of student
poverty.19 Such was the framework established in the Elementary and Secondary Education Act
(ESEA), signed into law in 1965.20 The largest program within ESEA was Title I, which directed
targeted grants to schools in areas with high concentrations of low-income families.21

14
 The specific nature of state laws and their enforcement mechanisms varied by state. Michael S. Katz, “A History of
Compulsory Education Laws,” The Phi Delta Kappa Educational Foundation, 1976. Total revenue receipts for
education increased by 68.3 percent between 1903 and 1910, and more than doubled between 1910 and 1920. Charles
S. Benson and Kevin O’Halloran, “The Economic History of School Finance in the United States,” Journal of
Education Finance, vol. 12, no. 4 (1987): 495–515.
15
 John Joseph Wallis, “A History of Property Tax in America,” Department of Economics at the University of
Maryland and the National Bureau of Economic Research; RIPEC calculations.
16
 Charles S. Benson and Kevin O’Halloran, “The Economic History of School Finance in the United States,” Journal
of Education Finance, vol. 12, no. 4 (1987): 495–515.
17
 Although the U.S. Department of Education was created in 1867, its role was only to collect data about schools, and
it would later be relegated below the cabinet level for over 100 years due to concerns about federal involvement in
local schools. U.S. Department of Education, “An Overview of the U.S. Department of Education,” 2010.
18
 In 1930, Georgia spent $32 per student, while New York spent $138 per student. The national average was $87 per
student. Charles S. Benson and Kevin O’Halloran, “The Economic History of School Finance in the United States,”
Journal of Education Finance, vol. 12, no. 4 (1987): 495–515.
19
 Janet Y. Thomas and Kevin P. Brady, “The Elementary and Secondary Education Act at 40: Equity, Accountability,
and the Evolving Federal Role in Public Education,” Review of Research in Education, vol. 29 (2005): 51–67.
20
 Douglas Glamson et. al., “The Elementary and Secondary Education Act at Fifty: Aspirations, Effects, and
Limitations,” Russell Sage Foundation Journal of the Social Sciences, 2015.
21
 Phyllis McClure, “The History of Educational Comparability in Title I of the Elementary and Secondary Education
Act of 1965,” Center for American Progress, 2008.

 Page 8 of 50
ESEA today remains the foundation for federal involvement in education finance. The law has
been refined and updated in the decades since—in 2015, it was reauthorized as the Every Student
Succeeds Act (ESSA), a reform and rebranding effort that supplanted the No Child Left Behind
Act (2001).22 The core function of federal education finance law remains largely the same,
however—leveraging federal resources to supplement state and local financing of education,
particularly for districts serving large numbers of students living in poverty.

In the last two years, the federal government responded to the challenges presented to public
schools by the COVID-19 pandemic with a large infusion of federal funds. Through three separate
pandemic relief bills passed over the course of one year, Congress allocated $190.5 billion in
Elementary and Secondary School Emergency Relief (ESSER) funds, most of which flowed
directly to LEAs.23

Constitutional Approaches to Education

In the 1960s, while the federal government sought to address disparities in education funding, the
inequitable features of state education finance systems came under greater scrutiny. In 1968,
parents in San Antonio, Texas filed a class-action lawsuit alleging that the system used for
distributing education funding by the State of Texas violated the 14th Amendment to the
Constitution.24 The case reached the U.S. Supreme Court and, in 1973, the Court’s majority ruled
in favor of the state, writing that the court could not find that disparities in school financing were
“the product of a system that is so irrational as to be invidiously discriminatory.”25

The San Antonio Independent School District v. Rodriguez ruling is considered a landmark and
highly controversial decision to this day and was consequential in spurring efforts across the
country to enshrine the constitutional right to an adequate public education at the state level.26
California became the first state to do so in 1976. Presently, constitutional guarantees to education
have been established in 26 states, either through amendments to state constitutions or by way of
court decisions.27

There is a large body of research that seeks to measure the effects of state constitutional guarantees,
which in theory give state courts standing to mandate changes to education finance systems. A
2021 study from the Federal Reserve Bank of Minneapolis on the effects of enacted constitutional
provisions between 1990 and 2018 shows that successful amendments led to higher per pupil

22
 U.S. Pub. Law 114-95—December 10, 2015.
23
 States received proportional allocations of ESSER funds according to their usual distribution of Title-IA funds under
ESSA. National Conference of State Legislatures, Elementary and Secondary School Emergency Relief Fund Tracker.
24
 At the time, local districts in Texas collectively contributed 20 percent of public education expenses, including
teacher salaries and operating costs. Districts’ contributions were formulated based on their relative ability to raise
revenue at the local level. Charles J. Ogletree, Jr., “The Legacy and Implications of San Antonio Independent School
District v. Rodriguez,” 17 Rich. J.L. & Pub. Int. 515 (2014).
25
 Ibid.
26
 David G. Savage, “How Did They Get It So Wrong?,” American Bar Association Journal, 2009.
27
 Trish Brennan-Gac, “Education Rights in the States,” Human Rights, vol. 40, no. 2 (2014).

 Page 9 of 50
spending, smaller class sizes, and better student performance on standardized tests. The authors of
that study conclude that constitutional provisions frequently act as a catalyst for legislative reforms
that preempt potential judicial involvement.28 On the other hand, several studies show that court-
mandated reforms to education finance systems have a mixed record—while successful litigation
has often led to higher per pupil expenditures, in some cases, these increases were ultimately
smaller than in states without court-mandated education reform over the same period.29

School Funding in Rhode Island

Colonial Beginnings Through the 19th Century

Unlike neighboring states, where church and state were closely intertwined, early colonial Rhode
Island, due to its status as a haven of religious freedom, did not enact laws declaring the provision
of education to be an essential duty of the government.30 Nevertheless, the four earliest settlements
in Rhode Island—Newport, Providence, Warwick, and Portsmouth—all designated public land for
schools between 1639-1716.31 Towns moreover supported schools in a variety of limited ways,
including assisting with the construction of school buildings and partial payment of a
schoolmaster’s salary. Towns were permitted to hold private lotteries to raise funds for these
purposes, but local governments during this period generally saw education as a family matter. As
such, schools relied primarily on private tuition payments rather than public support, and therefore
operated almost exclusively for the benefit of wealthier residents.32

The first law requiring the establishment of free schools in Rhode Island was the Act of 1800. The
Act attempted to establish a shared financial responsibility for funding schools between the state
and its cities and towns.33 However, the Act failed to the extent that several towns refused to

28
 Scott Dallman, Anusha Nath, and Filip Premik, “The Effect of Constitutional Provisions on Education Policy and
Outcomes,” Federal Reserve Bank of Minneapolis, 2021.
29
 Jason Kopanke, “A Contemporary Understanding of the Effects of the Third Wave of School Finance Litigation,”
University of Northern Colorado, 2020; Stephen Q. Cornman, Esq., “Do Equity and Adequacy Court Decisions and
Policies Make a Difference for At-Risk Students following Abbott, Rose, McDuffy, and Hancock? Longitudinal
Evidence from New Jersey,” Columbia University, 2017; William J. Glenn, “School Finance Adequacy Litigation and
Student Achievement: A Longitudinal Analysis,” Journal of Education Finance, vol. 34, no. 3 (2009): 247–66; David
C. Thompson and Faith E. Crampton, “The Impact of School Finance Litigation,” Educational Considerations, vol.
28, no. 1 (2000).
30
 Ellwood Patterson Cubberley, Public education in the United States, a study and interpretation of American
educational history; an introductory textbook dealing with the larger problems of present-day education in the light
of their historical development, (Boston: Houghton Mifflin, 1919).
31
 Charles Carroll, Public Education in Rhode Island, (Providence: E.L. Freeman Company, 1918).
32
 Francis X. Russo, “John Howland: Pioneer in the Free School Movement,” Rhode Island History vol. 37, no. 4
(1978).
33
 The Act of 1800 remitted 20 percent of taxes paid to the state by towns and mandated that these funds be used to
establish and operate schools. Charles Carroll, Public Education in Rhode Island, (Providence: E.L. Freeman
Company, 1918).

 Page 10 of 50
organize schools as required.34 The Act was repealed in 1803, leaving the state without a unified
system of public schooling for the next 25 years.35

In 1828, the General Assembly enacted legislation to establish a state education fund financed by
lotteries and auctions. Cities and towns received a disbursement proportional to their under-16
population and were given the authority to raise a maximum local appropriation of up to twice the
amount received from the state fund. The Act of 1828 also established municipal school
committees.36 Unlike the Act of 1800, municipalities were not required to make public schools
free, leading to greater willingness among the state’s cities and towns to participate. Across the
state, towns began electing school committees, establishing school districts, and raising revenues
for schoolhouses and teachers.37

Beginning in the mid-19th century, the roles of the state and local governments in financing
education evolved as Rhode Island began adopting many of the progressive education reforms that
were taking hold in other Northern states. The 1845 Barnard School Act eliminated the maximum
local appropriation for education and instead conditioned state aid on a minimum level of town
support.38 In 1849, the General Assembly enacted a state property tax to fund education after
proposals to set equal state and local shares of education funding failed. Tuition fees were
abolished in 1868, and in 1882, local support of public schools was made mandatory.39

Constitutional Approaches to Education in Rhode Island

As the General Assembly was grappling with how to approach government’s role in providing
public education, so were the authors of Rhode Island’s constitution, adopted in 1842. Article XII,
Section 1 of the constitution provides that “it shall be the duty of the general assembly to promote
public school, and to adopt all means which they may deem necessary and proper to secure to the

34
 A notable exception is Providence, where a local movement supporting the establishment of free education was led
by the Providence Association of Mechanics and Manufacturers. Upon passage of the Act of 1800, the city established
a system of free schools that would become the model for future efforts to convince other municipalities to follow
suit. Ryan Nadeau, “New Technology, Old Problem: Developing OER Policies to Provide Low-Cost Materials for
Rhode Island’s Public Universities.”
35
 Charles Carroll, Public Education in Rhode Island, (Providence: E.L. Freeman Company, 1918).
36
 Thomas B. Stockwell, History of Public Education in Rhode Island, (Providence Press Company, 1876).
37
 Charles Carroll, Public Education in Rhode Island, (Providence: E.L. Freeman Company, 1918).
38
 Ibid; The Act was named for Henry Barnard, who had been appointed by Governor Arthur Fenner to study the
condition of Rhode Island’s school system. His report recommended a host of reforms, including that the state increase
its appropriation to schools such that cities and towns would be compelled to make reforms in the interest of making
public education more equitable. Will Seymour Monroe, The educational labors of Henry Barnard; a study in the
history of American pedagogy, (Syracuse, N.Y.: C.W. Bardeen, 1893); Henry Barnard, Report on the Condition and
Improvement of the Public Schools of Rhode Island, (Providence: B. Cranston & Company, 1846).
39
 When private tuition payments were abolished, three-fourths of local governments relied on this revenue source to
fund schools. Charles Carroll, Public Education in Rhode Island, (Providence: E.L. Freeman Company, 1918).

 Page 11 of 50
people the advantages and opportunities of education.”40 The constitution also outlawed the use of
lotteries for raising public funds, a popular method for raising education revenues at the time.41

In 1986, Rhode Island voters approved a new state constitution with proposed amendments and
alterations adopted through a year-long constitutional convention. The convention worked to
modernize the language of the 1842 constitution and remove sections that had been nullified by
subsequent amendments. The convention also considered 290 resolutions that proposed
substantive changes and additions.42 Although several proposals to amend the constitutional
language on public education were considered, Article XII, Section I was fundamentally
unchanged in the version approved by voters.43

The City of Pawtucket vs. Sundlun

By the second half of the 20th century, Rhode Island had moved to a “percentage equalizing” model
of education finance, whereby cities and towns received formula-based reimbursement from the
state for a portion of their educational expenses based on their relative level of local property
wealth. The Foundation Level School Support Act of 1960 guaranteed a minimum reimbursement
of 25 percent, leading to relatively high levels of reimbursement for wealthier communities by the
1980s.44

The state began phasing out the minimum-share ratio in 1991. That year, Rhode Island was thrown
into economic recession as a result of the credit union crisis. Due to severe budget shortfalls, the
General Assembly instituted a cap on state operations aid which resulted in a pro rata reduction in
state funding for districts. The state’s share of operations aid for public schools dropped sharply
as a result, from 52.3 percent in 1991 to 38.1 percent in 1992.45

Reductions in state aid spurred a lawsuit against the state by the cities of Pawtucket, Woonsocket,
and West Warwick, which argued that the state’s system for distributing education aid violated
Article XII of the state constitution. The City of Pawtucket et. al. vs. Sundlun reached the Rhode
Island Supreme Court in 1995, where the case was decided in favor of the state. Although the
court’s justification was wide-ranging, the majority opinion’s essential ruling was that Article XII

40
 Rhode Island State Constitution, Article XII, Section 1 (1842). This language, and the rest of the contents of Article
XII, were similar to approaches to education in the proposed People’s Constitution (1841-1842) and Landholders’
Constitution (1842).
41
 Charles Carroll, Public Education in Rhode Island, (Providence: E.L. Freeman Company, 1918).
42
 Office of the R.I. Secretary of State, “Annotated Edition: Constitution of the State of Rhode Island and Providence
Plantations,” 1988. Twenty-six resolutions were submitted for consideration by the Convention, which were
consolidated into 14 ballot questions. Voters approved 17 resolutions across eight of the ballot questions.
43
 City of Pawtucket v. Sundlun, 662 A.2d 40 (R.I. 1995).
44
 The minimum reimbursement level fluctuated in subsequent years. Rhode Island Public Expenditure Council,
“Funding our Future – An Approach to Fund Education in RI,” April 2007. In the 1988-1989 school year, the state
provided the minimum share of 28 percent reimbursement to nine municipalities, five of which would have qualified
for less than five percent reimbursement based on levels of local property wealth. City of Pawtucket v. Sundlun, 662
A.2d 40 (R.I. 1995).
45
 City of Pawtucket v. Sundlun, 662 A.2d 40 (R.I. 1995).

 Page 12 of 50
of the Rhode Island Constitution gave the General Assembly “unreviewable discretion” on matters
of education, thereby foreclosing the possibility of significant judicial intervention into the state’s
education finance system.46

Since the decision in City of Pawtucket vs. Sundlun, reformers have debated whether the state
should pursue an amendment to the Rhode Island Constitution that would give the courts greater
standing to rule on the adequacy and fairness of the education finance system. In 2021, the Rhode
Island Senate passed Senate Bill 205, which would have put this question to voters, but the bill did
not advance in the House of Representatives.47 Similar legislation was again passed by the Rhode
Island Senate in March 2022 and is currently pending in the House of Representatives.48

The Education Funding Formula

Despite the upholding of the status quo by the Rhode Island Supreme Court in City of Pawtucket
vs. Sundlun, the General Assembly moved forward with reforms designed to make K-12 funding
more equitable. In 1994, the minimum state share was fully phased out and the Assembly weighted
the statutory formula to provide additional funding for districts serving a high number of students
living in poverty, appropriating $46 million in “poverty weight” aid, which was distributed to
districts according to the number of students eligible for FRPL.49 In the wake of City of Pawtucket
vs. Sundlun, it also was acknowledged that the state needed a stable funding formula to direct state
aid based on relative property wealth and the concentration of student poverty. In the early 2000s,
lawmakers conducted various studies on the creation and implementation of a permanent funding
formula, but no action was taken, and by 2009, Rhode Island was the only state in the country
without a specific formula enacted in statute for determining education aid.50

Action by the federal government helped to advance efforts to establish Rhode Island’s education
funding formula. As part of the American Recovery and Reinvestment Act of 2009, $4.35 billion
was allocated to the United States Department of Education for the Race to the Top initiative. The
initiative set up a competitive grant process, whereby states received funding based on how they
scored on certain metrics.51 A key aspect of Race to the Top scoring was demonstrating increased
attention to education funding, particularly to increase funding for low-achieving LEAs. Thus, the

46
 Ibid. In its majority opinion, the Court argued that the decision of the 1986 Constitutional Convention not to
fundamentally alter Article XII, despite receiving several proposals to do so and given the movement among other
states to institute stronger constitutional language on the matter of education finance, indicated that “the framers of
the 1986 Constitution did not intend to alter the state’s approach to funding education or to impose new constitutional
requirements upon the General Assembly in respect to Education.”
47
 Senate Bill S205, 2021.
48
 Senate Resolution 2095, 2022.
49
 Kenneth K. Wong, “The Design of the Rhode Island School Funding Formula: Toward a Coherent System of
Allocating State Aid to Public Schools,” August 2011.
50
 Ibid.
51
 The metrics encouraged a focus on turning around low-performing schools, attracting and training high-quality
teachers, and building up capacity and data systems. William G. Howell, “Results of President Obama’s Race to the
Top,” Education Next, 2015.

 Page 13 of 50
state had an incentive in the form of federal grant dollars to address the inequities in district
funding.52

Beginning in fall 2009, State Education Commissioner Deborah Gist and the State Board of
Regents convened a study and design team to develop a funding formula proposal. The group was
tasked with proposing a funding structure that met a set of pre-approved principles—education
dollars should follow the student across different schools or districts, the state should identify a
target level of per pupil cost necessary to educate each student, and the formula should determine
how much of that necessary education expense should respectively be provided by the state and
by local government. Public information sessions and stakeholder discussions were held in early
2010 to solicit feedback. Legislation reflecting the design team’s recommended language
successfully advanced through the General Assembly and was signed into law by Governor Donald
Carcieri in June 2010.53

The new funding formula instituted a ten-year phase-in period, beginning in FY 2012. This phasing
was due in part to the redistribution of aid away from certain communities that no longer qualified
for the same level of state support under the new formula. 54 For the districts receiving less state
aid under the new formula, reductions were phased in over the course of the full ten-year period.
For districts receiving more state aid under the new formula, increases were phased in over a seven-
year period. As of FY 2021, the formula was fully phased in.55

Section III contains an overview and analysis of how Rhode Island’s funding formula operates.

52
 Lesli A. Maxwell, “R.I. Aims at Equity in Funding Formula,” EducationWeek, 2010. In the 2009-10 school year,
per pupil expenditures in Rhode Island ranged widely between districts, from a low of $10,544 in Cumberland to a
high of $35,687 in New Shoreham. While New Shoreham is a statistical outlier, Jamestown, the district with the
second highest per pupil expenditures, spent $24,597. Rhode Island Public Expenditure Council, “Results: Education
in Rhode Island 2011,” December 2011.
53
 Kenneth K. Wong, “The Design of the Rhode Island School Funding Formula: Toward a Coherent System of
Allocating State Aid to Public Schools,” August 2011.
54
 Ibid.
55
 R.I. House Fiscal Advisory Staff, Rhode Island Education Aid, September 2021.

 Page 14 of 50
III. Education Revenues

This section describes how revenues for K-12 education are raised at all three levels of government
and distributed to LEAs in Rhode Island. It also compares the state’s education finance system to
the region and nation—both in terms of the total amount of revenues raised and the mix of revenue
streams.

Revenue Overview

Education revenues in Rhode Island totaled $2.60 billion in FY 2020, $2.42 billion of which was
collected for traditional school districts.56 As shown in Figure 1, Rhode Island dedicates relatively
high levels of revenues to finance its K-12 education system compared to the United States but is
relatively low in this measure compared to other New England states. In FY 2019, Rhode Island
LEAs collected $19,169 in per pupil revenues, ninth highest among all states, and 20.2 percent
higher than the national total of $15,656 per pupil. However, Rhode Island ranked fifth of six New
England states in per pupil education revenues that year.57

56
 FY 2020 is the last year for which a complete Rhode Island data set is available. Total revenues exclude transfers
between LEAs in the form of tuition payments, which are counted as revenue raised by traditional districts. RIDE,
UCOA data; RIPEC calculations.
57
 U.S. figure represents a total, not an average, of states. Rankings do not include Washington D.C. U.S. Census
Bureau, 2019 Annual Survey of School System Finances.

 Page 15 of 50
As highlighted in Figure 2, states differ in the extent to which they rely on revenues from local,
state, and federal governments to finance K-12 education. Nationwide, in FY 2019, 46.7 percent
of education revenues came from state sources, while 45.6 percent were derived from local
sources, and 7.7 percent from federal sources. Comparatively, Rhode Island has a heavier reliance
on local revenues, with 52.1 percent of total education revenues derived from local sources in FY
2019, 14th highest in the nation. Relatively heavy reliance on local education revenues is
characteristic of the New England region; among New England states, Rhode Island’s local
revenue reliance in FY 2019 was smaller than only Vermont, which ranked 49th highest in the
country and is somewhat unique in deriving nearly all education revenues from state sources.58
State revenues made up 40.8 percent of total FY 2019 education revenues in Rhode Island (37th
highest among states) and 7.1 percent of total education revenues in the Ocean State were from
federal sources (29th highest).59

While Rhode Island’s K-12 education system relies on local sources for most of its education
revenues and is more reliant on local funds than the nation overall, the most significant trend within
Rhode Island’s education finance system over the past decade has been an increase in the state
share of total revenues. State revenues were significantly smaller than local revenues in FY 2012,
making up 32.0 percent of total revenues while local revenues made up 58.2 percent of total

58
 Like other New England states, Vermont’s education system relies heavily on property tax revenue. In Vermont,
however, property tax rates are set according to levels of education spending. Much of this revenue is transferred to
the state, which then disburses education aid to LEAs according to voter-approved levels of per pupil expenditures.
Vermont Legislative Joint Fiscal Office, “Introduction to Vermont’s Education Finance System,” January 2019.
59
 U.S. Census Bureau, 2019 Annual Survey of School System Finances. 2019 is the last year for which 50-state
rankings are available. Subsequent figures rely on finance data from the Rhode Island Department of Education
(RIDE), which provide more recent data as of FY 2020 but report an FY 2019 revenue mix of 55 percent local, 38
percent state, and 8 percent federal. RIDE, UCOA data.

 Page 16 of 50
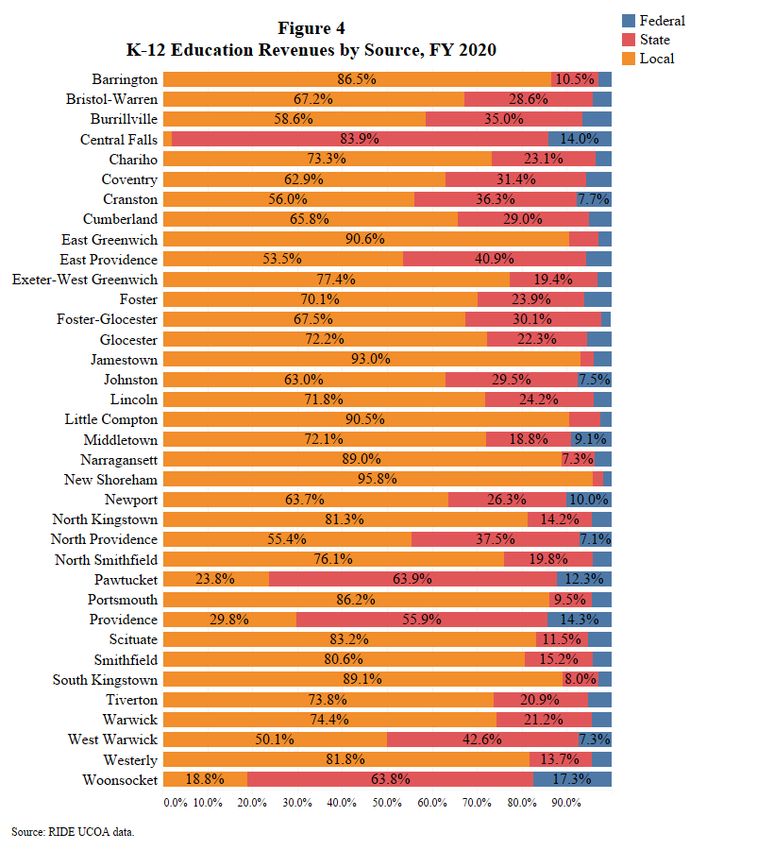
revenues. However, state revenues contributed to 60.8 percent of the total growth in education
revenues between FY 2012 and FY 2020, such that the proportion of state revenues increased by
5.3 percentage points over that period (from 32.0 percent to 37.3 percent), as demonstrated in
Figure 3.60

The extent to which Rhode Island districts rely on state, local, and federal revenue varies widely
across the state, as shown in Figure 4. While comprising 37.3 percent of total K-12 education
revenues statewide in FY 2020, state aid comprises over half of total revenues in four districts—
Providence, Woonsocket, Pawtucket, and Central Falls.61 At the other extreme, state aid is less
than ten percent of total revenues in seven districts.62 Similarly, the local share of education
revenues is 54.7 percent statewide, but represents over 90 percent of total revenues in four districts
and less than one third of total revenues in four districts.63 These wide variations are primarily the
result of state financing policy, in particular the state’s education funding formula, discussed at
length below.

60
 RIDE, UCOA data; RIPEC calculations.
61
 RIDE, UCOA data. Revenues from state sources make up 83.9 percent of total revenues in the Central Falls School
District. RIDE has had financial responsibility for Central Falls schools since the district was taken over by the state
in July 1991 at the request of the city. See: R.I. Division of Municipal Finance, City of Central Falls, Rhode Island:
Audited Financial Statements and Supplementary Information, for the Fiscal Year Ended June 30, 2018.
62
 Those districts are: New Shoreham, Jamestown, East Greenwich, Little Compton, Narragansett, South Kingstown,
and Portsmouth. RIDE, UCOA data.

 Page 17 of 50
Local Revenue

Despite a decline in the local share of education revenues in Rhode Island over the past decade,
local education revenues have continued to grow on a nominal basis and remain the largest source
of education funding in the state. Between FY 2014 and FY 2019, local education revenues in
Rhode Island grew by 10.0 percent, slightly lower than the 12.6 percent growth in total municipal

 Page 18 of 50
general revenues over the same period.64 Rhode Island municipalities raised a collective $1.46
billion in education revenues in FY 2020.65 Unlike the state government, which provides aid to
districts determined by a formula in statute, local governments have rather wide discretion to
determine their level of contribution to schools. Consequently, many of the financial disparities
between districts result from local factors, particularly a municipality’s relative property wealth,
its ability or willingness to raise revenue from property taxation, and its general allocation of
resources across municipal services.

School Governance

Local districts in Rhode Island, whether comprising a single municipality or operating as a regional
district, are managed by locally elected school committees.66 School committees are responsible
for developing school budgets but have no power to raise funds through taxation or other means.
After adopting a budget, school committees present their proposed spending plan to the city or
town council, which holds the power to raise the requisite revenues.67

Funding disputes between school committees and city or town councils are resolved through a
process spelled out in the Caruolo Act, enacted by the Rhode Island General Assembly in 1995. If
a school budget is not large enough to meet federal and state requirements, school committees may
petition the Rhode Island Department of Education (RIDE) to relax or otherwise alter those
requirements. If not approved, the committee may seek additional appropriations, first by
petitioning the city or town council and then through legal action in the Rhode Island superior
court.68

Property Taxation

As described in Section II of this report, property taxation became the primary revenue source for
local governments as spending on public schools began to grow rapidly in the early part of the 20th
century. Today, property taxes and education finance are closely intertwined in Rhode Island, as
property tax remains the dominant source of local revenue, accounting for 60.4 percent of overall
municipal revenues in FY 2019.69

64
 RIDE, UCOA data; U.S. Census Bureau, Annual Survey of State and Local Government Finances; RIPEC
calculations. FY 2019 is the last year for which total municipal general revenues are available.
65
 Ibid.
66
 Every district in Rhode Island has a publicly elected school committee except for Providence, which has a mayor-
appointed school committee.
67
 Rhode Island Public Expenditure Council, “An Introduction to Municipal Finance in Rhode Island,” April 2021.
School committees for regional school districts are comprised of members elected by each of the municipalities
covered by the district. Regional school committees meet independently with the city or town council of each
municipality contained within the district to seek approval of the school district budget. R.I. Gen. Laws §16-2-21.3.
68
 For regional school districts, the school committee may submit a written request for additional appropriations to
each municipality contained within the district. R.I. Gen. Laws §16-2-21.4.
 69
 This figure includes state and federal transfers as a source of municipal revenue. Rhode Island Public Expenditure
Council, “A System Out of Balance: Property Taxation Across Rhode Island,” January 2022.

 Page 19 of 50
However, local revenues—and property taxes by extension—do not play a primary role in
financing education in every municipality. The share of local revenues as a proportion of total
education revenues was less than one-quarter in three Rhode Island communities and greater than
90 percent in four communities in FY 2020.70 This wide disparity reflects stark inequalities among
municipalities in their ability to raise sufficient revenue from property taxes, a factor directly
accounted for in the state’s education funding formula. Property wealth across communities can
be compared using per capita gross assessed value, or the per person value of the total property a
municipality could tax, discounting only the value of property made exempt by state and federal
law, and disregarding local exemptions. In FY 2019, Central Falls had the state’s lowest per capita
gross assessed value—$26,427—while six municipalities had per capita values greater than
$250,000. Statewide, the per capita gross assessed value for FY 2019 was $120,716.71

Municipalities with relatively small property tax bases generally rely on higher property tax rates
to raise revenue for basic government services, including education. In addition to the burden high
rates place on taxpayers, municipalities with low levels of property wealth are challenged to
meaningfully increase their local contribution to education in response to student needs or growing
enrollment. The four communities with the lowest reliance on local revenues for education—
Central Falls, Woonsocket, Pawtucket, and Providence—all impose relatively high property tax
burdens on taxpayers.72

Maintenance of Effort

Maintenance of effort (MOE) is a common requirement in public finance, whereby governments,
typically state and local, are required to maintain levels of funding for certain programs or services
as a condition of accepting an intergovernmental grant. Such provisions are designed to ensure
that intergovernmental grants supplement, rather than supplant, existing funding. Presently, Rhode
Island’s MOE law for K-12 education requires that school districts maintain education funding at
least at the same level from year-to-year. Districts are not required to increase local funds year-
over-year regardless of increases in student enrollment but may reduce local funding
proportionally to account for a decrease in enrollment.73

70
 The communities relying on local revenues for less than 25.0 percent of total education revenues are Central Falls
(2.0 percent), Woonsocket (18.8 percent), and Pawtucket (23.8 percent). The communities where local revenues make
up over 90 percent of total education revenues are Little Compton (90.5 percent), East Greenwich (90.6 percent),
Jamestown (93.0 percent), and New Shoreham (95.8 percent). RIDE, UCOA data.
71
 New Shoreham, Little Compton, Jamestown, Narragansett, Charlestown, Newport, and Westerly each had per capita
gross assessed value above $250,000. Rhode Island Public Expenditure Council, “A System Out of Balance: Property
Taxation Across Rhode Island,” January 2022.
72
 A business operating in Central Falls with $1 million in assessed commercial real property and $200,000 in assessed
tangible property would face tax a tax burden of $42,330 in FY 2022, the highest in the state. The burden for that
business would be $36,700 in Providence, $34,750 in Woonsocket, and $29,020 in Pawtucket, compared to the
statewide median of $19,440. Ibid.
73
 If facing enrollment decreases, districts have the option of demonstrating MOE on a per pupil, rather than nominal,
basis. R.I. Gen. Laws §16-7-23. Additionally, districts identified as “high local contribution communities”—defined
as those districts that fund at least 85.0 percent of the Basic Education Plan (BEP) with local funds—or those identified
as “high per pupil expenditure communities”—defined as those districts meeting the full BEP and state benchmarks

 Page 20 of 50
This MOE level funding requirement allows for municipalities to decrease their per pupil local
contribution to education if student enrollment increases and nominal funding stays the same. For
example, Providence kept its local education contribution at the same level from FY 2012 to FY
2016 while enrollment in Providence schools increased by 1.5 percent. As a result, the local per
pupil contribution by the City of Providence declined from $5,311 in FY 2012 to $5,233 in FY
2016.74

Funding Follows the Student

While the reforms instituted with Rhode Island’s education funding formula primarily govern the
state’s share of K-12 education funding, the local share is affected by a principle built into the
formula that local funding should follow students who attend public school outside of their home
district, whether at a state school, public charter school, or another district. The state uses yearly
enrollment data to ensure that per pupil funding raised by the sending school district—the district
where the student lives—is allocated to the receiving LEA, where the student is enrolled.75

At the time the funding formula was implemented, sending districts were required to allocate to
receiving districts the entire local payment rate, calculated as the per pupil local property tax
allocation for education in the sending district.76 In 2016, a change was implemented that allowed
sending districts to reduce the amount of local dollars sent to charter and state schools by using a
formula meant to adjust for the unique financial obligations faced by sending districts. The change
allowed sending districts to reduce their contribution by the greater of two figures: (1) seven
percent of the local payment rate or (2) the per pupil value of certain expenses incurred by sending
districts minus the average per pupil cost for such expenses incurred by all public charter schools.77
Based on this provision, 8.9 percent of local education funding was held back statewide in FY
2021. Most districts held back seven percent while seven communities held back amounts ranging
between 9.5 percent and 25.8 percent.78

for expenses outside the BEP (such as transportation or facility maintenance)—may reduce their local appropriation
to schools by up to 10.0 percent of any increase in state education revenues received by the district. R.I. Gen. Laws
§ 16-7-23.1.
74
 Providence Public School Department; RIDE, October enrollment data; RIPEC calculations.
75
 Kenneth K. Wong, “The Design of the Rhode Island School Funding Formula: Toward a Coherent System of
Allocating State Aid to Public Schools,” August 2011.
76
 This calculation includes all public school students residing in the community, regardless of whether they attend
school within or outside the district, and does not include costs incurred from debt service or capital projects. RIDE,
“Funding Formula Reference Guide - Spring 2018.”
77
 Eligible expenses include “non-public textbook and transportation, retiree health benefits, out-of-district special
education tuition and transportation, services for students ages 18-21, pre-school screening and intervention, career
and technical education tuition and transportation, debt service, and rent.” Rhode Island Public Expenditure Council,
“An Analysis of Charter Public Schools in Rhode Island,” June 2021. This calculation does not apply to Central Falls
schools, which are under the financial control of the state. RIDE maintains a separate calculation to determine the
city’s local payment rate. RIDE, “Funding Formula Reference Guide: Spring 2018.”
78
 Those municipalities are Bristol-Warren (11.8 percent held back), Foster-Glocester (25.0 percent), Jamestown (10.7
percent), Johnston (9.1 percent), North Providence (15.9 percent), Pawtucket (24.1 percent), and Woonsocket (25.8

 Page 21 of 50
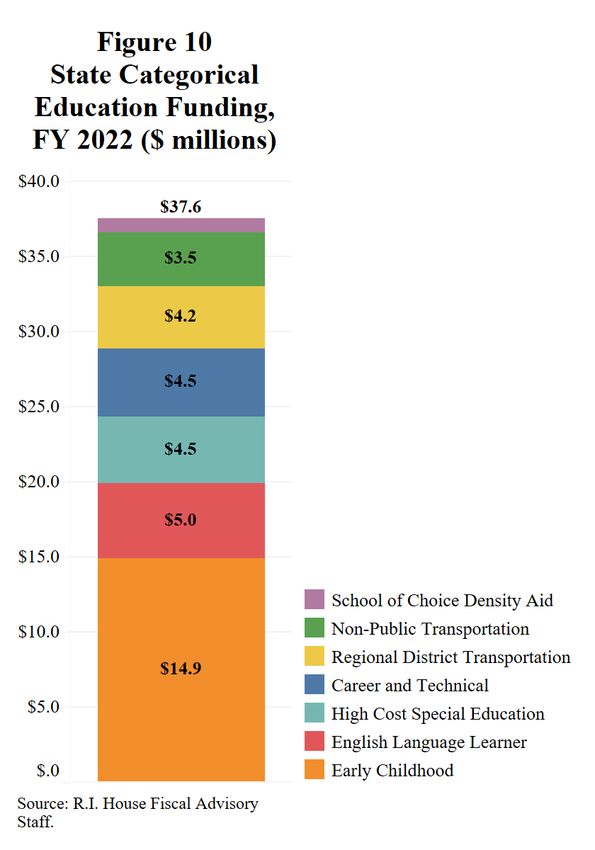
State Revenues

The second largest component of education revenues in Rhode Island—totaling $995.5 million in
FY 2020—is state aid, which is primarily comprised of direct aid allocated through the state’s
education funding formula. Other sources of state education funding include categorical funding,
school construction aid, and teacher pension contributions. In general, the adoption and
implementation of the state’s funding formula has resulted in a greater investment in K-12
education by the state, with state education aid growing at a rate exceeding the growth of total state
revenues; from FY 2014 through FY 2019, education revenues from state sources increased by
22.7 percent, compared to growth in overall state general revenues of 17.6 percent.79

The state’s education funding formula is designed in large part to direct greater state aid to those
districts with less ability to raise money from property taxes and other local sources. Consequently,
municipalities that can collect greater levels of per pupil local revenues, such as New Shoreham
and Jamestown, receive only minimal allocations of state formula aid that amount to small
proportions of their overall education funding (respectively 2.3 percent and 3.0 percent in FY
2020). On the other end of the spectrum, municipalities with smaller property tax bases rely heavily
on state aid. State aid made up a majority of FY 2020 education revenues in Central Falls (83.9
percent), Pawtucket (63.9 percent), Woonsocket (63.8 percent), and Providence (55.9 percent).80
These four districts represented 30.7 percent of all K-12 students attending traditional school
districts in FY 2020.81

Resident Average Daily Membership

States use a variety of measures to calculate the student population for the purposes of determining
state aid under their respective funding formulas. Rhode Island is one of 23 states that use a
membership average, which aims to calculate enrollment throughout the school year to account
for fluctuations.82 In Rhode Island, enrollment is determined using Resident Average Daily
Membership (RADM), which is calculated by dividing the aggregate number of days of school
enrollment of all pupils residing within a district by the number of days in which school was in

percent). Five municipalities had no resident students attending charter schools and thus held back no local
contributions. In total, traditional districts paid out local contributions of $52.2 million to charter schools in support
of 10,609 students FY 2021. Rhode Island Public Expenditure Council, “An Analysis of Charter Public Schools in
Rhode Island,” June 2021.
79
 RIDE, UCOA data; U.S. Census Bureau, Annual Survey of State and Local Government Finances; RIPEC
calculations.
80
 RIDE, UCOA data. Because the state assumes financial control over Central Falls schools, its high reliance on state
aid is not a direct function of the funding formula.
81
 Providence makes up 17.5 percent of K-12 students attending traditional districts. RIDE, Funding Formula
Calculations; RIPEC calculations.
82
 Education Commission of the States, “Student Counts in K-12 Funding Models,” 2022.

 Page 22 of 50
session, excluding students attending charter and state schools.83 For purposes of the funding
formula, RADM data for the fiscal year beginning July 1 is calculated in March of every year using
aggregate enrollment data from the current school year.84

Foundation Aid

The core concept of Rhode Island’s funding formula is the determination of a district’s foundation
cost, which is the total cost of educating a student—according to a pre-determined set of cost
inputs—multiplied by the RADM, plus an additional weight for students living in poverty. The
first component of the foundation cost is the core instructional cost, which seeks to quantify the
per student cost for core instructional expenses. The adopted calculation is based on data from the
National Center for Education Statistics (NCES) and includes the cost of seven categories of core
services, listed in Figure 5, across four states: Connecticut, Massachusetts, New Hampshire, and
Rhode Island. The chosen
expenses align with the Basic Figure 5
 Expenses Included in Core Instructional Amount
Education Plan (BEP), a set
 Percent
of regulations within RIDE Funded in
 Category Expenses
that identify academic Cost of Core
 Instruction
standards which all public Salaries for teachers (including part-time and
schools are required to Instructional Staff substitute), teacher aides
 100%
 Salaries and contracts for techinical and
meet.85 The designers of the Other Instructional Services professional services, supplies, textbooks
 100%

formula chose a mix of New Salaries for social workers; guidance
 counselors; staff in health, psychology, speech,
England states to account for Student Support pathology and audiology; nurses, coaches,
 100%

region-specific costs for the supervisors, summer school teachers

included expenses.86 Salaries for supervisors of instruction, library,
 media, and computer lab staff, curriculum
 Other student support coordinators, in-service teacher training staff; 100%
At the time of the formula’s salaries and contracts for progessional services,
 supplies, texbooks, profressional dues and fees
adoption, the design team Salaries for school board members, school
determined the 2010 core General District Administration board staff, superintendent, central office staff, 100%
 and purchased services and contracts
instructional amount by Salaries for principals, department chairs,
taking 2005 spending data School-Level Administration administrative staff; purchased services; 100%
 supplies; and progressional dues and fees
from the NCES and adjusting Fringe benefits for instructional, administrative,
 Staff Benefits 60%
by a regional consumer price and support staff
 Source: Kenneth K. Wong, "The Design of the Rhode Island School Funding Formula: Toward a Coherent System of Allocating State Aid to Public
 Schools."

83
 In addition to students attending schools in their resident districts, aggregate days of school attendance by students
attending outside of their district of residence are counted for the resident district if the resident district is paying local
tuition for that student to attend a RIDE-approved school in another city or town. To avoid double counting, a district’s
aggregate school attendance is decreased by the aggregate attendance days of nonresident pupils attending school in
that city or town. R.I. Gen. Laws § 16-7-22.
84
 RIDE also publishes a statewide enrollment count in October of every year. FY 2020 RADM was 142,202, while
October 2019 enrollment was 143,557.
85
 R.I. Board of Education, 200-R.I. Code of Regulations-20-10-1.
86
 R.I. Senate, “Special Legislative Task Force to Study Rhode Island’s Education Funding Formula: Findings and
Recommendations,” January 28, 2020.

 Page 23 of 50
You can also read